1.IntroductionFor biomedical applications, optical techniques that are based on the intrinsic optical properties of biological tissues, such as light scattering, absorption, polarization, and fluorescence, have many advantages over conventional X-ray computed tomography, magnetic resonance imaging (MRI), and ultrasound imaging techniques in terms of safety, cost, contrast, and resolution features. However, one of the limitations of current optical techniques is that the depth of light penetration is limited in biological tissues because of their highly scattering nature. Biological tissues are optically inhomogeneous and absorbing media. Multiple scattering and absorption are responsible for broadening and eventual decay of a light beam as it travels through a tissue.1 The penetration depth of light is dependent on the absorption and scattering properties of the tissue. Because of the low absorption, the best penetration is achieved by light with a wavelength ranging from approximately 700 to 1400 nm.2 When imaging with near-infrared light, the dominant process that limits the imaging depth and contrast is multiple scattering rather than absorption.3 4 As a consequence, in order to enhance the depth of light penetration, multiple scattering in tissue must be reduced. A plausible method for reducing light scattering in tissue and thereby enhancing the penetration of light is the topical application of hyperosmotic and biocompatible chemical agents that would induce optical clearing in the tissue, a concept pioneered by Tuchin.5 6 A series of studies have shown that osmotically active chemical agents are effective in changing the optical properties of in vitro and in vivo tissues.5 6 7 8 9 10 11 Hyperosmotic chemical agents such as glycerol, dimethyl sulfoxide (DMSO), propylene glycol, mannitol, glucose, or dextrose, cause turbid tissues—for example skin, sclera, and aorta—to become optically transparent because of the creation of a refractive index that matches the environment within the tissue. It is suggested that these agents would reduce light scattering through refractive index matching in two ways. The first is simply by matching the refractive index of the chemical agent to the main constituents and components of a tissue.6 7 8 9 The second is by dehydration that is due to the osmotic characteristics of these agents, which results in water loss from the interstitial space, causing the scattering components to be tightly packed.8 12 As a consequence, the concentration of glycosamino proteins within tissue is increased and gives rise to an increased refractive index for the background medium. To induce optical clearing of a tissue, chemical agents should be able to pass through both the superficial block of tissues and the membrane of cells within the tissue by diffusion. At the same time, water diffuses out from the tissue, drawn by the high osmolarity of the chemical solutions outside the tissue.10 The dynamics of this mass transport process is a very complicated phenomenon that depends on the osmotic and diffusion characteristics of the agent applied to the tissue. However, the effects of the dynamics of diffusion and dehydration on the refractive index matching process still remain unclear. In an attempt to better understand the influence of the diffusion characteristics of a chemical agent on the tissue-clearing process, we investigated experimentally the dynamic optical clearing effect of glycerol and DMSO, using optical coherence tomography (OCT). Glycerol and DMSO were chosen, not only because they are two common agents that are used currently for optical clearing of tissue, but also because they possess different diffusion characteristics within tissue, with DMSO having a much faster diffusion rate than glycerol.13 14 It is shown that both agents can greatly improve the depth of OCT imaging of tissue. However, during a period of approximately 20 to 30 min after the topical application of glycerol, we observed that image contrast was also enhanced. This enhancement disappeared with the passage of time. Such image contrast enhancement was not observed when DMSO was administered. The difference in the time courses of the two chemicals suggests that the tissue clearing occurs at a subcellular level by permeation of cell membranes rather than at a cellular level. 2.Materials and MethodsFigure 1 is a schematic of the OCT system used in this study, in which a broadband light source with the central wavelength at 1300 nm and a bandwidth of 52 nm is employed with an output power of 1.5 mW. The light source yields a 14-μm axial resolution in free space, or approximately 10 μm in the tissue if the mean refractive index of bulk tissue is assumed to be 1.38; this determines the imaging axial resolution of the system. Imaging was performed by directing low-coherence light at the sample and detecting the reflections from various internal structures by the use of an optical fiber integrated scanning system. Polarization controllers are used in both arms in order to obtain the maximum interference fringe visibility. The system employs a balanced detector to minimize the photon excess noise arising from the light source. The transverse resolution was measured at 16 μm, limited by the numerical aperture of the lens used to deliver the light onto the sample, and the optical frequency of incident light, as in conventional microscopy. The signal-to-noise ratio (SNR) of the system was measured at 97 dB by the use of a 4-OD neutral-density filter. For the scanning speed of the reference arm at 65 mm/s, the modulation was centered on a Doppler shift frequency of 100 kHz. At this speed, a typical OCT image of 256×120 pixel size required about 4 s. A visible-light source was used to guide the probe beam, as shown in Fig. 1. Figure 1Schematic of the OCT system. CL, collimating lens; FC, fiber coupler; PC, polarization controller; OL, objective lens; and D, detector.  Glycerol and DMSO were purchased from Sigma Co. Ltd. The concentration of the glycerol and DMSO solutions used in this study was reduced 50 by mixing the agents with saline solution. Glycerol, having the molecular formula HOCH 2 CHOHCH 2 OH and a refractive index of 1.47, has a wide variety of uses in the manufacture of numerous domestic, food, and pharmaceutical products.14 It is also a natural constituent of the human body that is created by the oxidation of stored body fat. DMSO, also having a refractive index of 1.47, is a by-product of the wood industry and has been in use as a commercial solvent since 1953.15 This chemical has also been used as a drug for a variety of ailments, including pain, inflammation, scleroderma, interstitial cystitis, and arthritis-elevated intercranial pressure.15 Fresh porcine stomach tissue was used as the tissue sample in the experiments. Stomach tissue was chosen for measurements because of the highly scattering nature of the gastric tissues. It was reported that achieving a depth of light penetration of more than 2 mm is problematic for gastrointestinal tract tissue. With an OCT technique, the imaging depth remains less than 0.5 mm for human stomach tissue.12 The porcine tissue specimens from the stomach were imaged with OCT within 5 to 7 h of removal. A metal needle was inserted into the tissue approximately 1 mm beneath the surface. The signals reflected back from the needle surface were used to suggest the improvement in the back-reflected light signal caused by the chemical clearing. Imaging was performed with a bench-top OCT system at room temperature. The position of the probe beam on the sample was monitored using a visible-light guiding beam. First, the specimens were irrigated with 0.9 saline to prevent dehydration and an OCT image was taken for later comparisons. Immediately after the first image was taken, the DMSO or glycerol solution (about 0.5 ml) was applied topically to the tissue surface and the tissue was allowed to absorb the chemical. A set of OCT images was then taken at the same site at intervals of 0, 10, 20, 30, 40, and 50 min after the topical application of an agent. Coregistration of the images obtained using OCT before and after the topical application of the DMSO or glycerol solution provided the basis for comparison. In some experiments, the OCT system was used in the single-point A-scan manner to obtain M-mode OCT images in order to investigate the dynamic clearing effect of the chemical agents on tissue within a time scale. To determine the quantity of water lost in tissue, the dynamic dehydration rate of the tissue was also obtained by measuring the distance between the tissue surface and a needle embedded within the tissue after the topical application of an agent. The final value was obtained from the average of three independent measurements. 3.ResultsFigure 2 shows dynamic OCT structural images of porcine stomach after topical application of a 50 glycerol solution, recorded at the intervals of 0, 10, 20, 30, 40, and 50 min. With the current OCT system working at a wavelength of 1300 nm, the OCT image of the porcine stomach without the administration of glycerol has a visualization depth of approximately 1.0 mm, as shown in Fig. 2(a). It can be clearly seen from Fig. 2 that there is a significant improvement in the imaging depth after the topical application of glycerol. The penetration depth has increased to about 2.0 mm 50 min after application of glycerol, as shown in Fig. 2(f). Tissue shrinkage also occurs after administration of the agent [Figs. 2(b)–2(f)]. The needle embedded in the tissue becomes brighter and brighter with time [Figs. 2(b) to 2(f)]. It should be pointed out that the image contrast in Figs. 2(c)–2(d) is also greatly improved. Such features as the lamina propria (LP) and the muscularis mucusae (MM) are clearly seen in Figs. 2(c) and 2(d). The neck, base, and MM layers of the tissue could be differentiated 20 to 30 min after application of glycerol. This is consistent with results from our previous experiments.12 The reflection from the needle’s surface is also sharp within this period. But it is interesting to see that with the passage of time, the improvement in image contrast gradually disappears, as shown in Figs. 2(e) and 2(f). Figure 2Dynamic OCT images obtained at (a) 0, (b) 10, (c) 20, (d) 30, (e) 40, and (f) 50 min after the topical application of a 50 glycerol solution to porcine stomach tissue. All units are in millimeters, and the vertical axis presents the imaging depth. MM, muscularis mucusae; SM, submucosa. 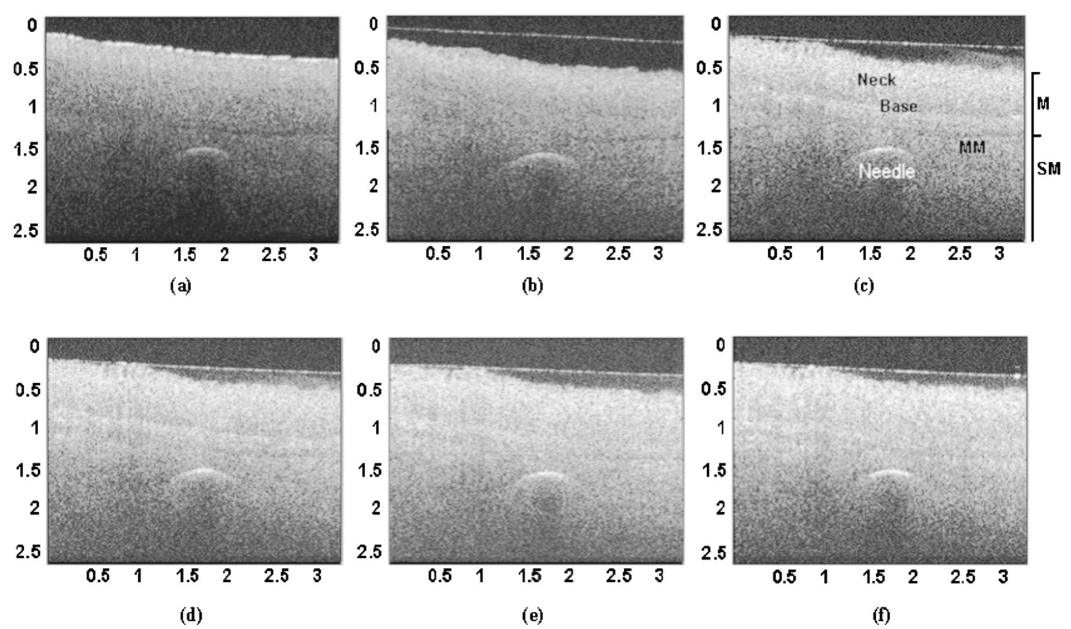 Figure 3 contains dynamic OCT structure images of porcine stomach after topical application of a 50 DMSO solution, again recorded at intervals of 0, 10, 20, 30, 40, and 50 min. As with glycerol, a significant improvement in the imaging depth can be seen in Figs. 3(b) to 3(f), compared with Fig. 3(a), after the application of DMSO. The penetration depth has increased to about 2.0 mm after 50 min, as shown in Fig. 3(f). However, an enhancement of image contrast was scarcely seen at time in these experiments. Shrinkage that is due to the dehydration of the tissue is not clear, as seen from Figs. 3(b) to 3(f). The reflection signal from the needle’s surface has approximately the same level from Figs. 3(b) to 3(f). Figure 3Dynamic OCT images obtained at (a) 0, (b) 10, (c) 20, (d) 30, (e) 40, and (f) 50 min after the topical application of a 50 DMSO solution to porcine stomach tissue. All units are in millimeters, and the vertical axis presents the imaging depth.  To further illustrate the different dynamics induced by the two agents, back-reflectance signals, along with penetration depth obtained with glycerol and DMSO administration are quantitatively plotted in Fig. 4 and Fig. 5, respectively. The signals were obtained at intervals of 0, 10, 30, and 50 min at the same spatial point, but averaged over ten repeated scans to minimize the random noise. It can be seen from Fig. 4(a) that after application of glycerol, the strength of the reflectance signal is gradually reduced, starting from the superficial layers, while the signals coming from the needle’s surface are gradually increase, from about 32, 40, and 45 dB, to 50 dB, as shown in Figs. 4(a)—4(d). This suggests that the reduction in the scattering property of the tissue is a function of time. However, for DMSO, as shown in Fig. 5, the reflectance signal from the needle’s surface was increased from about 28 to 50 dB immediately after the application of the agent [see also Figs. 5(b) and 5(a) for comparison]. After about 1 min, the signals from the tissue surface, the deeper layer of tissue, and the needle’s surface remain at almost the same level [see also Figs. 5(b)–5(d)]. Figure 4OCT in-depth back-reflectance profiles measured at (a) 0, (b) 10, (c) 30, and (d) 50 min after topical application of a glycerol solution to porcine stomach tissue.  Figure 5OCT in-depth back-reflectance profiles measured at (a) 0, (b) 10, (c) 30, and (d) 50 min after topical application of a DMSO solution to porcine stomach tissue.  Figure 6 shows the M-mode OCT images obtained from the repeated A-scans of the porcine stomach with the application of (a) glycerol and (b) DMSO. Because the system currently used requires manual relocalization of the tissue surface after topical application of an agent, the registration of OCT signal starts about 0.5 min after the application. From the images obtained with glycerol, it can be clearly seen that the penetration depth increases gradually with an increase in time. However, in Fig. 6(b), a significant improvement in depth appears immediately after the application of DMSO. This indicates that DMSO could clear tissue within a very short time. There is a slope in the surface of the tissue. The downward trend of the tissue’s surface is attributed to the dehydration induced by the chemical agents. Figure 6A comparison of the time course of repeated A-scans of porcine stomach tissue with the application of (a) glycerol and (b) DMSO. The horizontal and vertical axes present the time (in minutes) and the imaging depth (in millimeters), respectively.  Figure 7 shows the dynamics of dehydration effects after application of the glycerol and DMSO solutions. It can be seen that glycerol causes a greater water loss in stomach tissue than DMSO does. Between 0 and 30 min, dehydration induced by glycerol increases with time and reaches a maximum of approximately 12 at about 32 min. After this point, the curve goes down to 8 as the time increases to 50 min. It seems that rehydration occurs. Water reenters the tissue to make it swollen. The application of DMSO causes only a small percentage (about 1) of dehydration and the rehydration effect was not observed during the period investigated. These results were consistent with the continuous A-scan experiments shown in Fig. 6. 4.DiscussionSoft biological tissue is extraordinarily complex. It is composed of tightly packed groups of cells entrapped in a network of fibers through which tissue fluid percolates. Viewed on a microscope scale, the constituents of tissue have no clear boundaries. They appear to merge into a continuous structure that is distinguished optically only by spatial variations in the refractive index16 that cause the light scattering in biological tissue. To theoretically describe the optical scattering in tissues, attempts have been made using a particle model with some success.17 18 19 Based on this model, biological tissue is treated as consisting of discrete scattering centers with different sizes randomly distributed in the background media. According to the Rayleigh-Gans approximation, the reduced scattering, μs ′, of turbid media is related to the reduced cross-section, σs ′, and the total number of scattering particles per unit of volume, i.e., number density, ρ: and where ui=2(2πain0/λ)sin(θ/2), mi=n si /n0 with n si and n0 being the refractive indices of the i’th scattering centers and background medium, φi the volume fraction of the i’th particles, and ai the radius of the i’th scatter. It can be seen that the reduced scattering coefficient of the scattering medium is dependent on both the refractive index ratio, mi, and the size of the scattering centers.It is known that the change in the refractive index is linear in concentrations of solvents when chemicals are dissolved. This is the principle of differential refractometry,20 a very common detection technique used in liquid chromatography, particularly with aqueous solutions. Both glycerol and DMSO have the higher refractive index of 1.47. Thus, when they diffuse into tissue fluid, they could cause an increase in the refractive index of the fluid (n0), leading to a decrease in mi. Therefore, the reduced scattering coefficient μs ′ decreases, leading to an increase in light penetration, as shown in the present experimental results. Based on the particle model, Schmitt and Kumar17 reported that the spectrum of index variation exhibits a power behavior for spatial frequencies from 0.5 to 5 μm−1. In other words, they found evidence for a broad distribution of scatterers in tissue cells with sizes ranging from 0.2 to 2 μm. Studies by Beauvoit et al.;21 and Mourant et al.;22 revealed that the size of scattering centers varies in radius from less than 0.2 to more than 1 μm. Thus the particles inside tissues with sizes on a microscopic scale are mainly responsible for the light scattering. Thus the sizes of scattering centers are at the subcellular level rather than at a cellular level because the tissue cell usually has a diameter of tens of micrometers. This implies that the subcellular components and structures—for example, cell nuclei and mitochondria—mainly contribute to the scattering properties of tissues. Thus for refractive index matching, the chemical agents should diffuse not only into the interstitial fluids of the tissue but also into the cells. In other words, to achieve refractive index matching, the chemicals should have a two-stage diffusion. The first stage is diffusion into the interstitial fluids, followed by diffusion into intracellular compartments which means that the chemicals must pass through the cell membrane before entering the cell matrix. After glycerol is applied to the surface of a tissue, it will reach the first diffusion stage. The glycerol would diffuse into the intercellular space of the stomach tissue relatively fast because the epithelial layers of the internal organs are composed of loosely packed cells, and glands and ducts with narrow lumens are rich in the mucosa of the gastrointestinal tract. However, it should be understood that this diffusion rate would be still slower than the migration of water out of the tissue because of the high osmolarity of the solution and the large molecular size of this agent. This causes the tissue dehydration observed in Figs. 2(a)–2(d). After glycerol is diffused into the tissue, it will not only draw intercellular fluids out of tissue but will also draw the interstitial water further from the cells and fibers. This would microscopically decrease the local volume fraction of the scattering centers, the subcellular structure within the cells, and therefore increase the back-reflective light signal. On the other hand, this diffusion increases the refractive index of the ground substances. Consequently, such dehydration would increase the local reflectance signals, leading to an increase in both imaging contrast and depth because OCT actually probes the refractive index difference between macroscopic structures at least in the current study. The concurrent enhancement of imaging depth and contrast is evident from Figs. 2(c) and 2(d). Glycerol has been found to enter and exit cells by passive diffusion.23 Therefore with the passage of time, glycerol will diffuse further into the cells, i.e., the second diffusion stage mentioned earlier. This causes a full refractive index matching with the subcellular structure. After glycerol enters the cells, it could draw water back into the cells as a result of its affinity for water, leading to tissue rehydration, as observed in Fig. 6(a) and Fig. 7. During this period, the volume of the scattering centers in cells could be enlarged by the rehydration, and an increase in the local reflectance signals would not occur. However, light scattering still remains small because of the refractive index-matching environment created between the chemical agents and the scattering centers within the tissue. This explains the OCT images of Figs. 2(e) and 2(f), where there is an improvement in the imaging depth, but the imaging contrast is gradually reduced. However, for DMSO, the first-stage diffusion is much faster because of the chemical’s strong penetration ability. Employing [35 S] DMSO, Kolb et al.;13 evaluated the absorption and distribution of DMSO in small animals and human. They reported13 that 10 min after cutaneous application in the rat, radioactivity was measured in the blood. In humans, radioactivity appeared in the blood 5 min after cutaneous application. One hour after application of DMSO to the skin, radioactivity could be detected in the bones. DMSO has also been found to be one of the most effective agents across cell membranes.15 24 These findings indicate that the second diffusion stage of DMSO also happens within a very short time. The fast diffusion rate of DMSO could decrease the osmolarity of the solution rapidly, even if the original one is high. Therefore the application of DMSO will cause less dehydration of the tissue than glycerol does. This is confirmed by the experimental results shown in Fig. 6(b) and Fig. 7. This also indicates that a slight decrease in volume in the scattering centers would occur and the back-reflective light signal would not increase once the agent has diffused into tissue. Consequently, no image contrast enhancement was observed with the OCT measurements, as shown in Fig. 3. In other words, DMSO causes a rapid full refractive index matching with the subcellular scattering centers of turbid tissue, leading to an improvement in imaging depth, but not in contrast. The experimental results of the tissue-clearing dynamics of glycerol and DMSO not only allow us to understand the mechanism of this process, but also provide information important in the selection of chemicals for different applications. The current results indicate that DMSO may be more suitable for applications where deep penetration of light energy and fast processes are desired—for example, photodynamic therapy—while glycerol may be more suitable for OCT imaging applications where both improved penetration depth and image contrast are required. 5.ConclusionWe have investigated the tissue-clearing effect of two osmotically active agents, glycerol and DMSO, using OCT. It was found that glycerol could enhance both OCT imaging depth and contrast during a specific period. It is assumed that these phenomena are caused by a two-stage diffusion of the chemicals. The first-stage diffusion is from the top tissue to the intercellular space, and the second is further diffusion into the cell matrix. During the first stage, the image contrast could be improved by localized dehydration together with the enhancement of imaging depth as a result of refractive index-matching with the environment created by tissue dehydration induced by the agent. After the first stage, the image contrast is gradually reduced while the improvement in light penetration is maintained as a result of the refractive index-matching created between the chemical agent and the scattering centers within the tissue. It was also found that DMSO has the ability to rapidly improve the penetration depth of light, but does not enhance image contrast. This is attributed to the fast diffusion characteristics of DMSO into tissue. AcknowledgmentsThis research was made possible with financial support from the Engineering and Physical Sciences Research Council, UK for under grants GR/N13715, GR/R06816, and GR/R52978. REFERENCES
H. Liu
,
B. Beauvoit
,
M. Kimura
, and
B. Chance
,
“Dependence of tissue optical properties on solute-induced changes in refractive index and osmolarity,”
J. Biomed. Opt. , 1
(2), 200
–211
(1996). Google Scholar
G. Yao
and
L. V. Wang
,
“Monte Carlo simulation of an optical coherence tomography signal in homogeneous turbid media,”
Phys. Med. Biol. , 44 2307
–2320
(1999). Google Scholar
R. K. Wang
,
“Signal degradation by multiple scattering in optical coherence tomography of dense tissue: a Monte Carlo study towards optical clearing of tissue,”
Phys. Med. Biol. , 47 2281
–2299
(2002). Google Scholar
V. V. Bakutkin
,
I. L. Maksimova
,
T. N. Semyonova
,
V. V. Tuchin
, and
I. L. Kon
,
“Controlling optical properties of sclera,”
Proc. SPIE , 2393 137
–141
(1995). Google Scholar
V. V. Tuchin
,
I. L. Maksimova
,
D. A. Zimnyakov
,
I. L. Kon
,
A. H. Mavlutov
, and
A. A. Mishin
,
“Light propagation in tissues with controlled optical properties,”
J. Biomed. Opt. , 2
(4), 401
–407
(1997). Google Scholar
R. K. Wang
,
X. Xu
,
V. V. Tuchin
, and
J. B. Elder
,
“Concurrent enhancement of imaging depth and contrast for optical coherence tomography by hyperosmotic agents,”
J. Opt. Soc. Am. B , 18
(7), 948
–953
(2001). Google Scholar
G. Vargas
,
F. K. Chan
,
J. K. Barton
,
H. K. Grady III
, and
A. J. Welch
,
“Use of an agent to reduce scattering in skin,”
Lasers Surg. Med. , 24 133
–141
(1999). Google Scholar
G. Vargas
,
F. K. Chan
,
S. L. Thomsen
, and
A. J. Welsh
,
“Use of osmotically active agents to alter optical properties of tissue: effects on the detected fluorescence signal measured through skin,”
Lasers Surg. Med. , 29 213
–220
(2001). Google Scholar
V. V. Tuchin
,
X. Xu
, and
R. K. Wang
,
“Dynamic optical coherence tomography in optical clearing, sedimentation and aggregation study of immersed blood,”
Appl. Opt. , 41 258
–271
(2002). Google Scholar
R. K. Wang
and
J. B. Elder
,
“Propylene glycol as a contrasting agent for optical coherence tomography to image gastro-intestinal tissues,”
Lasers Surg. Med. , 30 201
–208
(2002). Google Scholar
K. H. Kolb
,
G. Janicke
,
M. Kramer
,
P. E. Schulze
, and
G. Raspe
,
“Absorption, distribution and elimination of labeled dimethyl sulfoxide in man and animals,”
Ann. N.Y. Acad. Sci. , 141 85
–95
(1967). Google Scholar
M. S. Frank
,
M. C. Nahata
, and
M. D. Hilty
,
“Glycerol: a review of its pharmacology, pharmacokinetics, adverse reactions, and clinical use,”
Pharmacotherapy , 1
(2), 147
–160
(1981). Google Scholar
J. M. Schmitt
and
G. Kumar
,
“Turbulent nature of refractive-index variations in biological tissue,”
Opt. Lett. , 21
(16), 1310
(1996). Google Scholar
J. M. Schmitt
and
G. Kumar
,
“Optical scattering properties of soft tissue: a discrete particle model,”
Appl. Opt. , 37
(13), 2788
(1998). Google Scholar
B. Gelebart
,
E. Tinet
,
J. M. Tualle
, and
S. Avrillier
,
“Phase function simulation in tissue phantoms: a fractal approach,”
Pure Appl. Opt. , 5
(4), 377
–388
(1996). Google Scholar
R. K. Wang
,
“Modeling optical properties of soft tissue by fractal distribution of scatters,”
J. Mod. Opt. , 47 103
(2000). Google Scholar
E. P. Pittz
,
J. C. Lee
,
B. Bablouzian
,
R. Townend
, and
S. N. Timasheff
,
“Light scattering and differential refractometry,”
Methods Enzymol. , 27 209
–256
(1973). Google Scholar
B. Beauvoit
,
T. Kitai
, and
B. Chance
,
“Contribution of the mitochondrial compartment to the optical properties of rat liver: a theoretical and practical approach,”
Biophys. J. , 67 2501
–2510
(1994). Google Scholar
J. R. Mourant
,
J. P. Freyer
,
A. H. Hielscher
,
A. A. Eick
,
D. Shen
, and
T. M. Johnson
,
“Mechanisms of light scattering from biological cells relevant to noninvasive optical-tissue diagnostics,”
Appl. Opt. , 37
(16), 3586
(1998). Google Scholar
J. Frim
and
P. Mazur
,
“Interactions of cooling rate, warming rate, glycerol concentration and dilution procedure on the viability of frozen-thawed human granulocytes,”
Cryobiology , 20 657
–676
(1983). Google Scholar
A. Walter
and
J. Gutknecht
,
“Permeability of small nonelectrolytes through lipid bilayer membranes,”
J. Membr. Biol. , 90 207
–217
(1986). Google Scholar
|


CITATIONS
Cited by 101 scholarly publications and 1 patent.
Tissues
Optical coherence tomography
Tissue optics
Scattering
Diffusion
Light scattering
Refractive index


