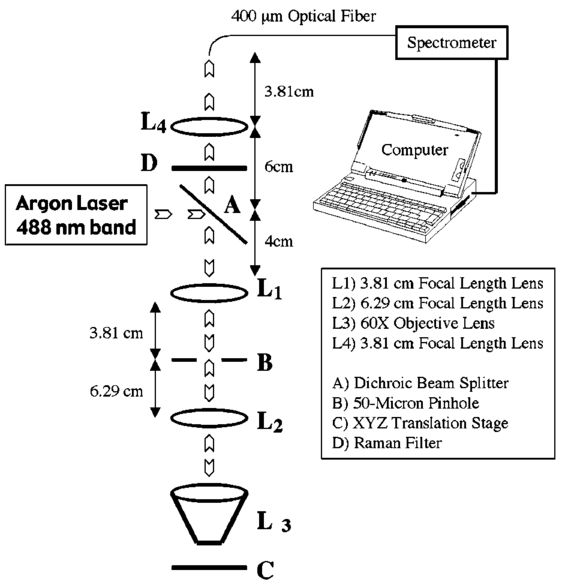
1.IntroductionThe expression of a biomarker such as green fluorescent protein (GFP) offers a means to monitor the kinetics of cell phenotype expression in animal models. We are assessing two systems for optical monitoring of GFP expression in cartilage to track expression of the chondrocyte phenotype during bone growth plate development. The bone growth plate is a dynamic structure in which a cartilage template is synthesized at the leading edge, degraded, and replaced by bone at the trailing edge called the ossification front. The process is orchestrated by chondrocytes that live out a differentiation program in the growth plate. In the system we have been using, the GFP gene sequence is linked to the sequence for type-2 collagen, which is a marker for the chondrocyte phenotype. As fibroblasts convert to chondrocytes, the GFP is expressed along with type-2 collagen and the cells become fluorescent.1 Such expression is currently assessed by confocal fluorescence microscopy in biologically frozen sections of excised tissue providing an image at a single time. An optical technique that could noninvasively image GFP expression in vivo would allow tracking of the dynamics of the chondrocyte population and possibly tracking of individual chondrocyte expression. This paper presents a demonstration of the relative abilities of topical optical fiber detection versus confocal detection of GFP expression in subdermal cartilage. The confocal technique spatially limits light detection to a confocal volume within the tissue being studied by placing a pinhole in front of the detector.2 Light emitted or scattered from the confocal volume is focused through the pinhole before reaching the detector. Light emitted or scattered from outside the confocal volume fails to focus through the pinhole and does not reach the detector. Confocal microscopy enables imaging of optically thin sections within optically thick (i.e., turbid) samples,3 and can be implemented both as fluorescence imaging and reflectance imaging. Imaging beneath the surface of the skin is an active research area.4 5 6 7 8 Local changes in refractive index, melanin, and fluorescence have been used as sources of contrast. Research efforts have focused on reflectance imaging of keratinocytes within the epidermal and dermal layers in humans, but relatively little work has been attempted to image subcutaneous fluorescence through the full thickness of mouse skin. In this work the young mouse skin was about 260 μm thick when uncompressed as measured with a micrometer, which is about three transport mean-free paths [mfp=1/(μa+μs(1−g)] where μa is the absorption coefficient, μs is the scattering coefficient, and g is the anisotropy of scattering) according to previous studies documenting the optical properties of mouse skin of various age. Noninvasive imaging of GFP expression in subdermal cells is an attractive goal, but weak target fluorescence, optical attenuation, and collagen autofluorescence limit detectability, where detectability has been defined by Gan and Sheppard 1993.9 Many methods for increasing contrast and clarity in images of GFP fluorophores surrounded by autoflourescent tissue have been investigated.10 Biological fluorophores such as collagen (in skin) and lipofuscin11 (in brain tissue) have emission spectra that overlap that of GFP and can thwart imaging with artifacts and poor contrast. It is possible to use methods such as narrow band filtering12 and fluorescence lifetime discrimination13 to separate GFP fluorescence from unwanted autofluorescence. Two green fluorescent targets with similar fluorescent yield were used in this work, a polystyrene microsphere and tissue containing GFP. The green fluorescence in the sphere containing “fluorescein-like” dye is comparable to that of a GFP containing cell in quantum efficiency and the product of extinction coefficient and concentration. The benefit of using a confocal fluorimeter for measuring subdermal fluorescence is that it minimizes collagen autofluorescence and maximizes subdermal green fluorescence. This spatial filtration is intrinsic to the confocal design. By adding a pinhole gate in the sample’s conjugate plane, the focal volume of the sample is confined and detection of the target fluorescence is optimized. While this confocal technique is successful in removing detected fluorescent emission from surrounding regions, some autofluorescence is detected which partially corrupts the subdermal target fluorescence signal. The purpose of this work is to spectrally quantify and compare the green signal and autofluorescent noise. 2.Materials and Methods2.1.Animal ModelExperiments used transgenic mice (Rosa 26) which harbored a Col2-GFP reporter that marks chondrocytes by enhanced green fluorescent protein (EGFP) expression linked to type-2 collagen expression in the cartilage.1 Mice were approximately one week in age. In the experiments labeled as in vivo, the optical fiber probe measurements were made on the ear of one mouse in vivo. The confocal microscope measurements were made on the abdomen (subdermal cartilage in the xyphoid process) of a second mouse freshly euthanized. The two fluorimeters were not assembled at the same time so the same animal could not be used. Although the measurement sites were anatomically different, they do illustrate the confocal principal and are suitable for spectral analysis. In the experiment labeled as ex vivo, abdominal skin samples were excised from a third mouse that was not transgenic and did not express EGFP. EGFP contains mutations14 from GFP that shift its excitation peak from 475 to 490 nm which is appropriate for excitation using the 488 nm light of the argon laser. The emission peak is roughly at 509 nm depending on the chemical environment. The autofluorescence of collagen in human skin has been studied extensively in the ultraviolet range.15 Collagen autofluorescence peaks at about 550 nm when excited in the 470–490 nm range. The autofluorescence spectrum for mouse skin is nearly identical to that of human skin.15 2.2.Confocal SystemThe confocal laser fluorimeter (Fig. 1) used an argon ion laser (Melles Griot 35-LAL-415-220R, 488 nm wavelength, adjusted to provide 1 mW to the sample) to excite fluorescence that was measured with a spectrometer (Ocean Optics Inc., set to 100 ms acquisition time). Excitation and emission light were separated using a dichroic beam splitter (Custom Scientific 500 UHP DCLP) and a Raman rejection filter (Omega Optical XR3000, OD 5). The dichroic beam splitter allowed excitation light to be injected into the optical path of the system and fluorescent emission light to pass to the detector. For detecting EGFP beneath collagen, a bandpass filter centered at approximately 510 nm for EGFP emission (≈500–530 nm) would best discriminate against collagen autofluorescence, which peaks at longer wavelengths.15 In this work a long-pass filter at 500 nm was chosen based on its transmission of the EGFP fluorescence and collagen autofluorescence in the 500– 700 nm range. A Raman rejection filter (Omega Optical XR3000, OD 5) further blocked excitation light from reaching the detector. A 50 μm diameter collection pinhole and 60×, 0.85 numerical aperature (NA) objective lens achieved confocally matched gating. The lateral resolution element, defined as 0.46λ/NA,16 was 0.26 μm which mapped to about 50 μm in the pinhole plane. The returning fluorescence emission was focused into an optical fiber that carried light to the spectrometer. 2.3.Optical Fiber ProbeAn optical fiber probe fluorimeter was used to collect multiply scattered fluorescent emission measured from a transgenic mouse. The fiber probe fluorimeter consisted of a single 600 μm core diameter optical fiber (0.39 NA) that delivered excitation and collected fluorescent emission while in contact with the skin. The single fiber of the probe was coupled by an SMA connector to an optical fiber bundle probe in which the central fiber (300 μm core diameter) injected excitation light into the single fiber probe and the surrounding ring of 12 collection fibers (100 μm core diameter) collected returning fluorescent emission from the single fiber probe. The system used a pulsed nitrogen dye laser to excite fluorescence at 460 nm. Twenty pulses of 30 μJ were used for each measurement. An optical multichannel analyzer (OMA) (Princeton Instruments Inc.) detected and accumulated counts for the 20 fluorescence spectra measured. A high-pass absorption filter blocked the 460 nm excitation light from entering the OMA. The probe was held in contact with the skin during measurements. 2.4.Whole Animal ExperimentThe optical fiber probe fluorimeter was used to collect multiply scattered fluorescent emission from subdermal EGFP-expressing chondrocytes measured on a transgenic mouse. The probe was held in contact with the skin of a mouse pup at the base of the ear. The system was brought into the animal facilities allowing measurements to be conducted on the live mouse. In a second mouse, the confocal fluorimeter was positioned over EGFP-expressing chondrocytes in the subdermal xyphoid process (breast bone) of the intact freshly euthanized animal. The specimen holder was a plastic 1 mm slide with a 2 cm square window. Over the window was glued a 100 μm glass cover slip and against the cover slip rested the mouse chest where the xyphoid process pressed the skin to the glass. The whole animal was then translated toward the objective lens until the focus lay within the cartilage of the xyphoid process. The animal’s position was adjusted by micrometer control of the xyz translation stage to maximize the spectral reading of EGFP. Because the confocal system could not be brought to the animal facilities, the mouse was euthanized less than 1 h before measurement. 2.5.Excised Tissue ExperimentSkin samples were obtained from a euthanized third mouse that was not transgenic and did not express EGFP. The tissue preparation consisted of a 100 μm glass cover slip, a 100 μm layer of mouse skin, and a 1 mm glass microscope slide. The skin layer was prepared by frozen section and included the stratum corneum surface. The tissue was kept hydrated during the preparation process by submersion in phosphate buffered saline. The tissue was therefore different from the in vivo skin because it did not have as much blood content. The absorption was therefore less but the difference was assumed negligible for optical transport because scattering dominates over absorption in skin.17 A 6 μm diameter green fluorescent microsphere (Molecular Probes A-7313), whose fluorescent yield is comparable to a cell expressing EGFP, was placed on the glass slide beneath the murine skin layer. The focus of the confocal fluorimeter was aligned with the microsphere by micrometer adjustment of the xyz translation stage holding the preparation. The fluorescence spectrum was recorded. The pinhole was then removed from the system to illustrate a wide-field measurement and the spectrum recorded. Separate measurements of the fluorescence of the microsphere and of the autofluorescence of the skin were also recorded, which served as reference spectra for subsequent analysis. 2.6.Data AnalysisThe acquired fluorescence spectra were normalized by the transmission spectra of the dichroic beam splitter and Raman filter. The resulting spectra were then fit using a least squares algorithm that modeled the total fluorescence spectrum FT(λ) as a weighted sum of the reference spectra FC(λ) for collagen and FF(λ) for the target fluorophore, either EGFP or fluorescent microsphere, in units of counts: where CC and CF were the fitting parameters and λ denotes wavelength. For the in vivo measurement using the confocal system, the FC(λ) was obtained from direct measurement of the skin of the third nontransgenic mouse. For the in vivo measurement using the optical fiber and OMA system, the FC(λ) was approximated by a Gaussian that accounted for both the collagen autofluorescence and the effect of the tissue optics that influences the penetration of excitation, the escape of emission and the collection efficiency of the fiber.18 The FF(λ) for EGFP was obtained from Clontech Inc., Palo Alto, CA. The FF(λ) for the microsphere was obtained by direct measurement of an isolated microsphere. The total magnitude of fluorescence for each fluorophore was determined by integrating the curves that composed the best fits to the experimental data. The total counts detected for each fluorophore in each experiment was calculated by summing the counts over all wavelengths for the weighted spectra of the particular fluorophore. For instance, the magnitude of the collagen fluorescence [ MC (counts)] was calculated: The contrast for target detection was calculated by dividing the magnitude of fluorescence of the target fluorophore (MF) by the sum of the target and collagen magnitudes3.ResultsThe whole animal experiment used the optical fiber probe to measure the ear of a live mouse, and used the confocal system to measure the abdomen of an intact freshly euthanized mouse. Figure 2 shows the results. The curves shown are the fitted curve for collagen (denoted by A), the fitted curve for EGFP (denoted by B), the combination (denoted by C), and the actual data (denoted by D). The confocal system showed only a slight amount of background collagen fluorescence (A) and a strong signal from the EGFP (B). The fiber probe showed a large background of collagen autofluorescence (A) with a small amount of EGFP fluorescence (B). Figure 2Whole animal experiment. Fluorescence spectra from Rosa 26 mice shows collagen fluorescence and EGFP fluorescence. The locations of measurements were the (left) xyphoid process and (right) ear for the confocal and fiber probe, respectively.  The excised tissue experiment used the confocal system to measure a fluorescent microsphere beneath a layer of skin from the nontransgenic mouse. Figure 3 shows the results, and the labeling is the same as in Fig. 2. With the pinhole in place, the system yielded a confocal measurement in which the peak microsphere fluorescence (peak of curve B) was greater than the peak collagen fluorescence (A). With the pinhole removed, the system yielded a wide-field measurement in which the peak microsphere fluorescence (B) was less than the peak collagen fluorescence (A). Figure 3Excised tissue experiment. The fluorescence spectrum from a fluorescent microsphere beneath a 100 μm layer of mouse skin is shown for measurements (left) with a pinhole and (right) without a pinhole.  Table 1 summarizes the results for all the experiments. In the in vivo measurements of EGFP, the contrast for green fluorescence was 0.92 versus 0.16 using the confocal system and the optical fiber probe, respectively. In the ex vivo measurements of microsphere fluorescence, the contrast for green fluorescence was 0.48 versus 0.13 using the confocal system (with pinhole) and the wide-field system (no pinhole), respectively. Table 1
4.DiscussionThe experiments illustrate the ability of a confocal measurement to optimize the selective measurement of a subdermal fluorophore while rejecting the collagen autofluorescence in the overlying skin. This general method would be useful in a number of different applications such as determining localized microscopic variations in photosensitizing drug content for photodynamic therapy or variations in collagen autofluorescence in skin. Although the fluorescence efficiency of collagen is not very high relative to that of the green fluorophores in these experiments, the skin presents a large volume such that the optical fiber probe collects a large amount of collagen autofluorescence. As illustrated in Fig. 4, the voxel of collection or sampling volume for the fiber probe is the portion of the diffuse glow-ball of fluorescent emission which escapes within the cone of collection18 of the fiber. The confocal system limits the collection of fluorescence from the whole skin volume to the subdermal confocal volume which is on the order of a cubic micron,19 and consequently the fluorescence of the subdermal green fluorophores can dominate over the collagen autofluorescence. Figure 4Sampling volume. The fiber probe collects fluorescence escaping within the cone of acceptance (shown convolved across the fiber face) defined by the fiber’s numerical aperture (0.39). The confocal fluorimeter collects fluorescence from the confocal volume, which is on the order of a cubic micron located at the focus of the objective lens described in the radial direction by the focal waist W0 and in the axial direction by Z0 the distance at which the radial beam has expanded to ⊡2W0 . Scattered photons are filtered out by the confocal design but accepted by the fiber probe device. Figure not drawn to scale. 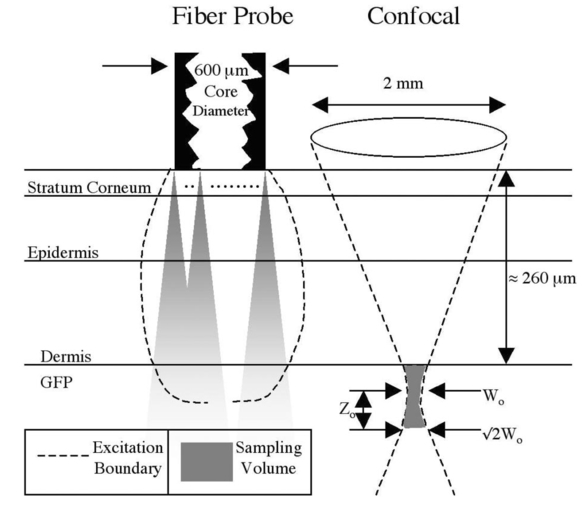 The results also illustrate the advantage of spectral discrimination of collected fluorescence. A confocal microscope with a single filter and detector will acquire a signal comprised of both collagen autofluorescence and any subdermal green fluorescence. The confocal detection optimizes the fluorescence from the confocal volume, but there is still some contribution from the collagen of the overlying skin. Spectral detection can separate these two contributions to the total signal. The experiment of this report would be useful in determining the proper filters for spectral discrimination of the target fluorescence whether it be GFP or any other fluorophore, especially in confocal microscopy where autofluorescence can compromise imaging capability. The spectra shown in this report are observed fluorescence, corrected for the filters but not for the detection systems nor for the effects of tissue optics. The goal of this report was to emphasize how the measurement system affected the relative strengths of subdermal green fluorescence and overlying collagen autofluorescence. If one wishes to quantify the amount of green fluorophore in units of concentration, one must consider how the tissue optics and the geometry of the measurement system combine to affect the penetration of excitation, the return to the tissue surface of fluorescent emission, and the collection of detectable emission as photons escape the tissue and enter the measurement system. For example with the optical fiber probe, only about 10 of the photons that escape the tissue and enter the fiber are collected within the solid angle of collection that allows the fiber to guide the photons to the detector. About 90 (varies with optical properties of tissue and numerical aperture of fiber) of the photons that enter the fiber immediately escape the fiber and are not detected.18 Although this paper does not discuss these corrections, we have concluded that the confocal technique was successful at improving the signal to noise ratio when measurement of a subdermal target fluorescence was contaminated with collagen autofluorescence. REFERENCES
J. Y. Cho
,
T. D. Grant
,
G. P. Lunstrum
, and
W. A. Horton
,
“Col2-GFP reporter mouse—a new tool to study skeletal development,”
Am. J. Med. Genet. , 106
(4), 251
–253
(2001). Google Scholar
M. Minsky
,
“Memoir on inventing the confocal scanning microscope,”
Scanning , 10 128
–138
(1988). Google Scholar
J. M. Schmitt
,
A. Knuttel
, and
M. Yadowsky
,
“Confocal microscopy in turbid media,”
J. Opt. Soc. Am. A , 11 2226
–2235
(1994). Google Scholar
M. Rajadhyaksha
,
M. Grossman
,
D. Esterowitz
,
R. H. Webb
, and
R. R. Anderson
,
“Video-rate confocal scanning laser microscopy for human skin: melanin provides strong contrast,”
J. Invest. Dermatol. , 104 946
–952
(1995). Google Scholar
M. Rajadhyaksha
,
S. Gonzalez
,
J. M. Zavislan
,
R. R. Anderson
, and
R. H. Webb
,
“In vivo confocal scanning laser microscopy of human skin II: advances in instrumentation and comparison with histology,”
J. Invest. Dermatol. , 113 293
–303
(1999). Google Scholar
C. Bertrand
and
P. Corcuff
,
“In vivo spatio-temporal visualization of the human skin by real time confocal microscopy,”
Scanning , 16 150
–154
(1994). Google Scholar
P. Corcuff
,
C. Bertrand
, and
J. L. Leveque
,
“Morphotometry of human epidermis in vivo by real-time confocal microscopy,”
Arch. Dermatol. Res. , 285 475
–481
(1993). Google Scholar
P. Corcuff
,
G. Gonnord
,
G. E. Pierard
, and
J. L. Leveque
,
“In vivo confocal microscopy of human skin: a new design for cosmetology and dermatology,”
Scanning , 18 351
–355
(1996). Google Scholar
X. S. Gan
and
C. J. R. Sheppard
,
“Detectability: a new criterion for evaluation of the confocal microscope,”
Scanning , 15 187
–192
(1993). Google Scholar
N. Billinton
and
A. W. Knight
,
“Seeing the wood through the trees: a review of techniques for distinguishing green fluorescent protein from endogenous autofluorescence,”
Anal. Biochem. , 291 175
–197
(2001). Google Scholar
K. P. Doyle
,
R. P. Simon
,
A. Snyder
, and
M. P. Stenzel-Poore
,
“Working with GFP in the Brain,”
Biotechniques , 34
(4), 492
–494
(2003). Google Scholar
C. Coralli
,
M. Cemazar
,
C. Kanthou
,
G. M. Tozer
, and
G. U. Dachs
,
“Limitations of the Reporter Green Fluorescent Protein under Simulated Tumor Conditions,”
Cancer Res. , 61 4784
–4790
(2001). Google Scholar
D. Elson
,
S. Webb
,
J. Siegel
,
K. Suhling
,
D. Davis
,
J. Lever
,
D. Phillips
, and
A. Wallace
,
“Biomedical applications of fluorescence Lifetime Imaging,”
Opt. Photonics News , 13 27
–32
(2002). Google Scholar
A. K. Hadjantonakis
and
A. Nagy
,
“The color of mice: in the light of GFP variant reporters,”
Histochem. Cell Biol. , 115 49
–58
(2001). Google Scholar
R. Na
,
I. M. Stender
,
M. Henriksen
, and
H. C. Wulf
,
“Autofluorescence of human skin is age related after correction for skin pigmentatin and redness,”
J. Invest. Dermatol. , 116 536
–540
(2001). Google Scholar
H. Zeng
,
C. MacAulay
,
D. I. McLean
, and
B. Palcic
,
“Spectrascopic and microscopic characteristics of human skin autofluorescence emission,”
Photochem. Photobiol. , 61 639
–645
(1995). Google Scholar
S. L. Jacques
,
C. A. Alter
, and
S. A. Prahl
,
“Angular dependance of He-Ne laser light scattered by human dermis,”
Lasers Life Sci. , 1 309
–333
(1987). Google Scholar
|
||||||||||||||||||||||||


CITATIONS
Cited by 29 scholarly publications.
Confocal microscopy
Luminescence
Collagen
Skin
Green fluorescent protein
Tissue optics
Optical fibers


