1.IntroductionRecently, great progress has been achieved in noninvasive in vivo imaging of human skin. Various optical methods have been developed to section living tissue with high resolution and contrast. This enables a noninvasive diagnostic “biopsy” of skin and also serves as a powerful tool for basic research in dermatology. In vivo imaging of the upper skin layers was demonstrated for the first time about 10 years ago with white light tandem scanning confocal microscopy.1 2 3 In 1995 Rajadhyaksha et al.;4 developed a laser-based scanning confocal microscope, a technique that is nowadays commonly used for confocal microscopy of skin.5 6 7 8 9 The cellular structure in the epidermis and fibrous tissue of superficial dermis can be visualized and good similarity of the confocal images with histology has been reported.7 8 Human skin is a nontransparent medium, due to absorption and scattering. Absorption depends on the concentration of melanin and hemoglobin scattering on differences in refractive index. The optical sectioning capability of confocal microscopy is based on detection of singly scattered photons. Due to multiple scattering especially from deeper layers the signal-to-noise ratio diminishes with the depth and the technique is therefore restricted to the upper layers of the skin. Optical coherence tomography (OCT) is a technique that more effectively reduces the effects of multiple scattering and therefore enables imaging of skin layers as deep as 1–2 mm. OCT is based on the principle of Michelson interferometry and was introduced by Fercher et al.;10 and Huang et al.;11 to investigate transparent tissue of the human eye. Later on, several research groups developed OCT to image highly scattering and absorbing tissue, such as human skin, by using longer wavelength in the near infrared where scattering is rather low.12 13 14 15 16 17 18 19 20 For reviews we refer the reader to work by Schmitt,21 Fujimoto et al.;,22 Welzel,23 and the book edited by Bouma and Tearney that deals with theory and applications of OCT.24 Confocal laser scanning microscopy (CLSM) and OCT give complementary information on the composition and structure of skin, mainly due to their differences in spatial resolution and penetration depth. In contrast to CLSM, the resolution in our OCT system is not high enough to visualize individual cells. OCT instead reveals images of optical structural inhomogeneities in tissue. The penetration depth and field of view of OCT, however, is much larger compared to CLSM. OCT provides cross-sectional images, whereas CLSM measures images parallel to the skin surface. Optical coherence microscopy (OCM) is a novel technique that combines low-coherence interferometry with confocal microscopy to achieve optical imaging deep in highly scattering media with micrometer resolution in both transversal and axial directions.14 25 The advantages, however, come at the cost of increased overall complexity of the imaging system. An extensive overview on OCM can be found in the Handbook of Optical Coherence Tomography,24 Chapter 10, by Wang et al.; In some cases, due to the lower resolution, interpretation of the OCT signals is not straightforward and the results appear to not always be consistent with those obtained with confocal laser scanning microscopy and histology.23 26 On the other hand, the choice of marker of the various skin layers in the analysis of confocal laser scanning microscopy images strongly influences the results of the different skin parameters. In this paper detailed in vivo characterization of the various human skin layers of the epidermis and upper dermis has been performed for two groups of volunteers that differ in age (a younger and an older group). In the past, age-related changes in skin have extensively been studied by histological sectioning;27 28 29 30 31 32 data obtained with in vivo imaging are, however, rare.33 We have studied age-related changes in human skin in vivo by applying the two imaging techniques, confocal laser scanning microscopy and optical coherence tomography. A direct comparison of the results obtained by the two methods allows a better, more consistent interpretation of the images. 2.Materials and Methods2.1.VolunteersIn order to investigate age-related changes in healthy human skin in vivo, we have studied two groups of 15 volunteers each with Caucasian skin type. One group comprised volunteers age 19 up to 24 years, referred to as the younger group (mean age: 22.5 years; 8 female, 7 male), and the other group age 54 up to 57 years, referred to as the older group (mean age: 55.3 years; 5 female, 10 male). Measurements were performed on the volar aspect of the forearm and on the temple. At both sites three measurements at slightly different positions were performed with OCT as well as with CLSM. All volunteers gave informed consent. Measurements were carried out in climate controlled test rooms at 22 °C, 50 relative humidity. 2.2.Optical Coherence TomographyOCT is an interferometric technique that uses a low-coherence light source. The principle of OCT is extensively described elsewhere.11 21 Our specially designed OCT system is a fiber-optic based interferometer.26 A broadband semiconductor amplifier source (BBS 1310, AFC Technologies) is used to provide low-coherence light at a center wavelength of 1310 nm with spectral width of 50 nm. The axial resolution of the system is 14 μm and the penetration depth into the skin is about 1 mm. The OCT system acquires slices perpendicular to the skin surface of 2×2 mm2 (lateral×axial direction). One measurement consists of 10 slices at 0.25 mm lateral intervals. 2.3.Confocal Laser Scanning MicroscopyConfocal laser scanning reflectance microscopy was performed with a modified Vivascope 1000 (Lucid Inc.), using a laser diode with a wavelength of 834 nm. The Vivascope 1000 was equipped with a piezo mechanical positioner (Physik Instrumente E-500) on the objective assembly. Together with proprietary software for control and data acquisition, automated accurate axial stepping is possible. Images are taken en face parallel to the skin surface. In this study, a region of interest of 0.55×0.41 mm2 was scanned at various depths up to 200 μm, with the step size for axial scanning 2 μm. The three-dimensional scans are saved on a disk for further analysis. During an axial scan the laser power applied at each depth is adjusted for optimal brightness. Before scanning the laser power was adjusted at each 25 μm depth interval; i.e., near the surface we used 4 of the maximum laser power, while for imaging the deepest layers maximum laser power of 15 mW was applied. A 40×, 0.8 numerical aperture (NA) water immersion microscope objective (Leica) was used. To achieve good optical contact between the skin and the optical system we applied water to the skin. The resolution of the microscope is 1 μm in the lateral direction and 5 μm in axial. One measurement (100 steps of 2 μm) took approximately 20 s. 2.4.Data Analysis: OCTA typical two-dimensional, cross-sectional OCT image of the forearm and of the temple shows two bright bands (see, for example, images of the forearm in Fig. 1). The first bright band is due to scattering of light at the skin surface, and the second band is located deeper below the skin surface. For analysis, in each image the surface was flattened such that the maximum intensity, caused by reflection at the skin surface, was located at a fixed depth. For all 10 images of a single measurement an average intensity profile was determined. Figure 1 shows images (flattened surfaces) of the forearm together with their corresponding intensity profiles. The intensity profile was calculated by integration of the signal along the lateral position x as a function of the depth in each image. An intensity profile of the forearm or of the temple shows two peaks caused by the two bright reflecting bands. The skin surface was defined at the depth at which the intensity of the first peak reached half its maximum. This depth was set to 0 μm. The location of the second layer at Doct is determined relative to the skin surface by calculating the position at which the second band has climbed half its maximum intensity on the ascending slope. For all volunteers the average location of Doct was calculated from the three individual measurements per site. The results were used to determine the average value of Doct and standard deviation per group and site. The measured optical depth d′(OCT) was corrected for the refractive index to obtain the real physical depth d(OCT), where n is the average refractive index of the tissue. We assumed a constant refractive index for all skin layers of n=1.4. 34Figure 1OCT images and intensity profiles: (a), (b) Cross-sectional OCT images and (c) corresponding average intensity profiles measured on the volar forearm of a 23 year old volunteer, (a) and solid line intensity profile in (c) and of a 57 year old volunteer, (b) and dashed line in (c). The surfaces in the images were flattened. The positions of the surface reflection and of the second reflecting layer in the dermis are indicated roughly in the images. The profiles and images show that the value of Doct is relatively small for the older volunteer.  2.5.Data Analysis: CLSMThe thickness and location of different skin layers in the epidermis and upper part of the dermis can be derived from the CLSM measurements. Boundaries of different skin layers were determined from visual inspection of structural information in the images in combination with analysis of the average reflected intensity profile. The three-dimensional (3-D) stacks of bitmap images were visualized with the software package Alice (version 3.0, Perspective Systems Inc.). A profile of the reflected intensity can be derived from the stack of images: at each depth the intensity reflected in the whole image is averaged, divided by the laser intensity applied and plotted as a function of the depth. An example of a typical profile on a logarithmic scale (together with images corresponding to certain boundaries, see below) is shown in Fig. 2. At the glass–skin interface we determined the location of the skin surface from the depth at which the reflected intensity reaches half its maximum on the linear scale (1/2 I max ); this depth is set to 0 μm. The thickness and locations of various skin layers are determined relative to this plane. The measured depth d′(CLSM) was corrected for refractive index mismatch to obtain the real physical depth d(CLSM), where n is the average refractive index of the tissue (n=1.4) and n0 is the refractive index of the immersion medium, in our case water (n0=1.33). Taking into account variation of the refractive index for different skin layers determined by Knu¨ttel and Boehlau-Godau35 appeared to be of minor influence on the thickness values of the skin layers so we therefore applied the average refractive index. The following skin layer parameters were determined (for a schematic overview of the skin parameters, we refer the reader to Fig. 4):Figure 2Skin layer parameter determination by CLSM: CLSM profile of integrated reflected intensity in the lateral image as a function of the depth, measured on the forearm (age of volunteer: 24 years). The profile is plotted on a logarithmic scale and corrected for refractive index mismatch. The vertical lines indicate the following markers: determined on the linear scale, set to 0 μm; SC; E min; depth at the onset of the first change in slope at E max and the second change in slope around UD, with UD min and UD max. The corresponding images, shown at the top, were recorded parallel to the skin surface at different depths: (a) lower boundary of SC, (b) E min epidermal cellular structure only, (c) E max no cells, dermis only, (d) UD layer of collagen fibers in upper dermis. The layer is also very visible in the cross-sectional (x–z) view. 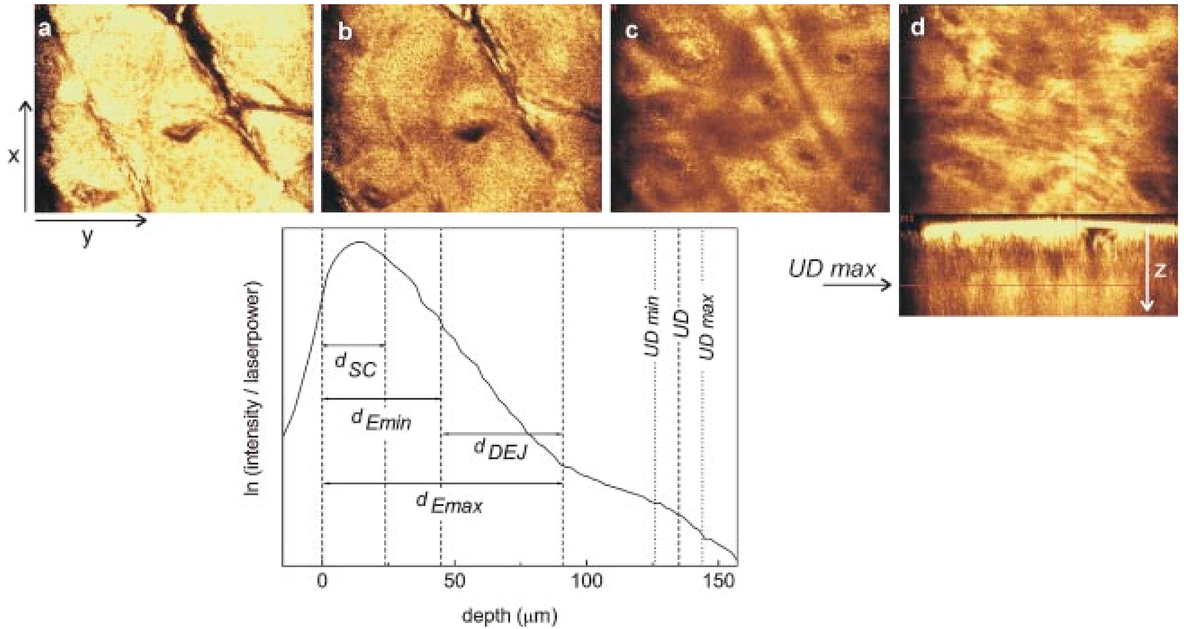 2.5.1.Stratum corneumThe thickness of the stratum corneum d sc is determined as the depth at which a regular structure of cells is first visible [Fig. 2(a)]. 2.5.2.Epidermis (E min and E max)(i) The minimum thickness of the epidermis dE min is determined by the top of the uppermost papillae (at E min) . If no papillae were visible in the image, E min would be defined as the maximum depth at which only the cellular structure of the epidermis contributes to the signal, i.e., no contribution by the dermis [Fig. 2(b)]. (ii) The maximum thickness of the epidermis dE max is defined by the valleys of the papillae. The different optical properties of the cellular structure in the epidermis and fibrous structure in the dermis cause a change in slope in the reflected intensity profile. The onset of this change in slope (at E max) corresponds to the depth at which for the first time no cellular structure is observed any longer in the stack of images upon going from the surface to deeper positions. The signal in the image is determined by the dermis only [Fig. 2(c)]. 2.5.3.Dermo-epidermal junctionThe determination of dE min and dE max allows one to calculate the thickness of the dermo-epidermal junction (DEJ) d DEJ =dE max −dE min . 2.5.4.Upper dermisAt a certain depth a reflecting layer of fibrous structure in the upper dermis is observed in the stack of three-dimensional CLSM images [Fig. 2(d)]. The location UD of this layer is defined as ( UD min+ UD max)/2, where UD min is the location of the onset of this layer and UD max the location of its maximum intensity. The boundary can also be derived from the intensity profile, and it appears as a second change in slope around UD (Fig. 2, intensity profile). The above-listed skin parameters (d SC , dE min , dE max , d DEJ , and UD ) were determined for the forearms and temples of all volunteers (three measurements per site). 2.6.StatisticsFor all skin parameters the results of the three individual measurements per volunteer and per site were averaged. From these results the mean values and standard deviation per group and site were calculated. To compare parameters between the younger and older groups (per site) an independent sample t test was used that had a significance level of p=0.05. Statistical analysis was performed with the Statistical Package for Social Sciences (SPSS). 3.ResultsIn Fig. 1 two typical OCT images (flattened surfaces) together with the corresponding intensity profiles measured of the forearm of two volunteers are presented. The image on the left and solid line profile represent measurement on a 23 year old volunteer; the image on the right and the dashed line intensity profile that on a 57 year old volunteer. In the images two bright reflecting layers are visible. The first bright band is due to reflectance from the stratum corneum. Just below this layer, in the viable epidermis, the signal intensity diminishes. As will be discussed below, the second reflecting layer, deeper in the skin, can be ascribed to backscattering of light at the fibrous structure of collagen in the dermis. In the younger volunteer this reflecting layer is located much deeper below the surface than in the older volunteer. The images and corresponding profiles clearly show smaller values of Doct for older skin. A summary of all measurements of Doct is given in Table 1. The mean values and standard deviations of the 15 volunteers of the younger and older group and the corresponding p values are presented for the forearm and the temple. The differences in the location of the second bright reflecting layer at Doct between the younger and older group are statistically significant at both sites. Table 1
Table 1 summarizes also the outcome of the skin parameters determined by CLSM. At both sites, forearm and temple, the CLSM parameters show a similar trend. The thickness of the stratum corneum d SC and minimum thickness of the epidermis dE min , up to the top of the papillae change slightly, but not significantly, with age. The other parameters (dE max , d DEJ , and UD ), however, show a considerable decrease with age at both sites. On the forearm, the average maximum thickness of the epidermis dE max in the younger group is significantly larger than in the older group. Although the epidermal layer up to the top of the papillae (dE min ) becomes somewhat thicker, the overall thickness of the whole epidermis decreases significantly by 15 μm with increasing age. At the temple, the decrease in dE max is smaller and just meets the significance requirement. The decrease of dE max together with a (slight) increase of dE min results in a significantly flatter interface between the epidermis and dermis in aged skin. Besides the decrease in thickness of the dermo-epidermal junction, the number of papillae decreases as well, especially at the temple. In images at the temple of 10 of the 15 elderly volunteers papillae were not visible at all, whereas for all volunteers of the younger group, papillae could be observed in all images acquired. Just below the epidermis a low scattering, “optically dark” area is entered. Only a little contrast is obtained in the CLSM images of this layer where the reflected intensity profile drops only slightly with the depth (Fig. 2). Images recorded of this first layer of the dermis show some fine fibrous structure, presumably due to collagen and elastin. At a certain depth a strongly light reflecting layer of larger, more tightly packed collagen bundles is observed. The location of the collagen layer at UD in the dermis appears to be much higher in older skin compared to in younger skin (Table 1). The differences are statistically highly significant. Not only does the position of the fibrous layer change with age, large changes were also observed in the structure of the collagen fibers and bundles. Both effects can be observed in Fig. 3, which shows CLSM images at depth UD max parallel to the skin surface (x–y view) and in a cross-sectional (x–z) view. The location of the reflecting layers can be directly observed in the x–z view and are indicated by arrows. It is clear that this layer is located much deeper below the skin surface of the younger volunteer (image on the left) compared to the older one (image on the right). Moreover, the structure of the bundles at this depth (x–y view) is completely different. The younger skin consists of relatively large bundles, whereas the older skin shows a network of thin small fibers. Figure 3Changes in fibrous structure with age: The two CLSM images were measured at depth UD max, where a layer of reflecting collagen is visible. The image on the left was obtained for a 24 year old and the one on the right for a 54 year old volunteer both of the forearm. The data are shown in a x–z view as well as in a x–y view, indicating the age-related changes in location and structure of collagen fibers. 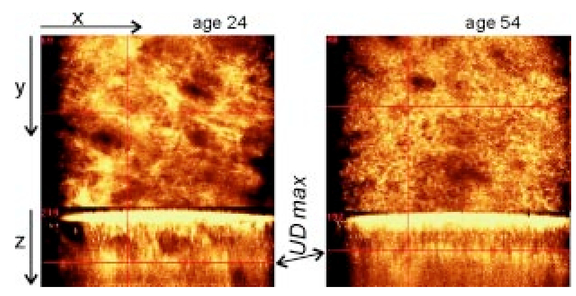 Figure 4 gives a schematic overview of the location and thickness of the various skin layers and their changes with age obtained by OCT and CLSM of the forearm and the temple. It visualizes the overall effects of aging in the upper skin layers of the epidermis and dermis: upon aging the stratum corneum layer undergoes no measurable changes; the thickness of the layer, solely determined by the epidermal cellular structure, dE min , increases somewhat, but is not statistically significant, whereas the maximum thickness of the epidermis, dE max , decreases and as a consequence the dermo-epidermal junction flattens significantly. A highly scattering layer of collagen fibers is located much deeper in the dermis in younger skin than in older skin. The same holds for the reflecting layer obtained with OCT. We did not observe significant differences in skin parameters between female and male volunteers. 4.DiscussionOur results demonstrate that OCT and CLSM are feasible tools for noninvasive and in vivo analysis of the skin morphology. The data allow determination of the thickness and location of various skin layers in the epidermis and upper part of the dermis. Significant differences in the thickness, location, and structure of various skin layers between a younger and an older group were observed with OCT and CLSM. 4.1.Thickness and Location of Skin Layers as a Function of AgeDuring recent years, the upper skin layers, especially the epidermis, have been studied extensively and good correspondence between in vivo measurements and histology has been reported.2 4 7 36 In general, our data are in fair agreement with those of earlier studies. Good correspondence is obtained for the thickness of the stratum corneum d SC and the minimum thickness of the epidermis dE min . 2 4 33 36 37 The thickness of the stratum corneum is found to not change with age, confirming histological data of earlier studies.29 The minimum thickness of the viable epidermis dE min was somewhat larger in the older group, but no significant differences were identified between the two groups investigated. Sauermann et al.;33 studied a relatively old group with a mean age of 72.5 years (compared to a mean age of 55.3 years in our group) and reported a significantly larger layer thickness of dE min for elderly volunteers. The large age difference in their study accounts for the significant difference whereas in our study the difference is not yet significant. While the minimum thickness of the epidermis increases, the maximum thickness of the epidermis dE max decreases with age. This finding agrees with the observation from histological sectioning.27 30 31 38 Consequently, the dermo-epidermal junction flattens by approximately 35.30 31 32 Moreover, our images show that the number of papillae per area becomes much smaller upon aging. This aspect has been studied in a more quantitative manner by Huzaira et al.;39 and Sauermann et al.;33 and the results are consistent with histology. Determination of the epidermal thickness is strongly dependent on the definition of markers.26 Due to undulation of the dermo-epidermal junction, large differences can be obtained in skin layer thickness of dE min and dE max . The dE max in our study compares well with the values determined by Corcuff and Leveque.2 The peak-to-valley modulation of the dermo-epidermal junction of the forearm in our study was 25 and 41 μm in older and younger skin, respectively. The corresponding value for the thickness of the dermo-epidermal junction determined by Rajadhyaksha et al.;,4 however, was more than two times larger (90 μm). Rajadhyaksha et al.;4 reported a maximum thickness of the epidermis of approximately 130 μm (forearm), whereas we obtained a much smaller dE max (89±8 and 75±7 μm in younger and older skin, respectively). The value of 130 μm given by Rajadhyaksha et al.;4 for the epidermal thickness is more comparable with the value we have determined for UD than with our E max. UD was located at average depths of 136±10 and 107±8 μm for the younger and older groups, respectively, and it appeared as a strongly light-scattering layer of fibrous structure. In between markers E max and UD an optically dark layer is visible in the stack of images, where no cellular only fibrous structure is identified. Therefore, we ascribed the images in this area to the first layer of the dermis. A comparison with results obtained with high-frequency ultrasound imaging by El Gammal et al.;40 indicates that the location of UD on the forearm corresponds with the location of a straight ultrasound-scattering band. El Gammal et al.;40 ascribed this echo-rich signal to the interface between the papillary and reticular dermis. The papillary dermis is a relatively thin layer that usually forms no more than 1/10 of the full dermal thickness.28 With this interpretation, the optically dark area in the stack of our CLSM images would represent the papillary dermis and the high contrast at UD would be caused by the interface between the papillary and reticular dermis. This is in line with the observation by Rajadhyaksha et al.;8 The location of the fibrous layer at UD in the dermis is located significantly higher in older skin compared to in younger skin, suggesting that the thickness of the papillary dermis decreases considerably with age. A decrease in thickness of the superficial dermis in aging skin is in agreement with histological findings too.32 Like the parameter UD obtained with CLSM, the results obtained with OCT show large differences between the younger and older groups. The parameter Doct, measured with OCT, decreases significantly with age by approximately 23. OCT turns out to be an attractive measuring technique, since it is fast and sensitive in identifying differences in human skin properties between the two groups studied. For further interpretation of the OCT signals we have made a comparison with those obtained with CLSM (see below). 4.2.Intrinsic versus PhotoagingThe average skin layer parameters at both sites, temple and forearm, show the same trend. Several skin layers become significantly thinner with aging. The difference in parameters between younger and older skin, however, appears to not be identical for the forearm and temple. At the temple the relative decrease in thickness and change in location of the various skin layers with age turned out to be smaller than that measured of the volar forearm. This is most probably due to the more extensive exposure to sunlight of the temple compared to the volar forearm. According to Takema et al.;41 photoaging causes thickening of the skin layers, whereas intrinsic aging results in a decrease of most skin layers. We have made a rough estimate of the contribution of photoaging versus intrinsic aging, assuming that (i) the effects of intrinsic aging are the same for all sites of the human body, (ii) the skin of the younger group may not have experienced photoaging yet, and (iii) at the volar forearm the effect of photoaging is negligible. Although differences in aging were obtained between skin parameters at the forearm and temple, the contribution of photoaging appears to not be statistically significant. 4.3.Comparison of CLSM and OCTWe have compared the results obtained with CLSM and OCT. The mean values of the parameters UD and Doct are of the same order of magnitude, suggesting that their signals might be due to the same layer in the skin. Therefore, we have plotted for all volunteers and sites the parameter UD measured with CLSM against the corresponding parameter Doct determined with OCT (Fig. 5). Good correlation between UD and Doct is obtained: revealed is a Pearson correlation coefficient as high as 0.91. Since the two parameters are random variables a principal components analysis is applied which gives a measure of the association between the two variables. The solid line in Fig. 5 represents the regression line obtained under the assumption of a bivariate normal distribution, and it shows UD=0.86×Doct+15 μm. The regression line suggests a reasonably strong association between UD and Doct measured by the different techniques. Figure 5Comparison of CLSM and OCT skin parameters: UD and Doct: Values of UD determined with CLSM are plotted versus Doct determined with OCT. Good correlation is found between the two parameters, with a Pearson correlation coefficient of 0.91. The solid line represents the regression line obtained under the assumption of a bivariate normal distribution with UD=0.86×Doct+15 μm, indicating a reasonably strong association between the two variables. 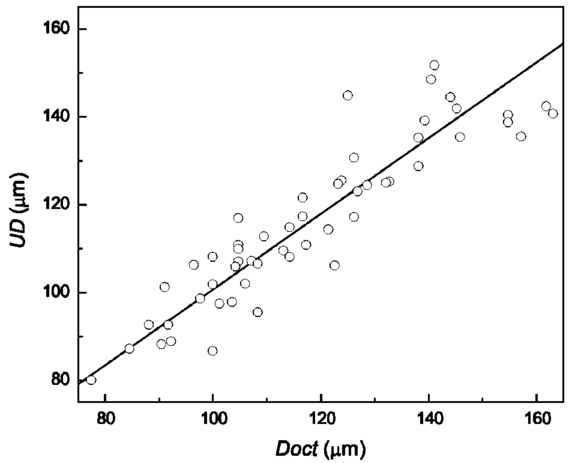 Several aspects may cause deviation from a perfect relationship to one between the two variables UD and Doct: (i) it is not easy to locate the measuring probes of both techniques at exactly the same position, which introduces some anatomical variation of the data; (ii) the penetration depth of our CLSM is limited to about 200 μm. Large values determined for UD may give a lower limit only; (iii) studies with highly scattering material of known thickness and refractive index have shown that especially large values obtained with OCT are overestimated to some extent (by approximately 8), most probably due to multiple scattering. Therefore, precise determination of large values of Doct that were observed on forearms of the younger group in particular is difficult. By considering a correction for multiple scattering for the OCT values, the slope of the regression line further increases. Altogether, our data show a reasonably strong association between the two variables, UD and Doct, obtained with CLSM and OCT, respectively, suggesting that the same layer in the skin is measured with the two techniques. A typical OCT image of a forearm (see Fig. 1) shows two bright reflecting layers. The upper layer is due to scattering from the stratum corneum. In earlier studies,23 26 the second layer was ascribed to the fibrous structure immediately below the basal cell layer, the interface between epidermis and dermis. Our direct comparison of the OCT images with corresponding CLSM data, however, shows that the second bright reflecting band is located much deeper below the epidermal basal layer and can be ascribed to scattering of light at the fibrous structure in the dermis. Possibly the signal is caused by the interface between the papillary and reticular dermis. Our analysis suggests that the marker, Doct, measured with OCT corresponds with the UD obtained by CLSM. In other words, the second light-reflecting layer in OCT (Fig. 1) is due to scattering at collagen fibers in the dermis, of which the structure and location can also be observed with CLSM (Fig. 3). 5.ConclusionOCT and CLSM were used to characterize noninvasive age-related changes in human skin in vivo. In two groups of volunteers (young: 19–24 and older: 54–57 years) measurements were performed on the volar forearm and temple. From the images several parameters were obtained (d SC , dE min , dE max , d DEJ , UD , and Doct) . The overall effect of aging skin was found to be a significant decrease in dE max , d DEJ , UD , and Doct, whereas d SC and dE min changed only slightly with age. Striking structural differences were clearly visible in the images between the young and older groups, i.e., thick collagen bundles in younger skin and thin bundles in older skin. A direct comparison of CLSM and OCT suggests that the second bright reflecting layer in OCT corresponds to the deep bright fibrous layer visible in CLSM. This fibrous layer might be due to the interface between the papillary and reticular dermis. A comparison of the two imaging techniques is important in understanding and interpreting OCT and CLSM images. Both OCT and CLSM enable in vivo noninvasive characterization of the upper human skin layers. AcknowledgmentsThe authors thank Dr. Jan Engel and Dr. William Rey for statistical support and Henk Compen for all the mechanical modifications carried out for the measuring equipment. REFERENCES
K. C. New
,
W. M. Petroll
,
A. Boyde
,
L. Martin
,
P. Corcuff
,
J. L. Leveque
,
M. A. Lemp
,
H. D. Cavanagh
, and
J. V. Jester
,
“In vivo imaging of human teeth and skin using real-time confocal microscopy,”
Scanning , 13 369
–372
(1991). Google Scholar
P. Corcuff
and
J. L. Leveque
,
“In vivo vision of the human skin with the tandem scanning microscope,”
Dermatology (Basel, Switz.) , 186 50
–54
(1993). Google Scholar
C. Bertrand
and
P. Corcuff
,
“In vivo spatio-temporal vizualization of the human skin by real-time confocal microscopy,”
Scanning , 16 150
–154
(1994). Google Scholar
M. Rajadhyaksha
,
M. Grossman
,
D. Esterowitz
,
R. H. Webb
, and
R. R. Anderson
,
“In vivo confocal scanning laser microscopy of human skin: Melanin provides strong contrast,”
J. Invest. Dermatol. , 104 946
–952
(1995). Google Scholar
B. R. Masters
,
G. Gonnord
, and
P. Corcuff
,
“Three-dimensional microscopic biopsy of in vivo human skin: A new technique based on a flexible confocal microscope,”
J. Microsc. , 185
(3), 329
–338
(1997). Google Scholar
F. Koenig
,
S. Gonzalez
,
W. M. White
,
M. Lein
, and
M. Rajadhyaksha
,
“Near-infrared confocal laser scanning microscopy of bladder tissue in vivo,”
Urology , 53 853
–857
(1999). Google Scholar
M. Rajadhyaksha
,
R. R. Anderson
, and
R. H. Webb
,
“Video-rate confocal scanning laser microscope for imaging human tissue,”
Appl. Opt. , 38 2105
–2115
(1999). Google Scholar
M. Rajadhyaksha
,
S. Gonzalez
,
J. M. Zavislan
,
R. R. Anderson
, and
R. H. Webb
,
“In vivo confocal scanning laser microscopy of human skin. II. Advances in instrumentation and comparison with histology,”
J. Invest. Dermatol. , 113 293
–303
(1999). Google Scholar
P. Corcuff
,
C. Chaussepied
,
G. Madry
, and
C. Hadjur
,
“Skin optics revisited by in vivo confocal microscopy: Melanin and sun exposure,”
J. Cosmet. Sci. , 52 91
–102
(2001). Google Scholar
A. F. Fercher
,
K. Mengedoht
, and
W. Werner
,
“Eye length measurement by interferometry with partially coherent light,”
Opt. Lett. , 13 186
–188
(1988). Google Scholar
D. Huang
,
E. A. Swanson
,
C. P. Lin
,
J. S. Schuman
,
W. G. Stinson
,
W. Chang
,
M. R. Hee
,
T. Flotte
,
K. Gregory
,
C. A. Puliafito
, and
J. G. Fujimoto
,
“Optical coherence tomography,”
Science , 254 1178
–1181
(1991). Google Scholar
J. M. Schmitt
,
A. Knu¨ttel
, and
R. F. Bonner
,
“Measurement of optical properties of biological tissue by low-coherence reflectometry,”
Appl. Opt. , 32 6032
–6042
(1993). Google Scholar
J. M. Schmitt
,
M. J. Yadlowsky
, and
R. F. Bonner
,
“Subsurface imaging of living skin with optical coherence microscopy,”
Dermatology (Basel, Switz.) , 191 93
–98
(1995). Google Scholar
J. A. Izatt
,
M. R. Hee
,
G. M. Owen
,
E. A. Swanson
, and
J. G. Fujimoto
,
“Optical coherence microscopy in scattering media,”
Opt. Lett. , 19 590
–592
(1994). Google Scholar
J. A. Izatt
,
M. D. Kulkarni
,
K. Kobayashi
,
A. V. Sivak
,
J. K. Barton
, and
A. J. Welsh
,
“Optical coherence tomography for biodiagnostics,”
Opt. Photonics News , 8 41
–47
(1997). Google Scholar
J. G. Fujimoto
,
M. E. Brezinski
,
G. J. Tearney
,
S. A. Boppart
,
B. Bouma
,
M. R. Hee
,
J. F. Southern
, and
E. A. Swanson
,
“Optical biopsy and imaging using optical coherence tomography,”
Nat. Med. (N.Y.) , 1 970
–972
(1995). Google Scholar
Y. Pan
,
E. Lankenau
,
J. Welzel
,
R. Birngruber
, and
R. Engelhardt
,
“Optical coherence-gated imaging of biological tissues,”
IEEE J. Sel. Top. Quantum Electron. , 2 1029
–1034
(1996). Google Scholar
A. F. Fercher
,
“Optical coherence tomography,”
J. Biomed. Opt. , 1 157
–173
(1996). Google Scholar
J. Welzel
,
E. Lankenau
,
R. Birngruber
, and
R. Engelhardt
,
“Optical coherence tomography of the human skin,”
J. Am. Acad. Dermatol. , 37 958
–963
(1997). Google Scholar
N. D. Gladkova
,
G. A. Petrova
,
N. K. Nikulin
,
S. G. Radenska-Lopovok
,
L. B. Snopova
,
Y. P. Chumakov
,
V. A. Nasonova
,
V. M. Gelikonov
,
G. V. Gelikonov
,
R. V. Kuranov
,
A. M. Sergeev
, and
F. I. Feldchtein
,
“In vivo optical coherence tomography imaging of human skin: Norm and pathology,”
Skin Res. Technol. , 6 6
–16
(2000). Google Scholar
J. M. Schmitt
,
“Optical coherence tomography (OCT): A review,”
IEEE J. Sel. Top. Quantum Electron. , 5 1205
–1215
(1999). Google Scholar
J. G. Fujimoto
,
C. Pitris
,
S. A. Boppart
, and
M. E. Brezinski
,
“Optical coherence tomography: An emerging technology for biomedical imaging and optical biopsy,”
Neoplasia , 2 9
–25
(2000). Google Scholar
J. Welzel
,
“Optical coherence tomography in dermatology: A review,”
Skin Res. Technol. , 7 1
–9
(2001). Google Scholar
M. Kempe
and
W. Rudolph
,
“Scanning microscopy through thick layers based on linear correlation,”
Opt. Lett. , 19 1919
–1921
(1994). Google Scholar
E. Lenderink
,
G. W. Lucassen
,
P. M. van Kemenade
,
M. J. S. T. Steenwinkel
, and
A. A. Vink
,
“In vivo measurements of epidermal thickness with optical coherence tomography and confocal laser scanning microscopy: A comparison of methods,”
Proc. SPIE , 4619 194
–201
(2002). Google Scholar
R. Marks
,
“Measurement of biological aging in human epidermis,”
Br. J. Dermatol. , 104 627
–633
(1981). Google Scholar
L. T. Smith
,
K. A. Holbrook
, and
P. H. Byers
,
“Structure of the dermal matrix during development and in the adult,”
J. Invest. Dermatol. , 79 93s
–104s
(1982). Google Scholar
G. L. Grove
and
A. M. Kligman
,
“Age-associated changes in human epidermal cell renewal,”
J. Gerontol. , 38 137
–142
(1983). Google Scholar
R. M. Lavker
,
P. S. Zheng
, and
G. Dong
,
“Aged skin: A study by light, transmission electron, and scanning electron microscopy,”
J. Invest. Dermatol. , 88 44s
–51s
(1987). Google Scholar
M. C. Branchet
,
S. Boisnic
,
C. Frances
, and
A. M. Robert
,
“Skin thickness changes in normal aging skin,”
Gerontology , 36 28
–35
(1990). Google Scholar
R. S. Kurban
and
J. Bhawan
,
“Histologic changes in skin associated with aging,”
J. Dermatol. Surg. Oncol. , 16 908
–914
(1990). Google Scholar
K. Sauermann
,
S. Clemann
,
S. Jaspers
,
T. Gambichler
,
P. Altmeyer
,
K. Hoffmann
, and
J. Ennen
,
“Age related changes of human skin investigated with histometric measurements by confocal laser scanning microscopy in vivo,”
Skin Res. Technol. , 8 52
–56
(2002). Google Scholar
G. J. Tearney
,
M. E. Brezinski
,
J. F. Southern
,
B. E. Bouma
,
M. R. Hee
, and
J. G. Fujimoto
,
“Determination of the refractive index of highly scattering human tissue by optical coherence tomography,”
Opt. Lett. , 20 2258
–2260
(1995). Google Scholar
A. Knu¨ttel
and
M. Boehlau-Godau
,
“Spatially confined and temporally resolved refractive index and scattering evaluation in human skin performed with optical coherence tomography,”
J. Biomed. Opt. , 5 83
–92
(2000). Google Scholar
P. Corcuff
,
C. Bertrand
, and
J. L. Leveque
,
“Morphometry of human epidermis in vivo by real-time confocal microscopy,”
Arch. Dermatol. Res. , 285 475
–481
(1993). Google Scholar
P. Corcuff
,
G. Gonnord
,
G. E. Pierard
, and
J. L. Leveque
,
“In vivo confocal microscopy of human skin: A new design for cosmetology and dermatology,”
Scanning , 18 351
–355
(1996). Google Scholar
J. L. Leveque
,
P. Corcuff
,
J. de Rigal
, and
P. Agache
,
“In vivo studies of the evolution of physical properties of the human skin with age,”
Int. J. Dermatol. , 23 322
–329
(1984). Google Scholar
M. Huzaira
,
F. Rius
,
M. Rajadhyaksha
,
R. R. Anderson
, and
S. Gonzalez
,
“Topographic variations in normal skin, as viewed by in vivo reflectance confocal microscopy,”
J. Invest. Dermatol. , 116 846
–852
(2001). Google Scholar
S. El Gammal
,
C. El Gammal
,
K. Kaspar
,
C. Pieck
,
P. Altmeyer
,
M. Vogt
, and
H. Ermert
,
“Sonography of the skin at 100 MHz enables in vivo visualization of stratum corneum and viable epidermis in palmar skin and psoriatic plaques,”
J. Invest. Dermatol. , 113 821
–829
(1999). Google Scholar
Y. Takema
,
Y. Yorimoto
,
M. Kawai
, and
G. Imokawa
,
“Age-related changes in the elastic properties and thickness of human facial skin,”
Br. J. Dermatol. , 131 641
–648
(1994). Google Scholar
|
||||||||||||||||||||||||||||||||||||||||||||||||||||||||||||||||||||||||||||||||||


CITATIONS
Cited by 199 scholarly publications and 41 patents.
Skin
Optical coherence tomography
In vivo imaging
Scattering
Collagen
Refractive index
Confocal laser scanning microscopy


