
1.IntroductionSuccess of laser based therapeutic procedures depends critically on delivery of sufficient light to the target volume to induce the desired effect. A diagnostic measurement of the distribution of laser energy deposition and ensuing temperature rise can provide the clinician with necessary knowledge to customize treatment parameters and thus optimize the efficacy of laser treatment. In our laboratory, we are interested in improving laser therapy of port wine stain (PWS) lesions, which are congenital vascular malformations present typically on the face and neck in 0.7 of the population.1 Histopathological studies of PWS show a normal epidermis overlying an abnormal plexus of dilated blood vessels located in the dermis. Epidermal thickness (50–150 μm) and PWS blood vessel diameter (30–300 μm) and depth distribution (150–1000 μm) vary on an individual patient basis and even between different areas on the same patient.2 Current therapy involves use of pulsed dye laser light (λ=585–595 nm), which is absorbed by hemoglobin constituents in blood and epidermal melanin, in conjunction with cryogen spray cooling.3 The goal of therapy is to deliver a sufficient quantity of light to destroy permanently PWS blood vessels and use cryogen spray cooling to minimize laser induced thermal injury to the epidermis. Clinical studies show promising results;4 however, multiple treatments are required, and complete blanching of the PWS lesion is achieved in only ∼10 to 20 of patients.5 6 7 8 A major limitation of current laser therapy is that treatment plans are based primarily on subjective criteria such as PWS color and physician experience. Numerous studies9 10 11 12 13 14 indicate that knowledge of specific PWS skin parameters, such as epidermal thickness (z epi ), melanin absorption, and PWS vessel size and depth (z PWS ), could result in optimization of laser therapy on an individual patient basis. For example, cryogen spray cooling parameters could be optimized with knowledge of z epi and z PWS . 14 Also, the maximum radiant exposure that can be used while safely avoiding epidermal thermal damage is dependent on ΔT epi,max . Finally, selection of optimal laser wavelength may depend on both z PWS and z PWS,max . 15 16 Pulsed photothermal radiometry (PPTR) involves measurement of time resolved changes in blackbody emission after irradiation of an object with a laser pulse.17 Superficial light absorption results in an immediate change in emission. Heat generated by light absorption in deeper structures will affect emission only after it diffuses towards the object surface. Previous studies detail capabilities and limitations of PPTR for depth profiling of chromophores in optically scattering media.18 19 20 21 PPTR has been employed for depth profiling of PWS skin.18 22 Since PWS blood vessels may be located just below the epidermal basal layer (∼60–100 μm below the skin surface),2 high spatial resolution is required. In this paper, we report on the development of a one-dimensional (1-D) numerical model for simulation of optical-thermal response of skin to pulsed dye laser irradiation. Information extracted from histological sections of PWS skin23 24 is incorporated in the model. An iterative, non-negatively constrained conjugate gradient algorithm18 is applied to computed PPTR signals to obtain depth profiles of the simulated PWS skin. In our analysis, reconstructed profiles are presented using a single PPTR signal (single wavelength excitation, SWE) or PPTR signals obtained using a dual wavelength excitation (DWE) approach.25 26 Comparison of the actual and reconstructed profiles from PPTR data revealed a good match. Results of this study indicate that PPTR is a viable approach for depth profiling of PWS skin. 2.Optical-Thermal ModelTo evaluate PPTR, a 1-D optical-thermal model incorporating PWS skin structure from a digitized biopsy23 was developed. An overview of the overall model scheme is presented in Fig. 1. Figure 1Flow chart of the optical-thermal modeling technique using a biopsy-defined PWS skin geometry. Rectangles represent input or output, and ellipses represent data processing steps. Histology sections were first converted from 2-D cross-sectional slices to 1-D absorption profiles. A Monte Carlo model was applied to simulate light transport and energy deposition in each section. This procedure was repeated for each of the 42 histology sections used in this study. The 42 light distributions were converted to a corresponding number of initial temperature profiles immediately after pulsed laser irradiation. An average heat source profile was calculated and used as input in an explicit finite difference model to simulate ensuing heat transfer dynamics and compute a PPTR signal.  2.1.Digitized PWS BiopsySmithies et al.;23 obtained a biopsy of PWS skin that was cut into 6-μm-thick sections and stained with hematoxylin and eosin. Sections were imaged with a digital camera mounted on an optical microscope, and boundaries for the epidermis, dermis, and blood vessels were identified. In the present study, we used a digitized histology region similar to that in Pfefer et al.;24 Slicer Dicer® software (Pixotec, Renton, WA) was used to extract 42 consecutive axial sections from the region. The dimensions of each section were 264 μm (lateral)×458 μm (axial), and pixel dimensions were 2 μm×2μm. Software written in LabVIEW™ (Version 6i, National Instruments, Austin, TX) was used to identify PWS blood vessels in each section and determine their cross-sectional areas and positions. 2.2.Conversion of 2D Histology Section to 1D ProfileWith custom software written in Matlab™ (Version 6.1, The MathWorks, Natick, MA), each row in each two-dimensional (2-D) section was classified as one of the following (Fig. 2): Figure 2Example of 2-D histology section divided into different layers. In this example, the gray region is the epidermis, the black regions are cross sections of blood vessels, and the lightly shaded region is bloodless dermis. Each of the 229 rows in the image was classified into one of eight types (see figure legend). Adjacent rows of the same type were grouped into layers. Layers without blood vessels were analyzed row by row. Layers with blood vessels were analyzed as a single layer. In this example, two blood vessel layers (“h”) are present. Note that only six of the eight layer types listed in the legend are present in the presented example. Scale bar=50 μm=25 rows.  a. Air b. Air/epidermis c. Air/epidermis/dermis d. Epidermis e. Epidermis/dermis f. Epidermis/dermis/blood g. Dermis h. Dermis/blood Next, an absorption coefficient μa was assigned to each bloodless row as a weighted sum of epidermal and dermal μa values. The epidermal absorption coefficient (μa,epi ) was chosen to represent fair human skin. Within the reported range of values,8 27 μa,epi =13 cm −1 was selected at 585 nm, representative of fair-skinned human subjects.25 26 An epidermal melanin fraction f mel associated with the selected μa,epi value at 585 nm was determined to compute μa,epi at 600 nm using the following equations:27 where μa,mel is the melanosome absorption coefficient, μa,baseline is the average absorption coefficient of other skin structures, and λ is the laser wavelength (nm). In the present study, f mel was ∼3, resulting in μa,epi =12 cm −1 at 600 nm (see Table 1).Table 1
Adjacent rows containing blood were grouped together to create layers containing entire blood vessels (Fig. 2); μa of each of these layers was calculated as where fx is the fractional area occupied by component “x”; and subscripts “epi,” “der,” and “bld” denote epidermis, dermis, and blood, respectively. For example, for a given row, f epi was determined by counting the number of pixels representing epidermal tissue and then dividing this number by the total number of pixels in the same row. The term fi is the area fractional content of vessel “i” in the layer, and Ci is a correction factor for blood vessel i. Ci was introduced by Verkruysse et al.;28 to account for optical screening in PWS blood vessels. Due to high absorption of 585 and 600 nm light in blood, red blood cells towards the vessel center interact less with incident light than those at the periphery. This effect becomes more prominent as vessel diameter increases. Ci effectively reduces the blood fraction of each vessel, allowing the assumption of a homogeneous blood distribution in each layer. This simplifies computations yet yields a correct fluence distribution and energy deposition profile. The following equation was found to fit data from Verkruysse et al.;:28 The effective radius ri of the ith blood vessel was computed from the associated cross-sectional area (Ai) as (Ai/π)1/2. Blood μa values represent 75 oxygen saturation29 (Table 1).Since the axial extent of each 2-D histology section was only 458 μm or less, additional PWS skin structure was added to the model to increase the total simulated skin depth to 2 mm. This step was necessary to minimize deep-edge artifacts and ensure that realistic light and temperature distributions were computed. The μa values at depths below the bottom of each slice were computed using Eqs. (1 2 3 4) and mean blood vessel sizes and blood fractions provided in Barsky et al.;2 (Table 2). Table 2
2.3.Monte Carlo (MC) Optical ModelA multilayer Monte Carlo (MC) code developed by Wang et al.;30 was used to compute laser energy deposition in each 1-D skin profile. Briefly, MC simulations involve division of incident light energy into a set number of “photons,” each of which is traced as it undergoes absorption and scattering events. The Henyey–Greenstein phase function was used to describe the probability density function of light scattering in skin.30 In each model run, 10 000 photons were used; minimal differences in light distributions were observed in a preliminary simulation comparing results with 10 000 and 100 000 photons. An axisymmetric geometry was assumed, including radial and axial coordinates, with all photons launched from the system origin (e.g., coordinate r=0, z=0) , in a direction perpendicular to the skin surface. Hence, MC model output represented the light distribution in PWS skin due to an instantaneous pulse of a narrow, collimated light beam. A convolution algorithm (CONV)31 was applied to convolve the results laterally, to arrive at the expected 2-D axisymmetric light distribution for a finite incident 5-mm-diam beam. For each model run, the product of the light distribution and associated depth-resolved μa profile was computed to determine the energy deposition profile. Finally, the average depth-resolved energy deposition profile Q(z) was obtained as the mean of the 42 individual energy deposition profiles, with depth resolution of 2 μm and 1000 grid points, and is used as the heat source term in the finite difference (FD) model (Sec. 2.4). A relatively wide range of scattering coefficient (μs) values exists for human skin.8 16 32 33 In the 550–600 nm range, dermal μs values are ∼200 cm−1 and epidermal values range between 200 and 500 cm−1. We used an epidermal scattering coefficient (μs,epi ) value of 200 cm−1 in the model, but also evaluated the effect of μs,epi =500 cm −1 on computed temperature profiles. With the latter μs,epi , the epidermal μa was adjusted so that the maximum temperature rises in the epidermis and PWS remained similar, resulting in μa=9 cm −1 at 585 nm. Anisotropy factor (g) of 0.79 and refractive index (n) of 1.37 were used. To simplify computations, scattering properties of blood were assumed to be identical to those of dermis. Although scattering properties of blood differ considerably from skin,24 use of skin properties was not expected to substantially affect the model results due to the relatively small blood fraction in each section. For each simulation, total diffuse reflectance values were computed to serve as additional verification of the model. 2.4.Finite Difference (FD) Thermal ModelA custom FD model34 was applied to compute temperature profile evolution after skin irradiation, by solving numerically the 1-D heat diffusion equation where α is thermal diffusivity and Q is the average heat source term determined with the Monte Carlo model. A convective (Robin) boundary condition was assumed at the surface where k is thermal conductivity, h is heat transfer coefficient, and T∞ is ambient temperature (25 °C). Thermal properties of PWS skin used in the FD model are summarized in Table 3.Table 3
In our PPTR experiments, a Candela (Wayland, MA) ScleroPlus™ laser is typically used to deliver 1.5-ms-long laser pulses at 585 and 600 nm. Thus, we first used the FD model to calculate the initial temperature profile ΔT(z,t=0) at the end of the 1.5 ms pulse. At each subsequent time step of the FD model, a PPTR signal value ΔS(t>0) was computed as18 where ΔT(z,t) is the temperature rise above the initial skin temperature T0=30 °C, and d is tissue thickness. In this model, μir was 26.5 mm−1, the value determined for a detection bandwidth of 4.5–5 μm.35 The infrared detector acquisition rate was set to 700 Hz. A total of 500 PPTR signal values [ΔS(t>0)] was computed, for an acquisition time of 0.714 s.Milner et al.;18 expressed signal-to-noise ratio (SNR) in PPTR signals as where 〈*〉 represents a time average of quantity * and e is the standard deviation of zero mean Gaussian noise added to ΔS(t). From measurements with our infrared camera (unpublished data), we have determined that our system SNR typically exceeds 1000. Thus, in the model, we added noise to ΔS(t) assuming a SNR of 1000.2.5.Reconstructions of Initial Temperature Profiles ΔT(z,t=0)Laser induced temperature profiles were reconstructed first using the 585 nm PPTR signal (e.g., single wavelength excitation, SWE) as input to an iterative non-negatively constrained conjugate gradient algorithm.18 The solution depth interval of 1.5 mm was divided into 96 equal intervals, resulting in a grid spacing of ∼16 μm. The L-curve criterion36 was used to determine the optimal number of iterations. In this approach, the logarithm of the Euclidean norm of the solution estimate (‖ΔT i‖) is plotted as a function of that of the residual vector (‖ΔS−KΔT i‖) for various iteration numbers i. Typically, the resulting curve has the shape of the letter “L,” and the optimal iteration number is at the corner of the L. However, due to ambiguity in determining the exact optimal iteration number, five near-optimal solutions were averaged and standard deviation calculated at each depth. The PPTR signal ΔS(t) is considered as the sum of two components, originating from light absorption in blood [x(t)] and epidermal melanin [y(t)]. 25 PPTR signals after irradiation at 585 and 600 nm are where α and β are constants accounting for differences in light absorption between blood and melanin, respectively, at the two wavelengths. Since blood absorption of 585 nm light is stronger than that of 600 nm light (Table 1), the value of α is less than unity. Since epidermal absorption of both 585 and 600 nm light is almost identical (Table 1), we anticipate a value of β that approaches unity. After determining α and β according to principles described by Majaron et al.;,25 26 PWS and epidermal contributions to the initial temperature profiles were reconstructed from x(t) and y(t), respectively, using the same approach as described above for SWE-PPTR.2.6.Analysis of Reconstructed ProfilesThe following PWS skin characteristics were determined from the reconstructed temperature profiles: (1) average epidermal thickness (z epi ), defined as the depth at which the epidermal temperature profile reaches ΔT=0 °C; (2) maximum epidermal temperature rise (ΔT epi,max ); (3) depth of PWS upper boundary (z PWS ), defined as the half maximum point of the PWS temperature profile nearest the skin surface; and (4) depth of the maximum PWS temperature rise (z PWS,max ). 3.ResultsFigure 3 presents a comparison between laser induced (λ=585 nm) temperature profiles, computed from the model using two sets of epidermal optical properties: (1) μa,epi =13 cm −1 and μs,epi =200 cm −1 (solid line); and (2) μa,epi =9 cm −1 and μs,epi =500 cm −1 (dashed line). In general, the two profiles were very similar in shape and demonstrate the complex structure of PWS skin. With higher μs,epi , the epidermal temperature rise was slightly higher, but PWS temperature profiles were nearly identical in shape and amplitude. Total diffuse reflectance values were 19 and 24 for μs,epi =200 and 500 cm−1, respectively. A diffuse reflectance value of 19 was comparable to values (14–17) measured from fair-skinned PWS patients.37 Furthermore, use of a higher μs,epi value of 500 cm−1 (at a correspondingly reduced μa,epi =9 cm −1) had a minimal effect on the computed PWS temperature profile, suggesting that the ambiguity in μs,epi values8 16 32 33 does not detract from the interpretation of our modeling results. Due to these observations, we used μs,epi =200 cm −1 for the remainder of the study. Figure 3Comparison of computed initial temperature profiles at 585 nm using two different sets of epidermal optical properties: μa=13 cm −1, μs=200 cm −1 (solid line); and μa=9 cm −1, μs=500 cm −1 (dashed line). Epidermal profiles differed slightly, but PWS profiles were nearly identical in shape and amplitude.  Comparison of fluence profiles at 585 and 600 nm reveals that the fluence at 600 nm was consistently higher than that at 585 nm (Fig. 4). This trend was due to the substantially lower blood absorption of 600 nm light, resulting in deeper light penetration but also more backscattered light. The increased quantity of backscattered light resulted in a diffuse skin reflectance (30), considerably higher than at 585 nm (19). Figure 4Fluence profiles at 585 and 600 nm. The μs,epi =200 cm −1 was used in the calculation. The fluence was considerably higher at 600 nm due to the substantially lower blood absorption coefficient, resulting in a higher quantity of backscattered and deeply penetrating light.  Comparison of initial temperature profiles after irradiation at 585 and 600 nm illustrates the effect of a large difference in μa,bld between the two wavelengths [Fig. 5(a)]. Epidermal temperature rise at 600 nm (dashed line) is slightly higher than at 585 nm (solid line), despite the lower melanin absorption at the longer wavelength (Table 1). This is a direct consequence of the significantly higher epidermal fluence at 600 nm in comparison with 585 nm (Fig. 4). Corresponding PPTR signals computed with the FD model are presented in Fig. 5(b). Immediately after the end of the laser pulse, the radiometric temperature rise is nearly identical at both wavelengths due to the similar initial epidermal temperature rise [Fig. 5(a)]. At later times, as heat diffuses from the PWS towards the skin surface, the PPTR signal contains information pertinent to heating of increasingly deeper skin layers. Since the PWS temperature rise was considerably higher at 585 nm, the 585 nm PPTR signal is characterized by a higher delayed component than the 600 nm counterpart. Figure 5(a) Computed initial temperature profiles at the end of 1.5 ms laser pulses at 585 and 600 nm. (b) PPTR signals computed for incident 585 and 600 nm laser pulses. The FD model was used to calculate heat transfer dynamics with the initial temperature profiles in (a) used as input. Assumed signal-to-noise ratio was set to 1000.  These simulated PPTR signals were input into an iterative non-negatively constrained conjugate gradient algorithm to reconstruct initial temperature profiles. From the SWE-PPTR reconstructed profile [Fig. 6(a)], ΔT epi,max and z PWS,max can be determined (Table 4); however, z epi and z PWS cannot be determined. With separate epidermal and PWS profiles obtained from DWE-PPTR, z epi and z PWS can be determined in addition to ΔT epi,max and ΔT PWS,max [Fig. 6(b)], demonstrating that the DWE approach allows us to characterize features of PWS skin even when the PWS is in close proximity to the epidermal-dermal junction. DWE-PPTR parameters α and β [Eq. (8)] were determined as 0.47 and 1.07, respectively. The small error bars in Fig. 6 illustrate the stability of the iterative reconstruction process over a range of iterations in close proximity to the corner of the L curve. Figure 6Comparison of (a) SWE- and (b) DWE-PPTR reconstructed profiles with the actual 585 nm initial temperature profile. In (a), ΔS585(t) was used as input, and “Actual” represents the actual initial profile and “Reconstructed” the profile reconstructed by applying the conjugate gradient algorithm to the SWE-PPTR signal. In (b), both signals from Fig. 5 were used as input. The actual 585 nm initial temperature profile (Actual) is shown in gray. X(z) and Y(z) represent profiles reconstructed from signal components x(t) and y(t), respectively. Error bars represent standard deviations of five iterative solutions. DWE parameters: α=0.47, β=1.07.  Table 4
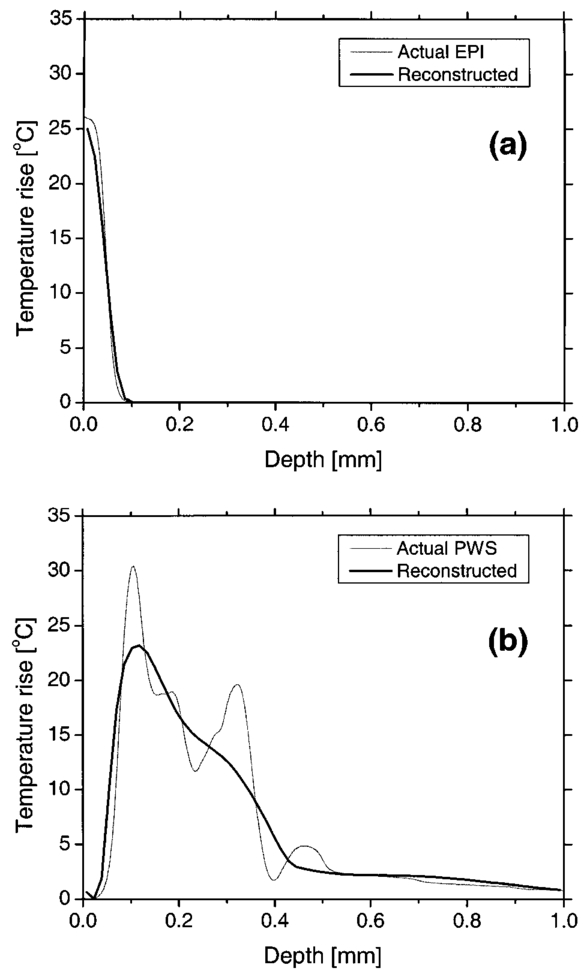
A deep component was evident in the reconstructed epidermal profile [Fig. 6(b), dashed line], in contradiction with anatomical knowledge that no melanin is present in human skin at depths greater than 100–200 μm.38 Majaron et al.;25 26 attributed this deep component to the approximate nature of Eq. (8). A 600 nm light penetrates more deeply in PWS skin than 585 nm light. However, Eq. 8(b) only includes a multiplicative factor α as the difference between the PWS components of the PPTR signals at the two wavelengths. As a result of this discrepancy, the solution Y(z) reconstructed from signal component y(t) includes a deep component which originates from PWS blood absorption.25 This subcomponent must be added to the profile X(z) reconstructed from x(t) to constitute the actual PWS temperature profile [Fig. 6(b)]. After this modification was implemented, we used our model to compute separately initial temperature profiles due to epidermal and blood absorption [Figs. 7(a) and 7(b), respectively]. Comparison of actual and DWE-PPTR reconstructed epidermal profiles [Fig. 7(a)] revealed a good match in shape, as well as in z epi and ΔT epi,max values (Table 4). Similarly, the general shape of the actual PWS profile [Fig. 7(b)] was reproduced reasonably well. 4.DiscussionIn this study, a biopsy-defined PWS skin geometry23 was employed. Using serial histological sections of PWS skin as input, the resulting laser induced temperature profile [Fig. 5(a)] was considerably more complex than those used in previous studies.18 19 35 If the most superficial PWS blood vessels are distinctly separated from the epidermis, it is usually possible to extract clinically relevant PWS characteristics from SWE-PPTR reconstructed temperature profiles. However, in most PWS patients, the most superficial blood vessels are located within the upper 200 μm of the dermis,2 and thus SWE-PPTR reconstructed profiles oftentimes resemble the profile in Fig. 6(a), from which only ΔT epi,max and z PWS,max can be extracted. In DWE-PPTR reconstructed temperature profiles of experimental data,25 26 an overlap of the epidermal and PWS components was often observed. Proposed explanations were undulations in the epidermal basal layer and broadening of one or both reconstructed profiles due to the limited spatial resolution of PPTR.19 25 39 From the actual epidermal and PWS temperature profiles (Fig. 7), an overlap of the epidermal and PWS profiles was indeed present. Furthermore, in the presented simulated example of DWE-PPTR profiling, separation of the reconstructed temperature profile into epidermal and PWS contributions yielded a ∼50 μm overlap between the two solutions [Fig. 6(b)]. Comparison of the reconstructed PWS profile to the actual initial profile [Fig. 7(b)] revealed that the former was indeed broader. An increased sampling rate of ΔS(t) may reduce this effect but may increase the noise level in ΔS(t), potentially affecting the stability of the iterative reconstruction process. DWE parameters α and β were determined as 0.47 and 1.07, respectively. These values are in good agreement with those obtained from experimental data of fair-skinned patients.25 26 35 Majaron et al.;25 also determined that the sum of the integrals of the epidermal and PWS reconstructed temperature profiles matches the integral of the SWE-PPTR reconstructed profile within 1–2. From our results, the difference between the two integrals is only ∼2, supporting the selected values of α and β. A qualitative comparison demonstrates that DWE-PPTR can provide accurate temperature profiles of the epidermis (Fig. 7(a), Table 4). However, in the reconstructed PWS profile, high spatial frequency components in the profile were not reproduced, in agreement with previous theoretical and experimental studies.18 19 The area of skin included in the histology sections was approximately 0.25 mm×1.6 mm, which was ten times smaller than the 3.7 mm2 region typically interrogated in our experiments.25 26 If more histological sections were utilized in the simulations, the PWS profile probably would have contained fewer high spatial frequency components, thereby improving our ability to reconstruct the initial temperature profile. Nevertheless, location and shape of the superficial part of the PWS temperature profile was reconstructed reasonably well, allowing determination of z PWS within 20 μm and z PWS,max within 15 μm (Table 4). Using DWE-PPTR, all four clinically relevant PWS skin characteristics can be determined with an accuracy sufficient to guide selection of optimal laser treatment parameters on an individual patient basis (Table 4). 5.ConclusionsA 1-D optical-thermal model was developed to evaluate PPTR depth profiling of PWS skin. A biopsy-defined PWS skin geometry was used to add realism to the model. From a preliminary sensitivity analysis, the computed initial temperature profile was minimally affected by large differences in optical properties. From SWE-PPTR reconstructed profiles, ΔT epi,max and z PWS,max were determined accurately, but z epi and z PWS could not be determined. Comparison of the actual and DWE-PPTR reconstructed profiles revealed a good match for all four PWS skin characteristics of clinical interest. Results of this study indicate that DWE-PPTR is a viable approach for depth profiling of PWS skin, for the purpose of laser therapy optimization. AcknowledgmentsThe authors thank Dr. Josh Pfefer of the U.S. Food and Drug Administration for assistance with the PWS geometry used in the model. Funding sources include the Arnold and Mabel Beckman Fellows Program (B.C.), National Institutes of Health (NIH) (AR-43419 and GM-62177, to J.S.N.), and Slovenian Ministry of Education and Science (B.M.). The Air Force Office of Scientific Research, NIH, and the Beckman Laser Institute and Medical Clinic Endowment provided institutional support. REFERENCES
A. H. Jacobs
and
R. G. Walton
,
“The incidence of birthmarks in the neonate,”
Pediatrics , 58 218
–222
(1976). Google Scholar
S. H. Barsky
,
S. Rosen
,
D. E. Geer
, and
J. M. Noe
,
“The nature and evolution of port wine stains: A computer-assisted study,”
J. Invest. Dermatol. , 74 154
–157
(1980). Google Scholar
J. S. Nelson
,
T. E. Milner
,
B. Anvari
,
B. S. Tanenbaum
,
S. Kimel
,
L. O. Svaasand
, and
S. L. Jacques
,
“Dynamic epidermal cooling during pulsed laser treatment of port-wine stain: A new methodology with preliminary clinical evaluation,”
Arch. Dermatol. , 131 695
–700
(1995). Google Scholar
K. M. Kelly
,
V. S. Nanda
, and
J. S. Nelson
,
“Treatment of port-wine stain birthmarks using the 1.5-msec pulsed dye laser at high fluences in conjunction with cryogen spray cooling,”
Dermatol. Surg. , 28 309
–313
(2002). Google Scholar
C. M. A. M. van der Horst
,
P. H. L. Koster
,
C. A. J. M. deBorgie
,
P. M. M. Bossuyt
, and
M. J. C. van Gemert
,
“Effect of timing of treatment of port-wine stains with the flash-lamp-pumped pulsed dye laser,”
N. Engl. J. Med. , 338 1028
–1033
(1998). Google Scholar
J. G. Morelli
,
W. L. Weston
,
J. C. Huff
, and
J. J. Yohn
,
“Initial lesion size as a predictive factor in determining the response of port-wine stains in children treated with the pulsed dye laser,”
Arch. Pediatr. Adolesc. Med. , 149 1142
–1144
(1995). Google Scholar
S. W. Lanigan
,
“Port-wine stains unresponsive to pulsed dye laser: Explanations and solutions,”
Br. J. Dermatol. , 139 173
–177
(1998). Google Scholar
L. O. Svaasand
,
M. J. C. van Gemert
,
W. Verkruysse
,
E. J. Fiskerstrand
, and
L. T. Norvang
,
“Dosimetry for laser treatment of port wine stains,”
Proc. SPIE , 3601 463
–471
(1999). Google Scholar
M. J. C. van Gemert
,
J. S. Nelson
,
T. E. Milner
,
D. J. Smithies
,
W. Verkruysse
,
J. F. de Boer
,
G. W. Lucassen
,
D. M. Goodman
,
B. S. Tanenbaum
,
L. T. Norvang
, and
L. O. Svaasand
,
“Non-invasive determination of port wine stain anatomy and physiology for optimal laser treatment strategies,”
Phys. Med. Biol. , 42 937
–950
(1997). Google Scholar
J. F. de Boer
,
G. W. Lucassen
,
W. Verkruysse
, and
M. J. C. van Gemert
,
“Thermolysis of port-wine-stain blood vessels: Diameter of a damaged blood vessel depends on the laser pulse length,”
Laser Med. Sci. , 11 177
–180
(1996). Google Scholar
J. K. Barton
,
G. Vargas
,
T. J. Pfefer
, and
A. J. Welch
,
“Laser fluence for permanent damage of cutaneous blood vessels,”
Photochem. Photobiol. , 70 916
–920
(1999). Google Scholar
L. O. Svaasand
,
E. J. Fiskerstrand
,
G. Kopstad
,
L. T. Norvang
,
E. K. Svaasand
,
J. S. Nelson
, and
M. W. Berns
,
“Therapeutic response during pulsed laser treatment of port-wine stains: Dependence on vessel diameter and depth in dermis,”
Laser Med. Sci. , 10 235
–243
(1995). Google Scholar
S. Kimel
,
L. O. Svaasand
,
D. Cao
,
M. J. Hammer-Wilson
, and
J. S. Nelson
,
“Vascular response to laser photothermolysis as a function of pulse duration, vessel type, and diameter: Implications for port wine stain laser therapy,”
Lasers Surg. Med. , 30 160
–169
(2002). Google Scholar
W. Verkruysse
,
B. Majaron
,
B. S. Tanenbaum
, and
J. S. Nelson
,
“Optimal cryogen spray cooling parameters for pulsed laser treatment of port wine stains,”
Lasers Surg. Med. , 27 165
–170
(2000). Google Scholar
M. J. C. van Gemert
,
D. J. Smithies
,
W. Verkruysse
,
T. E. Milner
, and
J. S. Nelson
,
“Wavelengths for port wine stain laser treatment: Influence of vessel radius and skin anatomy,”
Phys. Med. Biol. , 42 41
–50
(1997). Google Scholar
W. Verkruysse
,
J. W. Pickering
,
J. F. Beek
,
M. Keijzer
, and
M. J. C. van Gemert
,
“Modeling the effect of wavelength on the pulsed dye laser treatment of port wine stains,”
Appl. Opt. , 32 393
–398
(1993). Google Scholar
A. C. Tam
and
B. Sullivan
,
“Remote sensing applications of pulsed photothermal radiometry,”
Appl. Phys. Lett. , 43 333
–335
(1983). Google Scholar
T. E. Milner
,
D. M. Goodman
,
B. S. Tanenbaum
, and
J. S. Nelson
,
“Depth profiling of laser-heated chromophores in biological tissues by pulsed photothermal radiometry,”
J. Opt. Soc. Am. A , 12 1479
–1488
(1995). Google Scholar
D. J. Smithies
,
T. E. Milner
,
B. S. Tanenbaum
,
D. M. Goodman
, and
J. S. Nelson
,
“Accuracy of subsurface temperature distributions computed from pulsed photothermal radiometry,”
Phys. Med. Biol. , 43 2453
–2463
(1998). Google Scholar
I. A. Vitkin
,
B. C. Wilson
,
R. R. Anderson
, and
S. A. Prahl
,
“Pulsed photothermal radiometry in optically transparent media containing discrete optical absorbers,”
Phys. Med. Biol. , 39 1721
–1744
(1994). Google Scholar
R. R. Anderson
,
H. Beck
,
U. Bruggemann
,
W. Farinelli
,
S. L. Jacques
, and
J. A. Parrish
,
“Pulsed photothermal radiometry in turbid media: Internal reflection of backscattered radiation strongly influences optical dosimetry,”
Appl. Opt. , 28 2256
–2262
(1989). Google Scholar
S. L. Jacques
,
J. S. Nelson
,
W. H. Wright
, and
T. E. Milner
,
“Pulsed photothermal radiometry of port-wine-stain lesions,”
Appl. Opt. , 32 2439
–2446
(1993). Google Scholar
D. J. Smithies
,
M. J. C. van Gemert
,
M. K. Hansen
,
T. E. Milner
, and
J. S. Nelson
,
“Three-dimensional reconstruction of port wine stain vascular anatomy from serial histological sections,”
Phys. Med. Biol. , 42 1843
–1847
(1997). Google Scholar
T. J. Pfefer
,
J. K. Barton
,
D. J. Smithies
,
T. E. Milner
,
J. S. Nelson
,
M. J. C. van Gemert
, and
A. J. Welch
,
“Modeling laser treatment of port wine stains with a computer-reconstructed biopsy,”
Lasers Surg. Med. , 24 151
–166
(1999). Google Scholar
B. Majaron
,
W. Verkruysse
,
B. S. Tanenbaum
,
T. E. Milner
,
S. A. Telenkov
,
D. M. Goodman
, and
J. S. Nelson
,
“Combining two excitation wavelengths for pulsed photothermal profiling of hypervascular lesions in human skin,”
Phys. Med. Biol. , 45 1913
–1922
(2000). Google Scholar
B. Majaron
,
T. E. Milner
, and
J. S. Nelson
,
“Determination of parameter β for dual-wavelength pulsed photothermal profiling of human skin,”
Rev. Sci. Instrum. , 74 387
–389
(2003). Google Scholar
W. Verkruysse
,
G. W. Lucassen
,
J. F. de Boer
,
D. J. Smithies
,
J. S. Nelson
, and
M. J. C. van Gemert
,
“Modeling light distributions of homogeneous versus discrete absorbers in light irradiated turbid media,”
Phys. Med. Biol. , 42 51
–65
(1997). Google Scholar
L. Wang
,
S. L. Jacques
, and
L. Zheng
,
“MCML—Monte Carlo modeling of light transport in multi-layered tissues,”
Comput. Methods Programs Biomed. , 47 131
–146
(1995). Google Scholar
L. H. Wang
,
S. L. Jacques
, and
L. Q. Zheng
,
“CONV—Convolution for responses to a finite diameter photon beam incident on multi-layered tissues,”
Comput. Methods Programs Biomed. , 54 141
–150
(1997). Google Scholar
B. Choi
,
J. A. Pearce
, and
A. J. Welch
,
“Modeling infrared temperature measurements: Implications for laser irradiation and cryogen cooling studies,”
Phys. Med. Biol. , 45 541
–557
(2000). Google Scholar
B. Majaron
,
W. Verkruysse
,
B. S. Tanenbaum
,
T. E. Milner
, and
J. S. Nelson
,
“Spectral variation of the infrared absorption coefficient in pulsed photothermal profiling of biological samples,”
Phys. Med. Biol. , 47 1929
–1946
(2002). Google Scholar
P. R. Johnston
and
R. M. Gulrajani
,
“Selecting the corner in the L-curve approach to Tikhonov regularization,”
IEEE Trans. Biomed. Eng. , 47 1293
–1296
(2000). Google Scholar
L. O. Svaasand
,
M. J. C. van Gemert
,
W. Verkruysse
,
E. J. Fiskerstrand
, and
L. T. Norvang
,
“Dosimetry for laser treatment of port wine stains,”
Proc. SPIE , 3601 463
–471
(1999). Google Scholar
L. O. Olsen
,
H. Takiwaki
, and
J. Serup
,
“High-frequency ultrasound characterization of normal skin: Skin thickness and echographic density of 22 anatomical sites,”
Skin Res. Technol. , 1 74
–80
(1995). Google Scholar
U. S. Sathyam
and
S. A. Prahl
,
“Limitations in measurement of subsurface temperatures using pulsed photothermal radiometry,”
J. Biomed. Opt. , 2 251
–261
(1997). Google Scholar
|
|||||||||||||||||||||||||||||||||||||||||||||||||||||||||||||||||||||||||||||||||||


CITATIONS
Cited by 49 scholarly publications.
Skin
Blood
Absorption
Blood vessels
Monte Carlo methods
Profiling
Laser therapeutics


