1.IntroductionHuman skin is structurally and optically heterogeneous. It consists of two discrete layers, the epidermis and the dermis, each with different biological structure and different optical properties arising from their individual absorbing and scattering constituents. The epidermis is a highly cellular tissue consisting of layers of keratinocytes. It is known that the primary absorber in the epidermis is melanin. It has also been shown1 2 that particulate melanin is a major contributor to epidermal scattering. Melanin is synthesized in specialized organelles, the melanosomes, which are manufactured in the melanocytes that are found at the basal layer of the epidermis (Fig. 1). The melanosomes are secreted from the dendritic processes of the melanocytes and they are phagocytosed by the keratinocytes. The dermis is essentially an acellular tissue sparsely populated by fibroblasts. It consists primarily of extracellular matrix components (collagen and elastin), blood vessels, and lymphatic vessels. Collagen microfibrils are organized into fibers and the fibers into bundles. These structures constitute the major cause of light scattering in the skin. Hemoglobin is found in the dermal blood supply and is responsible for the red appearance of skin as in the case of erythema. Skin hemoglobin is confined in networks of arterial and venous plexi that run approximately parallel to the skin surface and in small capillaries that run vertical to the skin surface and reach close to the dermal-epidermal junction in the form of capillary loops (Fig. 1). Anatomically one can distinguish a superficial arterial and venous plexus and a deeper plexus. The capillaries stem from the superficial arterial plexus and empty in the superficial venous plexus. The superficial and deeper plexi are interconnected through smaller vessels. At the deeper level arteriovenous anastomoses (shunts) provide ways for blood flow to bypass superficial skin layers, thus enabling skin thermal regulation. Circulating erythrocytes in the blood vessels contain high concentrations of hemoglobin. The hemoglobin molecule has four heme groups, which can bind to and deliver oxygen molecules to the tissues. When these binding sites are unoccupied the molecule is called deoxy-hemoglobin (deoxy-Hb) and when they are occupied by oxygen molecules it is termed oxy-hemoglobin (oxy-Hb). Each form of hemoglobin has its own characteristic absorption profile.3 4 It follows from before that the visual perception of skin color is the cumulative result of contributions of various optically active molecules that are found in varying concentrations in the skin. The relative contributions of each chromophore can be evaluated quantitatively by analyzing the remittance spectra of skin tissue, keeping in mind that the calculated apparent concentrations of chromophores are averaged for a tissue volume defined by the penetration depth of the interrogating illumination. Skin reactions are events that may be detected by the clinician’s sense of vision, touch, and sometimes smell. Primarily, skin reactions such as erythema (redness), blanching (whitening), pigmentation (tanning), and induration are evaluated visually. The severity of the reaction is assessed given an index ranging typically from 0 (for no reaction) to 5 (for severe reaction). Even though the eye of the trained physician is a powerful tool such evaluations are subjective and semiquantitative. Objective quantitative evaluation of skin color reactions using noninvasive instrumentation has been used since the early decades of the 20th century.5 6 7 8 Since then spectrophotometers have become smaller and simpler in use. Many researchers have used methods based on reflectance measurements that either give “erythema” and “pigmentation” indices based on simple calculations9 10 11 12 or calculate tri-stimulus values (L*a*b* scale) that have been adopted by the international committee of standards as the preferred method for color measurement.11 13 14 15 16 17 18 19 In the latter method L* and b*, as well as combinations of the two, have been used as pigmentation parameters and a* as the erythema parameter. Recent studies have showed that in both methods what is clinically perceived as erythema and pigmentation does not correlate linearly with the calculated indices.20 21 A more accurate method is to analyze the remitted spectrum to its constituents based on diffuse reflectance spectroscopy (DRS).4 22 23 24 25 26 27 28 29 30 31 32 33 34 35 36 37 38 39 40 41 42 Apparent concentrations of melanin, oxy-Hb, and deoxy-Hb can be extracted from absorption spectra obtained by DRS, thus separating the vascular from the melanin reactions that are responsible for erythema and pigment. DRS measurements are rapid, noninvasive, objective, and quantitative. Instruments that perform DRS can be small, portable, and easy to use. In this study we report on a number of skin reactions in which the vascular component of skin color cannot be visually separated from the melanin pigment component. Of the available methods, only spectroscopy provides the means to identify the involvement of each chromophore. In the selected examples of skin reactions presented here spectroscopically confirmed blood stasis can visually be confused with melanin pigmentation. 2.Methods2.1.Clinical StudiesTwelve healthy individuals with skin phototypes III–IV participated in the study after signing an informed consent form. The study was approved by an internal review board. The source of irradiation was a 150 W UVC-filtered xenon arc solar simulator. The instrument was calibrated right before its use and the total power of the source was recorded every 3–4 h throughout the day to assure its stability and spectral quality following Colipa (The European Cosmetic, Toiletry, and Perfumery Association) guidelines. Initially the minimum solar simulator radiation (SSR) dose to induce perceptible erythema (MED) was determined on the back of each participant. Clinical erythema was evaluated 24 h after the irradiation. Following MED determination each individual was irradiated on the back with SSR doses of 0.7, 1.0, 1.5, 2.1, and 3 MED. The skin reactions were evaluated on days 1, 7, 14, and 21 after exposure. Evaluations included cross-polarized photography, DRS measurements, and clinical assessment of erythema and pigmentation by an experienced dermatologist. In a second experiment, a pressure cuff was applied to the upper arm of ten healthy volunteers. The applied pressure was set at levels of 0, 20, 30, 40, and 60 mm Hg. Measurements were taken 5 min after each pressure level was set to allow for the vasculature to equilibrate. Changes in skin color due to vascular reactions were evaluated visually, with a chromameter, and with a DRS instrument. In a third experiment, 2 in. diameter cotton pads soaked in 3 H 2 O 2 (U.S.P. topical anti-infective) in aqueous solution were applied on the volar forearm of ten healthy volunteers for 1 min. The pads were removed and the skin area was dried with fresh cotton pads. DRS measurements and visible evaluation of the treated sites were performed at 0, 5, 10, 15, and 20 min after removal of the pads. 2.2.DRSThe DRS instrument consisted of a quartz halogen light source (Ocean Optics, Boca Raton, FL), a bifurcated fiber bundle (Multimode Fiber Optics, East Hanover, NJ), an S2000 spectrometer (Ocean Optics, Boca Raton, FL), and a laptop computer (Toshiba Tecra, Irvine, CA). One leg of the fiber bundle was connected to the light source and the other to the spectrometer. Measurements were performed by placing the common end of the fiber bundle gently in contact with skin so as not to perturb the blood content. A reflectance spectrum was acquired in the range of 400–820 nm. Apparent concentrations of hemoglobin and melanin were calculated from the diffuse reflectance spectra as described elsewhere.31 Briefly, the absorbance curve was calculated as the logarithm of the ratio of the diffuse reflectance from a nonirradiated site to the diffuse reflectance from an irradiated site. Pigment was evaluated from the absorbance curve as the slope of the fitted straight line over the wavelength range of 620–720 nm. Then the curve was corrected for the pigment absorption and finally, the oxy-Hb and deoxy-Hb absorption curves were fitted in the range of 550–580 nm, where they exhibit maxima (Table 1). The reproducibility of the method for calculating apparent hemoglobin concentrations was calculated as the error between measurements and was found to be better than 10. It needs to be noted that for the collection geometry used here an underestimation of the reflectance at the long wavelengths (red/near-infrared region) compared to the shorter wavelengths (blue/green region) is anticipated. However, the measurements were always preformed relative to base line or to neighboring untreated skin and therefore such artifacts have been normalized. Table 1
3.Results3.1.Ultraviolet Irradiation ExperimentUltraviolet (UV)-induced erythema is typically evaluated on day 1 after irradiation, while pigmentation is evaluated on day 7. Figure 2 shows a typical skin reaction on the back of a volunteer on days 1 and 7. The time course of changes in the concentration of oxy-Hb, deoxy-Hb, and melanin are shown in Fig. 3. On day 1 after irradiation the observed skin reaction was classified as clinical erythema [Fig. 2(a)]. The visual observation of erythema correlated well with a dramatic increase in oxy-Hb and deoxy-Hb, as calculated from the spectroscopic data [Figs. 3(a) and 3(b)]. The observed skin reaction on day 7 was classified clinically as pigmentation [Fig. 2(b)], which correlated with an increase in melanin [Fig. 3(c)]. However, the levels of both hemoglobins were significant on day 7 indicating that there is a strong vascular contribution to the observed reaction [Figs. 3(a) and 3(b)]. On day 14 the reaction was again classified as pigmentation and although the melanin levels remained elevated, the concentration of deoxy-Hb was still above base line [Fig. 3(b)]. On day 21 the observed pigmentation was almost exclusively due to melanin [Fig. 3(c)]. Note that although deoxy-Hb is still measurably above base line its contribution at 0.1 level is not visibly perceptible. Figure 2Solar simulated UV exposure induces visible erythema on day 1 and pigmentation on day 7. The photos were taken from the back of an individual on (a) day 1 and (b) day 7 after irradiation. The doses from left to right were: (i) 0.7, (ii) 1.0, (iii) 1.5, (iv) 2.1, and (v) 3.0 MED. Erythema is prominent on day 1, while on day 7 the reaction was classified as pigmentation.  Figure 3Erythema on day 1 after solar simulated exposure is accompanied by oxy- and deoxy-hemoglobin increase, whereas the observed pigment on day 7 and 14 is the combination of both melanin and deoxy-hemoglobin absorption. Shown here are the concentration changes from baseline and at different time-points of: (a) oxy-hemoglobin, (b) deoxy-hemoglobin, and (c) melanin. The data represent the average calculated values from 20 individuals who received SSR doses of 0.7, 1.0, 1.5, 2.1, and 3.0 MED on day 0. All values presented were referenced to base line (day 0).  3.2.Pressure Cuff ExperimentIn the pressure cuff experiment increasing pressure resulted in a reduction of the values of L* and b* as measured by the chromameter corresponding to darker and less yellow color, respectively (Fig. 4). On the contrary the value of a* increased corresponding to a more red appearance. Although the color changes were recorded with the chromameter it is of interest to note that visually the change in skin color was hard to observe. The reason is that the human eye works better in contrast and since the pressure was applied on the whole of the arm the color change was uniform and therefore difficult to detect. DRS analysis showed that the only chromophore that was affected by changing the applied pressure was deoxy-Hb, which increased linearly with pressure (Fig. 5). Oxy-Hb and melanin remained practically unaltered. The characteristic angle, α=arctan[(L*−50)/b*], is a measure of the perceived pigmentation in such a way that when apparent pigmentation increases this parameter decreases.13 41 43 44 In the present experiment the characteristic angle decreased with increasing pressure in all volunteers, indicating that pressure-induced increases in blood stasis can be perceived as increased pigmentation (Fig. 6). Figure 4Light pressure-induced blood stasis is accompanied by skin color darkening and slight increase in the blue and the red components. Changes in the chromaticity values L*a*b* of volar forearm skin were measured after application of various amounts of pressure using a pressure cuff on the upper arm. Data represent average values ± one standard deviation acquired from ten people. Decreases in L* represent darkening of the skin color. Decreases in b* represent more blue and less yellow color. Increases in a* correspond to more red and less green color. The slopes of the fitted lines are −0.107, 0.025, and −0.059 for L*, a*, and b* respectively. 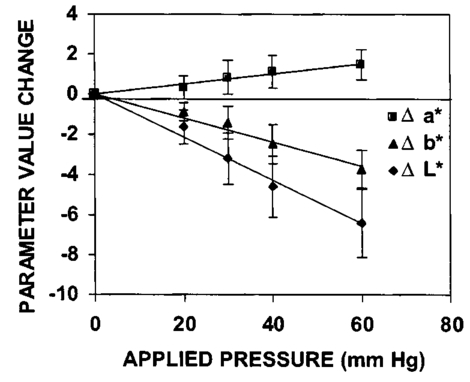 Figure 5Light pressure-induced blood stasis is accompanied by a linear increase in deoxy-hemoglobin alone. Changes in the skin chromophore values of the volar forearm were measured after application of various amounts of pressure using a pressure cuff on the upper arm. Deoxy-hemoglobin increases linearly with the applied pressure. The slope of the fitted line is 0.016. Subdiastolic levels of applied pressure do not affect oxy-hemoglobin, melanin, and dermal scattering. Data represent average base line-subtracted values ± one standard deviation acquired from ten people. 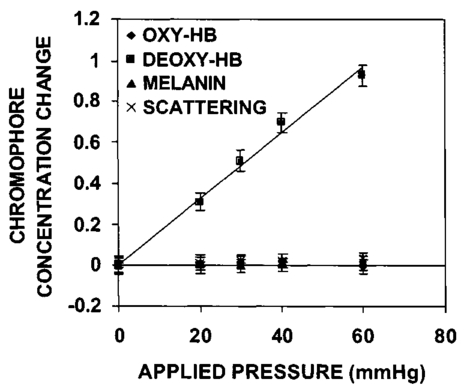 Figure 6The characteristic angle α=arctan[(L*−50)/b*], a measure of the perception of “skin pigmentation,” depends on deoxy-hemoglobin concentration in a similar fashion to its dependence on melanin. Pressure-induced changes in deoxy-hemoglobin are plotted as a function of the changes of the characteristic angle α. Higher concentrations of deoxy-hemoglobin correspond to lower values of the characteristic angle, which represent perception of a more pigmented appearance. The fitted line is given by the equation y=−0.065x+3.673.  3.3.Hydrogen Peroxide ExperimentApplication of cotton pads soaked in 3 hydrogen peroxide for 1 min induced a decrease in perceptible skin pigmentation (Fig. 7) that lasted for 10–15 min after removal of the pads. Analysis of DRS spectra showed that deoxy-Hb significantly decreased during the period of blanching (Fig. 8). Oxy-Hb decreased slightly, but within instrument variability (determined to be ±0.1 oxy-Hb units). Melanin and dermal scattering remained unchanged at base line levels. Figure 7Topical application of 3 H 2 O 2 results in skin blanching reaction. Cotton pads soaked in 3 H 2 O 2 aqueous solution were applied for 1 min on the volar forearm. The photo was taken 2 min after removing of the soaked pads and drying the skin with fresh dry pads. Blanching with clear boundaries is evident where H 2 O 2 has been applied. 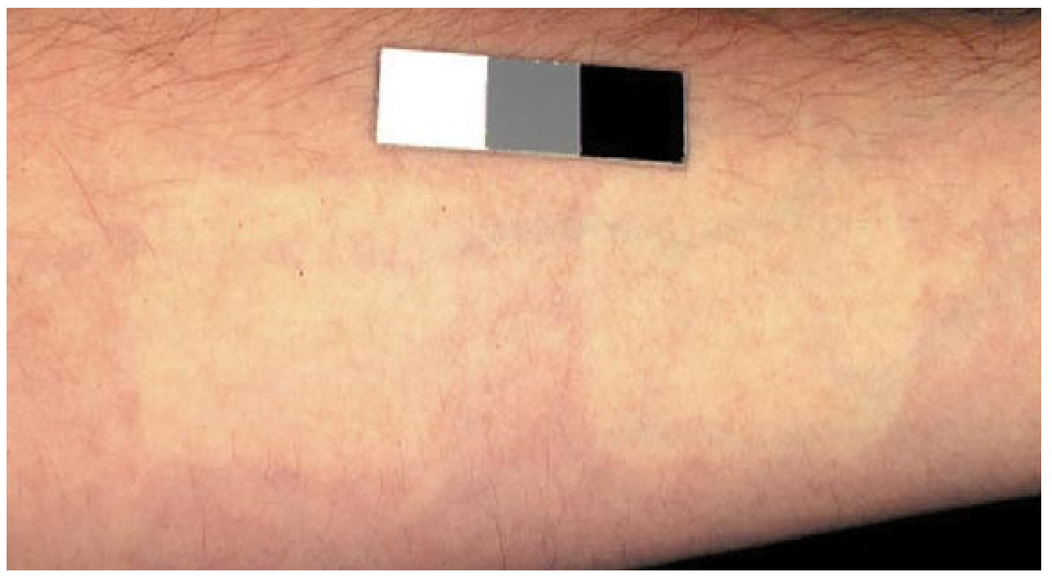 Figure 8Topical application of 3 H 2 O 2 reduces blood stasis as evidenced by reduction in deoxy-hemoglobin levels. Changes in skin chromophore concentrations are plotted over time. Data represent average values ± one standard deviation acquired from ten people. Deoxy-hemoglobin values decreased with a minimum around 3 min and remain significantly lower than baseline until 15 min after H 2 O 2 application. Oxy-hemoglobin decreased slightly. Melanin and dermal scattering were not significantly affected. 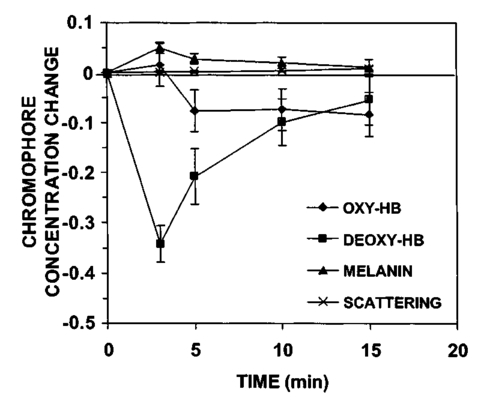 4.DiscussionMelanin pigmentation is the brown-black pigment that contributes to the appearance of the skin. Melanin is produced in epidermal melanocytes in specialized vesicles called melanosomes, which are then transferred to the keratinocytes. Skin darkening is believed to be due to the distribution of melanin in the epidermis. In this study we have conducted several experiments that point out to the fact that the perceived skin darkening does not depend only on the concentration of melanin, but it is strongly affected by the concentration of deoxy-Hb in the superficial venous plexus. We have identified a number of cases where blood pooling (stasis) and specifically the pooling of deoxy-Hb causes the appearance of the skin to get darker. As an example we determined that following solar simulated UV exposure at superthreshold levels local concentrations of deoxy-Hb confuse the assessment of melanin pigmentation at times greater than 7 days after exposure. Blood pooling contributes to the “tanned” skin appearance even 2 weeks after SSR exposure. The pooling response remains dose dependent. Increases in blood stasis (“blood pooling”) by application of a pressure cuff on the arm increases the “pigmented” appearance of the skin, as measured using a chromameter. It should be noted here that the L*a*b* scale provided by the chromameter measures color as perceived by the human eye (termed also psychophotometric). Furthermore, decreases in blood stasis induced after application of hydrogen peroxide appears as pigment reduction or pigment “bleaching.” We have determined that the concentration of deoxy-Hb in the skin may be varied independently from the concentration of oxy-Hb by applying topically hydrogen peroxide, this phenomenon lasts 10–20 minutes.44 45 It is believed that the venules contract following the application of hydrogen peroxide. Hydrogen peroxide probably interacts with the NO receptors causing the endothelial cells to contract. The reason why the arterioles are not affected may be attributed to the stronger arteriolar wall integrity that is supported by the smooth muscle layer. An alternate mechanism would be to stimulate an enlargement of the collagen matrix or of the water holding capacity of the dermal glycosaminoglycans that surround the dermal venules. As the tissue expands it compresses the venules resulting in a partial vascular collapse. This collapse of the superficial venules results in a reduction of the average concentration of deoxy-Hb in the skin which in turn results in a lightening of the skin. The observation that what is perceived as UV-induced pigmentation may contain a vascular component agrees with recently published reports.46 Conversely, pigmentation contributes to perceived skin redness as measured by the a* parameter.21 47 Such observations emphasize the need for a more reliable method than the L*a*b* values for quantifying erythema in the presence of pigmentation. Diffuse reflectance spectroscopy and analysis is the only available method to assess erythema and pigmentation independently through the calculation of hemoglobin and melanin concentrations.26 31 48 The main reason why deoxy-Hb contributes to a pigmented skin appearance is that the absorption spectrum of deoxy-Hb in the 630–700 nm range is very similar to the absorption spectrum of epidermal melanin, so whatever light is transmitted has the color balance of pigment (Fig. 9). Furthermore, the size of the vessels in the superficial venous plexus is such that the transmitted radiation through these vessels is approximately 50 lower than the incident intensity and therefore they appear dark. Moreover, deoxy-Hb is a dominant pigment in normal skin contributing 30–50 to the perceived concentration of blood and equal in its contribution to that of oxy-Hb and melanin to skin color. Figure 9Deoxy-hemoglobin (×) absorbs light in a similar manner to melanin (+) in the spectral region 630–700 nm. The deoxy-hemoglobin curve was measured from a cuvette filled with lysed red blood cells under gentle nitrogen bubbling to reduce oxy-hemoglobin (see Ref. 4). The melanin curve was measured from a vitiligo patient and represents the absorbance of normally melanized skin referenced to neighboring vitiligo-involved skin (see Ref. 4). The fitted curves are given by the equations (where λ is the wavelength in nm): (a) melanin absorbance=e15−0.009 λ with R2=0.9962 and (b) deoxy-hemoglobin absorbance=e18−0.015 λ with R2=0.9998.  We conclude therefore that the dark appearance of the skin is not only due to melanin pigment but in many cases also due to deoxy-Hb. This can be verified by pressing down on the skin surface using a glass slide, a technique termed “diascopy.” This procedure compresses the vessels and drains them temporarily making it possible to visualize the contribution of deoxy-Hb to skin color. Because epidermal melanin and deoxy-Hb play at times equal roles in the pigment reactions of the skin we have developed instrumentation to distinguish between these two pigments. The instrument consists of a diffuse reflectance spectrometer fitted with optical fibers in order to enable measurement of any skin site. Algorithms have been developed to analyze the spectra obtained for deoxy-Hb and for melanin. In one approach we have showed that the diffuse reflectance spectra may be fitted using the diffusion approximation to account for scattering and with linear combinations of the absorption spectra of individual chromophores.40 This approach while adequate does not fit the obtained spectra perfectly. The preferred approach is to fit the spectrum in sections within a narrow spectral band in order to minimize the effects of variations due to scattering in the dermis. The results presented in this report provide strong evidence that mixed vascular and pigment reactions cannot be visually separated. Furthermore, blood stasis alone can be confused with pigmentation. In both of these situations diffuse reflectance spectroscopy provides the only means for identification of the relative involvement of each chromophore. AcknowledgmentsThe authors would like to acknowledge Dr. Jeff Wu of Johnson & Johnson and Dr. Kays Kaidbey of KGL IVY labs (Philadelphia, PA) for their help in conducting the UV irradiation experiments. REFERENCES
M. Rajadhyaksha
,
M. Grossman
,
D. Esterowitz
,
R. H. Webb
, and
R. R. Anderson
,
“In vivo confocal scanning laser microscopy of human skin: melanin provides strong contrast,”
J. Invest. Dermatol. , 104 946
–952
(1995). Google Scholar
N. Kollias
,
R. M. Sayre
,
L. Zeise
, and
M. R. Chedekel
,
“Photoprotection by melanin,”
J. Photochem. Photobiol., B , 9 135
–160
(1991). Google Scholar
R. R. Anderson
and
J. A. Parrish
,
“The optics of human skin,”
J. Invest. Dermatol. , 77 13
–19
(1981). Google Scholar
N. Kollias
,
“The physical basis of skin color and its evaluation,”
Clin. Dermatol. , 13 361
–367
(1995). Google Scholar
L. A. Brunsting
and
C. Sheard
,
“The color of the skin as analyzed by spectrophotometric methods II. The role of pigmentation,”
J. Clin. Invest. , 7 575
–592
(1929). Google Scholar
L. A. Brunsting
and
C. Sheard
,
“The color of the skin as analyzed by spectrophotometric methods III. The role of superficial blood,”
J. Clin. Invest. , 7 575
–592
(1929). Google Scholar
E. A. Edwards
and
S. Q. Duntley
,
“The pigments and color of human skin,”
Am. J. Anat. , 65 1
–33
(1939). Google Scholar
E. A. Edwards
,
N. A. Finklestein
, and
S. Q. Duntley
,
“Spectrophotometry of living human skin in the ultraviolet range,”
J. Invest. Dermatol. , 16 311
–321
(1950). Google Scholar
P. M. Farr
and
B. L. Diffey
,
“Quantitative studies on cutaneous erythema induced by ultraviolet radiation,”
Br. J. Dermatol. , 111 673
–682
(1984). Google Scholar
H. Takiwaki
and
J. Serup
,
“Measurement of color parameters of psoriatic plaques by narrow-band reflectance spectrophotometry and tristimulus colorimetry,”
Skin Pharmacol. , 7 145
–150
(1994). Google Scholar
H. Takiwaki
,
L. Overgaard
, and
J. Serup
,
“Comparison of narrow-band reflectance spectrophotometric and tristimulus colorimetric measurements of skin color,”
Skin Pharmacol. , 7 217
–225
(1994). Google Scholar
B. L. Diffey
,
R. J. Oliver
, and
P. M. Farr
,
“A portable instrument for quantifying erythema induced by ultraviolet radiation,”
Br. J. Dermatol. , 111 663
–672
(1984). Google Scholar
S. B. Park
,
D. H. Suh
, and
J. I. Youn
,
“A long-term time course of colorimetric evaluation of ultraviolet light-induced skin reactions,”
Clin. Exp. Dermatol. , 24 315
–320
(1999). Google Scholar
M. J. Waring
,
L. Monger
,
D. A. Hollingsbee
,
G. P. Martin
, and
C. Marriott
,
“Assessment of corticosteroid-induced skin blancing: evaluation of the Minolta Chromameter CR200,”
Int. J. Pharm. , 94 211
–222
(1993). Google Scholar
A. Fullerton
,
T. Fischer
,
A. Lahti
,
K. P. Wilhelm
,
H. Takiwaki
, and
J. Serup
,
“Guidelines for measurement of skin colour and erythema,”
Contact Dermatitis , 35 1
–10
(1996). Google Scholar
W. Westerhof
,
B. A. A. M. van Hasselt
, and
A. Kammeijer
,
“Quantification of UV-induced erythema with a portable computer controlled chromameter,”
Photodermatol , 3 310
–314
(1986). Google Scholar
J. Serup
and
T. Agner
,
“Colorimetric quantification of erythema—a comparison of two colorimeters with a clinical scoring scheme and laser-Doppler flowmetry,”
Clin. Exp. Dermatol. , 15 267
–272
(1990). Google Scholar
J. C. Seitz
and
C. G. Whitmore
,
“Measurement of erythema and tanning responses in human skin using a tri-stimulus colorimeter,”
Dermatologica , 177 70
–75
(1988). Google Scholar
P. Clarys
,
K. Alewaeters
,
R. Lambrecht
, and
A. O. Barel
,
“Skin color measurements: comparison between three instruments: the Chromameter, the DermaSpectrometer and the Mexameter,”
Skin Res. Technol. , 6 230
–238
(2000). Google Scholar
J. K. Wagner
,
C. Jovel
,
H. L. Norton
,
E. J. Parra
, and
M. D. Shriver
,
“Comparing quantitative measurements of erythema, pigmentation and skin response using reflectometry,”
Pigment Cell Res. , 15 379
–384
(2002). Google Scholar
H. Takiwaki
,
Y. Miyaoka
,
H. Kohno
, and
S. Arase
,
“Graphic analysis of the relationship between skin colour change and variations in the amounts of melanin and haemoglobin,”
Skin Res. Technol. , 8 78
–83
(2002). Google Scholar
P. Bjerring
and
P. H. Andersen
,
“Skin reflectance spectrophotometry,”
Photodermatol , 4 167
–171
(1987). Google Scholar
P. H. Andersen
and
P. Bjerring
,
“Noninvasive computerized analysis of skin chromophores in vivo by reflectance spectroscopy,”
Photodermatol. Photoimmunol. Photomed. , 7 249
–257
(1990). Google Scholar
P. H. Andersen
and
P. Bjerring
,
“Spectral reflectance of human skin in vivo,”
Photodermatol. Photoimmunol. Photomed. , 7 5
–12
(1990). Google Scholar
P. H. Andersen
,
“Reflectance spectroscopic analysis of selected experimental dermatological models with emphasis on cutaneous vascular reactions,”
Skin Res. Technol. , 3 3
–58
(1997). Google Scholar
M. G. Sowa
,
A. Matas
,
B. J. Schattka
, and
H. H. Mantch
,
“Spectroscopic assessment of cutaneous hemodynamics in the presence of high epidermal melanin concentration,”
Clin. Chim. Acta , 317 203
–212
(1969). Google Scholar
N. Kollias
and
A. Baqer
,
“An experimental study of the changes in pigmentation in human skin in vivo with visible and near infrared light,”
Photochem. Photobiol. , 39 651
–659
(1984). Google Scholar
N. Kollias
and
A. Baqer
,
“Spectroscopic characteristics of human melanin in vivo,”
J. Invest. Dermatol. , 85 38
–42
(1985). Google Scholar
N. Kollias
and
A. Baqer
,
“On the assessment of melanin in human skin in vivo,”
Photochem. Photobiol. , 43 49
–54
(1986). Google Scholar
N. Kollias
and
A. H. Baqer
,
“Absorption mechanisms of human melanin in the visible, 400–720 nm,”
J. Invest. Dermatol. , 89 384
–388
(1987). Google Scholar
N. Kollias
and
A. H. Baqer
,
“Quantitative assessment of UV-induced pigmentation and erythema,”
Photodermatol , 5 53
–60
(1988). Google Scholar
N. Kollias
,
A. Baqer
,
I. Sadiq
, and
R. M. Sayre
,
“In vitro and in vivo ultraviolet-induced alterations of oxy- and deoxyhemoglobin,”
Photochem. Photobiol. , 56 223
–227
(1992). Google Scholar
N. Kollias
,
A. Baqer
, and
I. Sadiq
,
“Minimum erythema dose determination in individuals of skin type V and VI with diffuse reflectance spectroscopy,”
Photodermatol. Photoimmunol. Photomed. , 10 249
–254
(1994). Google Scholar
N. Kollias
,
R. Gillies
,
J. A. Muccini
,
R. K. Uyeyama
,
S. B. Phillips
, and
L. A. Drake
,
“A single parameter, oxygenated hemoglobin, can be used to quantify experimental irritant-induced inflammation,”
J. Invest. Dermatol. , 104 421
–424
(1995). Google Scholar
N. Kollias
,
Y. H. Malallah
,
H. al-Ajmi
,
A. Baqer
,
B. E. Johnson
, and
S. Gonzalez
,
“Erythema and melanogenesis action spectra in heavily pigmented individuals as compared to fair-skinned Caucasians,”
Photodermatol. Photoimmunol. Photomed. , 12 183
–188
(1996). Google Scholar
N. Kollias
,
R. Gillies
,
J. A. Muccini
,
S. B. Phillips
, and
L. A. Drake
,
“Oxyhemoglobin is a quantifiable measure of experimentally induced chronic tretinoin inflammation and accommodation in photodamaged skin,”
Skin Pharmacol. , 10 97
–104
(1997). Google Scholar
N. Kollias
and
J. L. Bykowski
,
“Immediate pigment darkening thresholds of human skin to monochromatic (362 nm) ultraviolet A radiation are fluence rate dependent,”
Photodermatol. Photoimmunol. Photomed. , 15 175
–178
(1999). Google Scholar
N. Kollias
,
G. N. Stamatas
, and
J. I. Youn
,
“Suppression of UVB-induced cutaneous erythema by a previous UVB exposure,”
Photochem. Photobiol. , 74 471
–476
(2001). Google Scholar
R. Gillies, W. D. Tian, R. R. Anderson, L. A. Drake, and N. Kollias, “Noninvasive monitoring of treatment related changes in psoriatic plaques using fluorescence excitation and diffuse reflectance spectroscopy,” in Trends in Optics and Photonics: Biomedical Optical Spectroscopy and Diagnosis, E. M. Sevick-Muraca, J. A. Izatt, and M. N. Edinger, Eds., pp. 113–115, Optical Society of America, Washington, DC (1998).
G. Zonios
,
J. Bykowski
, and
N. Kollias
,
“Skin melanin, hemoglobin, and light scattering properties can be quantitatively assessed in vivo using diffuse reflectance spectroscopy,”
J. Invest. Dermatol. , 117 1452
–1457
(2001). Google Scholar
J. B. Dawson
,
D. J. Barker
,
D. J. Ellis
,
E. Grassam
,
J. A. Cotterill
,
G. W. Fisher
, and
J. W. Feather
,
“A theoretical and experimental study of light absorption and scattering by in vivo skin,”
Phys. Med. Biol. , 25 695
–709
(1980). Google Scholar
S. B. Park
,
C. H. Huh
,
Y. B. Choe
, and
J. I. Youn
,
“Time course of ultraviolet-induced skin reactions evaluated by two different reflectance spectrophotometers: DermaSpectrophotometer and Minolta spectrophotometer CM-2002,”
Photodermatol. Photoimmunol. Photomed. , 18 23
–28
(2002). Google Scholar
A. Chardon
,
I. Cretois
, and
C. Hourseau
,
“Skin color typology and suntanning pathways,”
Int. J. Cosmet. Sci. , 13 191
–208
(1991). Google Scholar
E. Tegner
,
“Induction of skin blanching by hydrogen peroxide,”
Acta Derm Venereol , 74 474
–475
(1994). Google Scholar
D. K. Goette
,
“Hydrogen peroxide-induced skin blanching,”
Arch. Dermatol. , 112 1788
–1789
(1976). Google Scholar
J. K. Wagner
,
E. J. Parra
,
H. L. Norton
,
C. Jovel
, and
M. D. Shriver
,
“Skin responses to ultraviolet radiation: effects of constitutive pigmentation, sex, and ancestry,”
Pigment Cell Res. , 15 385
–390
(2002). Google Scholar
S. Alaluf
,
D. Atkins
,
K. Barrett
,
M. Blount
,
N. Carter
, and
A. Heath
,
“The impact of epidermal melanin on objective measurements of human skin color,”
Pigment Cell Res. , 15 119
–126
(2002). Google Scholar
M. Ferguson-Pell
and
S. Hagisawa
,
“An empirical technique to compensate for melanin when monitoring skin microcirculation using reflectance spectrophotometry,”
Med. Eng. Phys. , 17 104
–110
(1995). Google Scholar
|
||||||||||


CITATIONS
Cited by 83 scholarly publications and 11 patents.
Skin
Blood
Absorption
Chromophores
Diffuse reflectance spectroscopy
Visualization
Scattering


