|
|
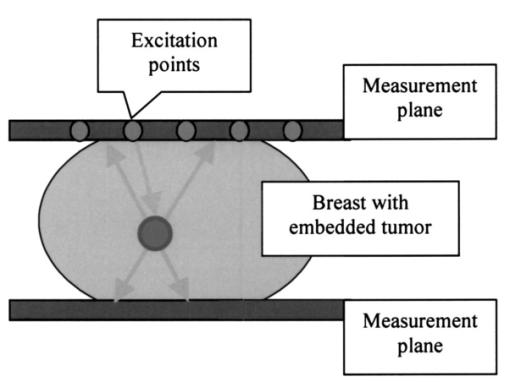
1.IntroductionBreast cancer is the most frequent cancer in women in industrialized countries. More than 200,000 new cases were expected in the United States in 2003.1 In the process of diagnosis in the United States 1.2 million women a year undergo biopsies, with between 75 and 80 of those tests proving benign.2 This means that just in the United States about 900,000 biopsies are unnecessary each year. Therefore, the reduction of such biopsies is an urgent need. It would increase patient comfort and decrease costs. The number of unnecessary biopsies could be reduced by decreasing the number of equivocal findings of x-ray mammography through enhanced sensitivity and specificity. A possible way to achieve this goal is to combine the actual gold standard method in mammography, x-ray mammography, with alternative diagnostic procedures. Optical mammography could be such an adjunct method. It started in the 1920s when Cutler transilluminated a female breast with visible light in a darkened room.3 Today, near-infrared (NIR) light in the wavelength range between 650 and 1200 nm is used, since it penetrates biological tissue several centimeters. Further advantages of NIR optical imaging are the possible differentiation of soft tissues owing to their different absorption or scatter at NIR wavelengths, and its ability to yield functional information. This is related to the specific absorption of NIR light by natural chromophores as a result of changes in blood oxygenation.4 Based on these physical properties, NIR devices have been developed and are available as products.5 6 The clinical use of NIR breast scanners, which were developed in the 1990s, has been limited. Specificity was too low,7 which means that too many women with benign tissue alterations had been sent for a diagnostic workup. Interest in optical mammography has increased again with the advent of fluorescent contrast agents.8 9 Recently tumor-specific contrast agents (so-called smart contrast agents) have been reported.8 These agents consist of self-quenched fluorophore dyes (e.g., Cy5.5) mounted on larger molecules (backbones) via specific peptides. These peptides are recognized and cleaved by specific proteases (e.g., those expressed in tumors), thus releasing the fluorophores, which are now unquenched and free to fluoresce in the NIR wavelength range when activated with light at the excitation range of the fluorophore used. The possible adjunctive use of NIR fluorescence imaging for detecting breast cancer requires the fusion of geometric information about lesions from NIR measurements with morphological images from other modalities. This data fusion is facilitated by using an NIR mammographylike measurement device. It is described in Sec. 2 of this paper. A mathematical method to obtain geometric information from NIR data is the reconstruction of three-dimensional fluorescence distributions from data measured at the body’s surface.10 11 12 In the literature, various reconstruction methods have been reported. However, these algorithms, especially iterative ones, are often very time-consuming. To avoid these time-consuming reconstructions, we investigated the extraction of geometric information about fluorophore-tagged focal breast lesions from NIR surface data by means of a localization algorithm, namely, the recently presented space-space multiple signal classification (MUSIC) algorithm.13 MUSIC was originally invented for the analysis of space-time data in radar technology.14 Meanwhile it has been successfully transferred to analyze space-time data in biomagnetism15 16 17 and functional magnetic resonance,18 and space-frequency data in electrical imaging of the breast.20 The MUSIC method requires a data model for the “interpretation” of the measured data. This model has to describe the geometric and physical properties of signal generators and the volume containing these generators. In our NIR optical application, the signal generators are focal fluorescence spots, i.e., fluorophore-tagged malignant lesions, at different positions below a measurement array at the body region’s surface. They give rise to different signal behavior owing to different distances of exciting laser sources from the fluorescence spots in the medium. This different signal behavior is mathematically required in order that multiple spots can be localized with the MUSIC algorithm. To obtain a patient-independent model geometry, the breast containing the spots is viewed as an unbounded optical medium. The signal generators have been simulated as pointlike spots. In reality, the spots are spatially extended. The geometric shape of spots can in general be incorporated by a multipole expansion of an agglomeration of elemental pointlike spots. Such an incorporation of the shape of signal generators has been shown to be successful in electrical diagnosis of the breast.20 In principle, MUSIC also allows us to calculate the strength of the signal generators in a second step. This is, however, beyond the scope of this paper. The term “space-space” MUSIC is chosen since the data are measured at different surface positions, owing to different positions of the excitation lasers. The details of our MUSIC algorithm are described in Sec. 3. The results from simulated data that are presented in Sec. 4 are discussed in Sec. 5. The paper ends with conclusions and an outlook on further work in Sec. 6. 2.Measurement GeometryThe measurement system that should allow us to record spatially distributed surface data that are due to different laser source positions is a mammographylike device. It is assumed to have two measurement planes between which the breast is fixed and compressed. One of the planes contains laser excitations that activate the fluorescence of the fluorophore-marked tumor from different positions. This approach allows us to construct a rather inexpensive device for which no special optical coupling is needed. In addition, the images of the fluorescent spots can be merged directly with the corresponding x-ray mammography images. Figure 1 shows the geometric setup of optical measurement sensors and excitation lasers for a potential optical mammography device. These could also be integrated into the compression plates of an x-ray mammography system. 3.Space-Space MUSICThe problem to be solved is the 3-D localization of fluorescence spots in biological tissue. The mathematical structure of the localization problem is the same as that in estimating the direction of arrival of wavefronts impinging on a sensor array in radar measurements,14 or in estimating the three-dimensional positions of focal brain activities in magnetoencephalographic measurements,15 16 17 or estimating the three-dimensional positions of electrically polarized focal lesions in bioimmittance measurements.20 In these applications, either space-time or space-frequency data are recorded with a sensor array at different time instants or at different excitation frequencies, respectively. Data of these types allow derivation of a signal subspace of the respective data space. At each point within the volume of interest, a distance measure between the signal subspace and the application-specific model subspace is calculated. The locations of minimum distances give rise to peaks in a cost function that are identified as positions of the signal generators. It is straightforward to transfer this localization method to NIR data from a sensor array. Instead of time or frequency, the second physical data parameter is assumed to be the position of the laser source that excites the fluorophore-tagged lesions. 3.1.The Optical ModelThe optical application-specific model subspace mentioned earlier should be derived from a model, which should be as patient independent, i.e., parameter independent, as possible. This would reduce the need to adapt this model underlying the localization algorithm to any newly measured patient data. Therefore, the propagation of light in biological tissue is considered as a diffusion process in an unbounded, optically homogeneous turbid medium. The temporal and the spatial behavior of the photon density u(t,r) are described by a diffusion equation, which for the present application is a good approximation to the Boltzmann transport equation:4 19 where is the diffusion coefficient, with μa being the absorption coefficient of the medium and μs, μs ′ the scattering and the reduced scattering coefficients, respectively. The speed of light in the medium is denoted by c; Δ is the Laplace operator; and q(t,r) denotes the light source. For a point source at position r f, which has a unit of strength varying sinussoidally with frequency ω, the solution of Eq. (1) is its Green’s function: In the simulation study presented below, continuous-wave (cw) illumination, i.e., zero-frequency (ω=0) irradiation, has been assumed. In this case, Eq. (2) simplifies easily. The light intensity L(r m,r f) measured at the sensor locations r m (m=1,…,M=Mu+Ml) on either of the two measurement arrays (Mu, number of sensors on the upper plate; Ml, number of sensors on the lower plate), is given by4 19 where n(r m) denotes the normal vector of the sensor at the location indicated. With Eq. (2) we consider the fluorescing spots as the signal generators that are to be localized. Therefore we can neglect the excitation of the spots. The results shown later support this assumption. Of course, we are aware of the fact that the fluorescence process consists of light propagation from a pointlike excitation source at position r k to a fluorescent spot with its center of gravity located at r f, reemitting light that is detected by a sensor located at r m. This process is modeled as the product of two diffusion processes.The ensemble of intensities in Eq. (3) represent two spatial intensity distributions associated with the upper and the lower array. The total number of intensities measured at the M positions r m (m=1,…,M) that are due to a pointlike source at location r f allow defining a data vector L in an M-dimensional data space. This data vector is given by In this first attempt to analyze NIR breast data with a MUSIC algorithm, we viewed the fluorescence spot as an isotropic pointlike light source. Its position at r f is identified with the center of gravity of real spots. The spatial extension of a spot can be incorporated by considering the real spots as a focal distribution of pointlike signal generators. The unknown shape of this distribution can be described by a multipole expansion of this distribution.20 For clinical applications, the initially mentioned unboundedness of the optical medium would be an especially attractive feature, since data could be analyzed without adaptation to the individual breast geometry.3.2.Localization with MUSICSpace-space MUSIC analyzes two-dimensional spatial data, in this case photon intensities Jn(r m), measured at M surface positions r m (m=1,…,M). The fluorophore is assumed to be excited by external light sources (i.e., laser sources) at a series of N positions, r n (n=1,…,N), where these sources are turned on one after the other. The M-dimensional data vectors of photon intensities Jn(r m) thus obtained: are considered as column vectors of an M×N intensity data matrix J: Note that for the MUSIC localization we do not need to know the positions of the excitations (since they are not incorporated in the model). The index n is simply used to denote the different datasets.The signal subspace is obtained from the data by performing a singular-value decomposition (SVD) of J. In tensor notation, the SVD is given by where sk are the singular values, u k are M-dimensional (M-D) and v k are N-D orthonormal singular vectors. The vectors u k depend only on the sensor indices, whereas the vectors v k depend only on the indices denoting the positions of the excitation light sources. The vectors u k can be considered as excitation-independent intensity distributions related to the two measurement arrays. Thus they are regarded as basis maps. To visualize these basis maps, the vectors have to be decomposed into an upper and a lower array part, and then reshaped according to the corresponding sensor array. Thus, two 2-D maps are related to a singular vector u k.The number of numerically significant singular values is related to the spots behaving linearly independent with respect to the excitation positions. This behavior is determined by the different distances between the excitation locations and the spots. The basis maps associated with the numerically significant singular values define the signal subspace. These maps show regular structures that are due to the spots in the medium. The residual basis vectors are determined by noise; they define the so-called orthogonal signal subspace. Figure 2 illustrates this for the simulated measurement geometry explained in Sec. 4.1 and two fluorescent tumors with diameters of 6 mm and both 25 mm deep. Figure 2Measurement data for a (a) specific excitation and (b) a singular-value spectrum for two tumors and the mammography measurement geometry. (c) and (d) The two basis maps of the signal subspace. (e) Map of the first basis vector of the orthogonal signal subspace. For each map, the contribution of the upper measurement plane (left) and the lower one (right) are shown separately. 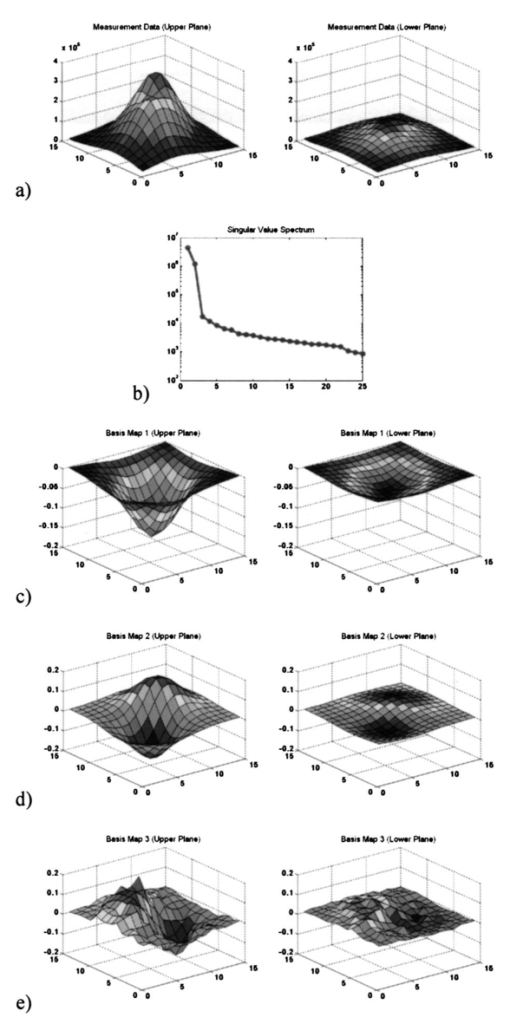 The localization of fluorescent spots, which are modeled as pointlike sources, is done by comparing the model subspace defined by Eq. (4) with the signal subspace for different positions of a model spot. The steps of the search procedure are
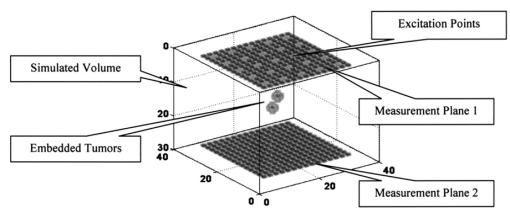
The positions of best fit are interpreted as the centers of gravity of fluorescence spots. Since fluorescence spots give rise to peaks in the intensity distribution measured on the sensor arrays, the search can be restricted to line searches below the peaks of the upper plate, and above the peaks of the lower plate into the respective depth directions, which accelerates the search procedure. At a search point r the localization function F is chosen as where P is the projector onto the orthogonal signal subspace (where S denotes the number of numerically significant singular values), and denotes the normalized basis vector of the 1-D model subspace. The normalization of the model subspace basis vectors compensates for its numerical decrease with increasing depth in order to ensure equal weighting of signal generators from all depths considered.In the presence of spots, and under the assumption that data errors are tolerable in the model, the localization function exhibits local minima. This indicates the maximum or minimum distance between the model and the orthogonal signal subspace, or the signal subspace, respectively. These local minima are associated with the centers of gravity of the fluorescence spots. 4.DataComputer simulations have been carried out to generate data originating from fluorophores in a bounded and optically inhomogeneous medium. This section describes details of the data simulation. 4.1.Simulation ModelThe medium containing fluorescent tagged lesions is assumed to be within a cube of 74×74×56 mm3. Photon diffusion is calculated by numerically solving the stationary fluorescent diffusion equation (see Refs. 10 and 11) using the finite-difference (FD) method. We chose a regular grid of 2 mm in each dimension [giving 37×37×28 cubic (2 mm3) voxels] using a central difference scheme. Robin (or flux) boundary conditions21 at the tissue–air (or tissue–device) interface have been implemented. The optical properties of the medium have been set to μa=0.005/mm for the mean absorption coefficient and μs ′=1.1/mm for the mean reduced scattering coefficient. This choice approximates reasonably well the optical properties of female breast tissue.22 The FD simulations allow us to simulate different levels of optical background inhomogeneity. For this purpose, we let the optical properties oscillate sinusoidally around the mean values. The amplitudes of these oscillations are 50 of the mean values. Figure 3 shows the distribution of the optical properties. For our simulations, we assumed a highly specific contrast agent as described in Ref. 8. Thus, we did not introduce background fluorescence. Figure 3(a) Inhomogeneous absorption and (b) scattering coefficient distributions incorporated in the simulations. 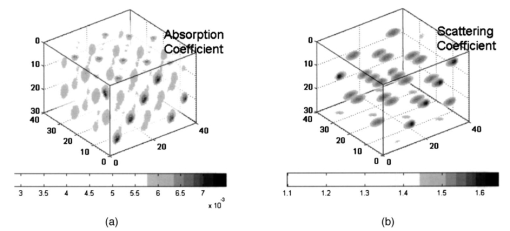 To simulate a breast compressed between two measurement planes, a planar excitation and measurement array was placed centrally on top of a cube and another detection grid was placed at the bottom. These measurement arrays were assumed to be square grids of 15×15 detectors with 4-mm spacing. The excitation array consists of 5×5 light sources with spacings of 12 mm. The areas of the measurement planes were about 6×6 cm2 each. Figure 4 shows the simulated optical medium and the measurement systems, where the two blobs between the measurement planes indicate two fluorescent spots. We further assumed that our excitations are limited to approximately 300 mJ/cm2 by the laser safety laws23 for human applications. Given an input fiber area of 3 mm2 (i.e., 2-mm diameter) we assumed a light power of 40 mW and an illumination time in continuous-wave mode of 0.25 s/fiber. With 25 fibers turned on sequentially, this gave a total illumination time of about 6 s. For real experiments, this time might increase slightly as a result of switching times and other possible delays. 4.2.SimulationsWith the finite-difference model described here, we simulated several datasets from tumors of different sizes and at different depths, all embedded in inhomogeneous optical media as described in Sec. 4.1. Data for a single tumor and two tumors were generated. The fluorophore to be attached with the contrast agent was assumed to be Cy5.5,9 which is a commercial fluorophore excited at 675 nm. For all tumors, we assumed a fluorophore concentration of 100 nM, which is reported to be realistic for human breast application.8 We performed the same simulations as in Ref. 13, that is, we started to test the algorithm with single tumor data. Sixteen configurations were considered with tumor sizes of 2×2×2, 6×6×6, 10×10×10, and 2×2×10 mm3, located at depths of 13, 25, 37, and 49 mm. Data with two tumors (both having 6-mm diameters) were generated for four different depth combinations of the tumors and for two different lateral (x,y) distances between the tumors. Table 1 shows the different values for depths and distances of these eight experiments. Table 1
We restricted our experiments to media with inhomogeneous optical background properties. The data were assumed to be corrupted with Gaussian noise 5.ResultsIn this section we present localization results for the data simulated in Sec. 4. The data model underlying the localization algorithm was described in Sec. 3.1. Again, we would like to stress its simplicity, i.e., its unboundedness and its optical homogeneity via a uniform diffusion parameter in Eq. (3). These properties are especially useful in clinical applications. The mean values of the inhomogeneous background optical properties were assumed to be known by some estimation procedure. Also, localizations where the optical background parameters have been under- or overestimated (90 or 110 of the actual parameters, respectively) have been performed. Figure 5 summarizes the localization results where the frequency of the normalized localization error ε is plotted against the depth of the tumor. For values |ε|⩽1, the location found is within the volume of the spot; otherwise—with respect to its depth position—the tumor is missed.Figure 5Summary of the localization results from 96 configurations: frequency of localization events versus the true depth of the tumor and versus the normalized localization error (see text). 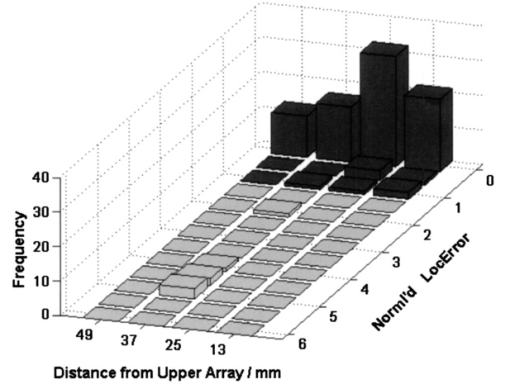 For single tumors, the localization only fails in a single case. A 37-mm deep, 2-mm small tumor was only missed by 2 mm in the case of underestimating the mean optical background properties by 10. In the residual cases, the tumors were localized perfectly well. The normalized localization errors were mostly zero (ε=0). The localizations for the configurations with two tumors only fail if their distances in depth differ too much (e.g., 13 versus 37 mm). In these cases, the tumor that is farther from the plane containing the excitation sources is mislocalized, whereas the tumor closer to the excitation plane is localized correctly. In all other cases (regardless of whether the optical properties were under- or over- or correctly estimated), we got |ε|⩽1, which means that the localization was correct. 6.ConclusionsThe space-space MUSIC method described and tested for a single measurement plane13 was transferred and adapted to the analysis of multisensor optical fluorescence data from a mammographylike measurement geometry, i.e., a system with two measurement planes on top and bottom of the medium under investigation. It has been shown that this application of the MUSIC algorithm has allowed successful localization of simulated fluorescence spots. The effectiveness and the robustness of the algorithm have been demonstrated with the successful localization of spots from simulated noisy data within a bounded and optically inhomogeneous medium. The localization results are, as expected, better than those obtained from data acquired with a “hand-held” single measurement probe.13 The approach presented here for the detection and analysis of fluorescence data has several attractive features. The data model is extremely simple: boundary effects are neglected. The localization results were barely influenced by assumed wrong optical background parameters of the infinite medium. In short, discrepancies between the data model incorporated into the MUSIC algorithm and the data simulation model do not affect the quality of the localization results. Therefore, these results indicate that the proposed space-space MUSIC algorithm is patient independent, which would be extremely useful for clinical applications. Of course, this has to be confirmed in further studies. Another attractive feature of the MUSIC algorithm is that it yields results in real time, i.e., within subseconds. This performance is due to the simplicity of the underlying data model and the evaluation of the cost function along a search path, which has fewer grid points than the entire discretized volume under study. The space-space MUSIC algorithm as presented can still be extended, and the results are expected to become even better. In view of clinical data, a possible improvement would come from the inclusion of the shape and orientation of a spot through higher-order multipole sources.20 The localization of signal generators is only the first of two steps of a MUSIC algorithm. In a second step, the localized positions of the signal generators (i.e., of the spots) can be used to determine their signal strengths (i.e., the amount of fluorescing molecules) by solving a set of linear equations relating these signal strengths at the found positions and the light intensities measured. Another field of activity is an improved estimate of the optical background parameters. Such an estimate could be obtained by analyzing reflectance data while recording fluorescence data. In summary, the localization results presented in this paper indicate that the proposed space-space MUSIC algorithm seems to be a promising method for analyzing NIR fluorescence data. REFERENCES
M. Cutler
,
“Transillumination as an aid in the diagnosis of breast lesions,”
Surg. Gynecol. Obstet. , 48 721
–729
(1929). Google Scholar
S. R. Arridge
,
“Optical tomography in medical imaging,” Topical Review,”
Inverse Probl. , 15 R41
–R93
(1999). Google Scholar
R. Weissleder
and
U. Mahmood
,
“Molecular imaging,”
Radiology , 219 316
–333
(2001). Google Scholar
V. Ntziachristos
and
R. Weissleder
,
“Experimental three-dimensional fluorescence reconstruction of diffuse media by use of a normalized Born approximation,”
Opt. Lett. , 26 893
–895
(2001). Google Scholar
M. A. O’Leary
,
D. A. Boas
,
X. Li
,
B. Chance
, and
A. G. Yodh
,
“Fluorescence lifetime imaging in turbid media,”
Opt. Lett. , 21 158
–160
(1996). Google Scholar
R. Roy
and
E. Sevick-Muraca
,
“A numerical study of gradient-based nonlinear optimization methods for contrast enhanced optical tomography,”
Opt. Express , 9 49
–65
(2001). Google Scholar
B. Scholz
and
M. Pfister
,
“Three-dimensional localization of fluorescence spots with adapted MUSIC algorithm,”
Proc. SPIE , 5138 114
–125
(2003). Google Scholar
J. C. Mosher
,
P. S. Lewis
, and
R. M. Leahy
,
“Multiple dipole modeling and spatio-temporal MEG data,”
IEEE Trans. Biomed. Eng. , 39 541
–557
(1992). Google Scholar
A. Oppelt
,
R. Graumann
, and
B. Scholz
,
“Zur magnetischen Ortung bioelektrischer Quellen, Teil 1: Ortung einzelner und mehrer Stromdipole,”
Z. Med. Phys. , 3 59
–63
(1993). Google Scholar
T. Elbert
,
M. Jungho¨fer
,
B. Scholz
, and
S. Schneider
,
“The separation of overlapping neuromagnetic sources in first and second somatosensory cortices,”
Brain Topography , 7
(4), 275
–282
(1995). Google Scholar
K. Sekihara
and
H. Koizumi
,
“Detecting cortical activities from fMRI time-course data using the MUSIC algorithm with forward and backward covariance averaging,”
Magn. Reson. Med. , 35 807
–813
(1996). Google Scholar
B. Scholz
,
“Toward virtual electrical breast biopsy: space-frequency MUSIC for trans-admittance data,”
IEEE TMI , 21
(6), 588
–595
(2002). Google Scholar
S. R. Arridge
and
M. Schweiger
,
“The finite-element model for the propagation of light in scattering media boundary and source conditions,”
Med. Phys. , 22 1779
–1792
(1995). Google Scholar
|
|||||||||||||||||||||||||

