
|
|
1.IntroductionEach year, an estimated 1,250,000 women are diagnosed with abnormal changes in the cervix referred to as squamous intraepithelial lesions (SIL). These changes can persist, regress, or progress into cervical cancer. The progression to cancer results in about 370,000 new cases of cervical cancer and about 190,000 mortalities worldwide each year.1 The early detection and treatment of precancerous lesions is one of the most effective tools to prevent cervical cancer. The value of early detection has been demonstrated in many settings; current screening programs based on the Papanicoloau smear have decreased cancer mortality substantially.2 3 In the developed world, current screening programs have reduced the incidence of invasive cervical cancer by up to 90.4 However, the current practice of screening is expensive; more than $6 billion are spent annually in the United States detecting and treating low grade SILs. This is prohibitively expensive for the developing world, where cervical cancer is the leading cause of cancer death among women. The sensitivity and specificity of screening using the Papanicoloau are 73 and 63, respectively.5 A patient with an abnormal Papanicoloau smear is referred for colposcopy, where biopsies are taken from suspicious areas of the cervix for histopathologic review. Although the sensitivity of colposcopy is excellent (96), its specificity is poor (48).6 The poor specificity of colposcopy leads to a large number of unnecessary biopsies; this drives the high cost of screening.7 Thus, screening and detection strategies that are more specific and cost effective will improve the effectiveness of early detection in cancer prevention by reducing the costs of screening in the developed world and enabling accessible screening programs in the developing world. Optical technologies have the potential to improve the detection of cervical precancer. In particular, fluorescence spectroscopy has shown promising results in a number of clinical trials.8 9 10 11 The diagnostic value of fluorescence spectroscopy lies in its sensitivity to various molecular and structural changes in tissue that accompany the developments from normal tissue to cancer. Figure 1 shows various sources of fluorescence, optical scattering, and absorption in tissue that are directly related with such changes. Previous studies show that changes in intrinsic tissue fluorescence are closely correlated with dysplastic progression. Fluorescence from mitochondrial cofactors of reduced nicotinamide adenine dinucleotide (NADH) and flavin adenine dinucleotide (FAD) in epithelial cells increases as the cells become dysplastic.12 13 Fluorescence from structural protein cross-links in the stromal layer has also been shown to decrease with dysplasia, possibly due to the breakdown of the extracellular matrix by dysplastic cells. Confocal fluorescence microscopy images of fresh tissue slices from normal and precancerous cervical biopsies show how the fluorescence pattern is affected with dysplastic progression (Fig. 2).13 In normal tissue, cytoplasmic autofluorescence is limited to the basal layer of epithelial cells, whereas cytoplasmic fluorescence is observed in about 2/3 of the epithelial layer from precancerous tissue. Conversely, images from the stromal layer show that the fluorescence intensity from structural proteins decreases with dysplastic progression. Figure 2Fluorescence confocal images of fresh cervical tissue slices: (a) Cross sectional fluorescence confocal image of the epithelium from a normal tissue sample,13 (b) cross sectional fluorescence confocal image of the stroma from a normal tissue sample,13 (d) cross sectional fluorescence confocal image of the epithelium from an abnormal tissue sample,13 and (e) cross sectional fluorescence confocal image of the stroma from an abnormal tissue sample.13 Fluorescence excitation wavelength was 360 nm, and the yellow line marks the epithelial-stromal boundary. Reflectance confocal images of: (c) normal and (f) abnormal cervical biopsy specimens.17  Changes in absorption and scattering properties of tissue that occur with dysplasia also affect measured tissue fluorescence spectra, because propagation of excitation and fluorescent light in tissue is affected by the optical events. For example, it has been shown that nuclear changes, such as nuclear atypia, during dysplastic progression increase the level of light scattering from cells.14 15 16 Reflectance confocal microscopy shows that nuclear scattering from abnormal biopsies is greater than that from normal biopsies (Fig. 2).17 In addition, angiogenesis is an important clinical marker in the development of precancer and cancer,18 and the resultant increase in stromal hemoglobin concentration contributes to the increase in light absorption.19 Thus, a number of optical events in tissue are directly related with various molecular and structural changes that accompany dysplastic progression, and have the potential to serve as diagnostic markers. It is important to deconvolve the measured fluorescence spectrum to yield changes in each of these individual parameters before they can be used for diagnostic purposes. The extraction of optical parameters requires a mathematical model to describe fluorescence in tissue in terms of these parameters. Measured spectra can then be iteratively fit to this description to yield values of individual optical parameters. For the purpose of estimating epithelial and stromal tissue optical parameters, it is important to develop a mathematical model to describe the fluorescence of a two-layer medium. Abnormal changes such as alterations in cellular metabolism, modifications of the extracellular matrix, nuclear atypia, and angiogenesis affect optical properties of the epithelium and the stroma differently. For example, epithelial fluorescence generally increases with dysplasia, whereas stromal fluorescence decreases. As a result, different aspects of dysplastic progression can be probed by separating the optical parameters from the two different layers in tissue, resulting in maximal diagnostic information content. A number of mathematical models have been developed to describe fluorescence in tissue using various theories of light propagation. Monte Carlo simulations are known to generate accurate results in a multilayered medium. However, a large number of photon histories have to be simulated to achieve statistical significance, and this approach is not adequate for parameter estimation. Nair et al.;20 and Georgakoudi et al.;11 developed fluorescence models based on diffusion theory and a photon migration-based approach, respectively. Georgakoudi et al.; used a model to describe the reflectance and fluorescence spectra in terms of the probabilities that a photon entering tissue would escape after N scattering events. The model yields the intrinsic tissue fluorescence, which would be measured in the absence of scattering and reabsorption. The estimated spectra yielded significant diagnostic information concerning changes in NADH and collagen intrinsic fluorescence. However, the models developed by Nair et al.; and Georgakoudi et al.; describe fluorescence in a one-layer medium with homogeneous optical properties. As a result, the models cannot separate the optical parameters from the epithelium and the stroma when applied for inverse estimation. Hyde et al.;21 developed a fluorescence model based on diffusion theory that accounts for various fluorophore concentrations within the medium. However, diffusion theory has limitations in describing light propagation near the source,22 such as in the epithelial layer. We present a mathematical model to describe fluorescence in a two-layer epithelial tissue. The goal of this model is to provide a tool to analyze clinical fluorescence data from epithelial tissue to extract and analyze changes in the optical properties of the epithelium and stroma, which occur with dysplasia. The model was tested using a set of tissue optical properties identified from the literature for normal and precancerous cervix. Results were verified by comparison to Monte Carlo simulations and to average clinical measurements of cervical fluorescence spectra. 2.MethodsIn developing the analytical model, the tissue is considered to be a two-layer medium, consisting of an epithelial layer of thickness D and a semi-infinite stromal layer. Each of the two layers are assumed to be homogeneous with respect to optical properties, such as the scattering coefficient, the absorption coefficient, and fluorescence efficiency. The light delivery and collection geometry are set up to simulate a clinical device currently used for in vivo fluorescence and reflectance measurements,23 so that the model can be readily applied to clinical data. A fiber optic probe placed flush to the surface of the tissue delivers a beam of excitation light and collects fluorescence remitted from the tissue surface. The probe consists of a bundle of optical fibers (NA=0.2), in which 25 illumination fibers and 12 collection fibers are arranged randomly on a 2-mm-diam, 15-mm-long quartz mixing element. In effect, the probe illuminates a 2-mm-diam area and has a 0.2 numerical aperture (Fig. 3). 2.1.Two-Layer Analytical ModelThe total detected fluorescence from the tissue can be calculated as the sum of the contributions from the epithelial and stromal layers. Within each layer, the model must account for the propagation of excitation light, absorption by fluorophores (specified by the absorption coefficient μaf), conversion to fluorescence (described by the quantum efficiency ϕf of the fluorophore), and the propagation of the fluorescent light. The propagation of light at the excitation and emission wavelengths depends on the total absorption and scattering coefficients (specified by μa and μs, respectively) and the angular dependence of the scattering (described by the anisotropy factor g) within each layer. Within the wavelength range of interest (350 to 650 nm), these properties are quite different for the epithelium and the stroma; thus, we have selected two different models to describe the propagation of light in these two layers. In the epithelial layer, the reduced albedo a′=μs ′/(μs ′+μa) is approximately 0.3 to 0.4 based on values of the reduced scattering coefficient μs ′=μs⋅(1−g) and the absorption coefficient μa reported in Refs. 24 and 25. At such range of a′, light attenuation is accurately described by the effective attenuation coefficient μ eff =[3⋅μa⋅(μa+μs ′)]1/2. 26 Considering that the mean free path, δ=1/(μs+μa), for cervical epithelium (approximately 200 to 350 μm) is comparable to the epithelial thickness (typically between 200 to 500 μm),27 light propagation can be approximated using the Beer-Lambert law with μ eff . 28 In contrast, the stromal layer exhibits a relatively high level of scattering with a reduced albedo on the order of 0.9 and a mean free path of approximately 30 to 50 μm. Under these conditions, diffusion theory provides a good description of light propagation.29 In both cases, we examined the validity of using these descriptions of light propagation by comparing the results with Monte Carlo simulations using the same optical properties. For simplicity, a one-dimensional geometry is considered, with the direction of light propagation perpendicular to the tissue surface. When collimated excitation light with intensity Io is incident on the epithelial surface, light intensity is attenuated exponentially as the light travels along the optical axis. Fluorescence is generated isotropically at each source point, with half traveling toward the tissue surface (in the −z direction) and half traveling toward the stroma (in the +z direction), as shown in Fig. 4(a). The resultant fluorescence remitted from the tissue surface, F epi −(z=0), can be calculated as in Eq. (1). The subscript 1 for all the optical parameters refers to those of the epithelium. Stromal optical parameters will be indicated with a subscript 2. Due to the optical nature of the epithelium mentioned before, the fluorescence efficiencies (μaf⋅ϕf) are additive when multiple fluorophores are present. In Eq. (1), different fluorophores are denoted with a subscript k. F epi −(z=0) is in fact hemispherical flux in the +z direction, and the fraction of this light, which is collected by the fiber optic probe F1 detected , is approximated as the ratio R NA of the solid angle subtended by the fiber numerical aperture to hemispherical collection solid angle π/2.Figure 4One-dimensional model of light propagation in (a) epithelial layer and (b) stromal layer. The epithelium has thickness D, whereas the stromal layer is semi-infinite. The optical parameters for each layer are also labeled.  A portion of the downward directed fluorescence reaches the stroma, where it can be scattered back toward the tissue surface [Fig. 4(a)]. The portion of this fluorescence, which is directed upward, F epi ′−(z=D), is simply the product of F epi +(z=D) and the diffuse reflectance of the semi-infinite stromal layer. Using the 1-D diffusion theory,30 F epi ′−(z=D) is given by Eq. (3): In deriving Eq. (3), δ-Eddington approximation was used to achieve a better description of the forward scattering phase function in the stromal layer.29 A(λm) and C2(λm) are the general and particular solutions of the diffusion equation, and can be found in Ref. 30. This light is then attenuated as it travels back through the epithelium to the tissue surface; the fraction that is detected is again dependent on the numerical aperture of the fiber optic probe, as in Eq. (4).Excitation light that reaches the bottom of the epithelium is given by Some of the excitation light incident on the stroma is reflected back toward the tissue surface. The backscattered excitation light Is ′−, can be calculated using Eq. (3) with stromal optical parameters at the excitation wavelength. As this light travels back through the epithelium, it can excite additional epithelial fluorescence [Fig. 4(b)]. The fraction of this fluorescence that is detected is given by Eq. (5). The excitation light incident on the stroma can excite fluorescence within this layer of the tissue. Using the one-dimensional diffusion theory to describe the fluorescence in a homogeneous, one-layer medium,31 the stromal fluorescence remitted at the epithelial-stromal boundary F str − can be expressed as in Eq. (6): where andThis fluorescence is attenuated as it travels through the epithelium; the fraction of this fluorescence, which is detected F4 detected , can be expressed as in Eq. (7): The total detected fluorescence F total detected can then be calculated as the sum of these contributions (Eq. 8). There are additional, more complex light interactions that can contribute to the detected fluorescence (e.g., light travels through the epithelium, is backscattered by the stroma, and generates downward directed fluorescence in the epithelium, which is reflected by the epithelial-stromal interface, and remitted from the tissue surface). However, comparison with Monte Carlo simulations shows that these terms are negligible compared to the terms in Eq. (8), and therefore they have been neglected here. 2.2.Optical Parameters of TissueTo use the model of Eq. (8) to describe cervical tissue fluorescence, it is necessary to have optical properties that accurately describe this type of tissue. Wherever possible, we used optical properties that had been measured directly from normal and dysplastic cervical tissue. However, when these were not available, optical properties were obtained from organ sites with comparable optical properties. Epithelial μs at 810 nm was derived from in vitro measurements of cervical biopsies in Ref. 24 and was extrapolated to lower wavelengths using the inverse proportionality of cellular scattering properties to wavelength. 32 The total μa of the epithelium was derived from in vitro measurements of bronchial tissue. 25 The total μa of the stroma was assumed to consist of two factors: that from hemoglobin and that from collagen. Absorption coefficient μa of hemoglobin was calculated using its extinction coefficient 33 and the concentration measured in vivo from adenomatous polyps. 19 Absorption coefficient μa of collagen was calculated based on values from bloodless dermis measurement in neonatal skin. 34 Reduced scattering coefficients of the cervix calculated from in vivo reflectance measurements range between 20 cm−1 (at 700 nm) and 35 cm−1 (at 350 nm). 11 However, these values are derived from whole tissue and are not suitable for describing the scattering properties of cervical stroma. The scattering coefficient of the submucosa measured in vitro from bronchial tissue 25 lies in a comparable range, and was used as μs of the stromal layer. Fluorescence emission depends on the absorption coefficient μaf(λx) and the quantum efficiency ϕf(λx,λm) of the fluorophores. The most prominent fluorophores in the epithelial layer are assumed to be NADH and FAD. Recent studies show that keratin could also be a significant source of autofluorescence in the epithelium. 13 Most of the stromal fluorescence is assumed to be produced by collagen cross-links. It is difficult to calculate the fluorophore absorption coefficients and quantum efficiencies separately from direct measurements; however, it is relatively easy to measure their product, the fluorescence efficiency (μaf⋅ϕf). The spectral shape of the stromal fluorescence efficiency was based on fluorescence measurements of a gel of type I collagen; 35 that of the epithelium was taken from fluorescence measurements of a suspension of normal cervical epithelial cells made using a Spex Fluorolog II spectrofluorimeter. 35 The relative strengths of the epithelial and stromal fluorescence efficiencies were based on fluorescence microscopy measurements from fresh normal cervical tissue slices. 12 Anisotropy factor g for epithelium was set to 0.97, close to the value measured from immortalized and tumorigenic mammalian cells. 36 A g of 0.8 was used for the stroma, based on the values reported in Ref. 37. The index of refraction of both layers was 1.4, and the fiber optic probe was index-matched with the tissue. Figure 5 summarizes the optical parameters from the epithelium and stroma of normal cervical tissue. Figure 5Optical properties of normal and abnormal tissue used in the analytical model and the Monte Carlo simulations to predict fluorescence from tissue. Optical properties of the epithelium are plotted in black, whereas those of the stroma are plotted in gray: (a) μa of normal tissue, (b) μs of normal tissue, (c) fluorescence efficiency of normal tissue at 350-nm excitation, (d) μa of abnormal tissue, (e) μs of abnormal tissue, and (f) fluorescence efficiency of abnormal tissue at 350-nm excitation.  Optical parameters for preneoplastic cervical tissue were estimated from available measurements. In vitro confocal measurements in Ref. 24 show that the average epithelial μs increases approximately by a factor of 3 in abnormal tissue. Dellas showed a three-fold increase in microvessel density in high grade SIL (HG-SIL) tissue compared to normal epithelium: 18 thus light absorption due to hemoglobin was estimated to increase by a factor of 3 in abnormal tissue. Also, fluorescence confocal microscopy of fresh tissue slices suggests that the density of collagen fibers decreases in abnormal tissue by approximately 1/2, 13 affecting light scattering in the stromal layer. Relative fluorescence efficiencies between normal and HG-SIL tissue were based on fluorescence microscopy measurements in Ref. 12. Data collected from HG-SIL sites suggest that the epithelial fluorescence increased by about 100, whereas the stromal fluorescence decreased by about 50 in dysplastic tissue. Absorption of the epithelium, as well as the anisotropy factor and the index of refraction from both layers, were kept identical to those in normal tissue. 2.3.Monte Carlo SimulationsThe Monte Carlo technique was used to simulate the propagation of excitation and fluorescent light in the tissue, using the geometry of Fig. 3 and the same optical properties as for the analytical model. Results of the analytic model were compared to results using the Monte Carlo approach to determine whether the approximations made in the analytic model were appropriate. Excitation photons are delivered in a collimated beam with a uniform profile across the 2-mm-diameter optical probe. Fixed weight excitation photons undergo a sequence of scattering events defined by the stepsize and the deflection angle. At each scattering event, the stepsize and the deflection angle are sampled from a probability distribution based on the mean free path δ and the anisotropy factor g, respectively. The probability of absorption of the excitation photon at each scattering event is μa/μa+μs, where μa and μs are the absorption and scattering coefficients of the layer the photon is traveling in. In the epithelial layer, light absorption is assumed to be caused mostly by fluorophores. As a result, all the absorbed photon weight contributes to fluorescence emission. However, in the stromal layer, light absorption is caused by both the fluorophore (collagen cross-links) and the chromophore (hemoglobin). The portion of the photon weight absorbed by the fluorophore is calculated with the factor μa,col /μa,col +μa,Hb , where μa,col and μa,Hb are μa for collagen and hemoglobin, respectively. The absorbed photon weight is converted to fluorescence photon weight by the quantum efficiency, which is calculated by dividing the fluorescence efficiency by the absorption coefficient of the fluorophore. The fluorescent photon travels with a variable weight, in which μa/μa+μs of the weight is lost at each scattering event due to absorption. As in the case of the excitation photon, the pathlength and deflection angle at each scattering event is sampled from the two probability distributions based on optical properties at the emission wavelength. The fluorescent photon is detected when it exits the tissue surface within the diameter and the numerical aperture of the fiber optic probe. To achieve statistical significance, 10 million excitation photons were generated for each Monte Carlo simulation unless specified otherwise. Anisotropy factors of the epithelium (g1=0.97) and the stroma (g2=0.8), as well as all other optical parameters, were set identical to the two-layer analytical model. The Heyney-Greenstein function was used as the phase function. The weight of the detected photons was accumulated to calculate total detected fluorescence. The implemented Monte Carlo code was verified using the results from two-layer simulations in Ref. 38, in which the difference in the remitted fluorescence between the two models was less than 1. 3.ResultsDetected fluorescence calculated by the analytical model was compared with the results from the Monte Carlo simulations to validate the model approximations. To compare the results of the Monte Carlo simulations and the analytical model directly, the same intensity of incident light was used in both cases. In the following analysis, we assume that each photon weight in the Monte Carlo simulations is identical to the unit intensity of light used in the analytical model. Figure 6(a) shows a one-dimensional profile of the detected fluores-cence as a function of the depth inside the tissue where the fluorescent light was generated. Optical properties are from normal tissue at 350-nm excitation and 420-nm emission, and excitation light intensity of 100 million units was used. Fluorescence generated within the epithelium shows good agreement between the analytical model and the Monte Carlo simulations. Figure 6Comparison of detected fluorescence intensity calculated by the analytical model (black) and the Monte Carlo simulations (gray) with respect to depth of emission in the tissue. (a) Fluorescence originating from both the epithelium and the stroma (F4 detected ). The dotted vertical line shows the epithelial-stromal boundary at 200 μm. In (b), the epithelial fluorescence was broken down into the different sources considered in the analytical model: solid line for F1 detected , dotted line for F2 detected , and dashed line for F3 detected . The following optical parameters were used: μa1(λx)=4.2 cm −1, μs1(λx)=50.9 cm −1, μa1(λm)=2.98 cm −1, μs1(λm)=42.43 cm −1, μa2(λx)=14.93 cm −1, μs2(λx)=319.5 cm −1, μa2(λm)=9.37 cm −1, and μs2(λm)=266.25 cm −1.  Figure 6(b) provides a comparison of the different components, F1 detected , F2 detected , and F3 detected , of detected epithelial fluorescence as a function of depth inside the epithelium where the fluorescence was generated. Both the analytical model and the Monte Carlo simulations show similar trends in the depth dependence of the origin of the detected fluorescence. It is interesting to note that the analytical model slightly overestimates F1 detected and F2 detected , as shown in Fig. 6(b). This is because the effective attenuation coefficient μ eff used with the Beer-Lambert law slightly underestimates the attenuation of both the excitation and the emission light in the epithelial layer. However, Fig. 6(a) shows that the difference between the two models is small (less than 5) when the overall epithelial fluorescence is considered. In the case of fluorescence originating in the stroma, the analytical model overestimates the detected fluorescence that originates near the epithelial-stromal boundary, as shown in Fig. 6(a). However, results from the single-layer medium with stromal optical properties show that diffusion theory underestimates Monte Carlo simulations by approximately 6. The slight underestimation of the diffusion theory when used with the δ-Eddington approximation is also demonstrated in Ref. 29. The difference in stromal fluorescence characteristics between the two-layer model and the single-layer model can be attributed to the propagation of excitation and emission light through the epithelial layer. As seen in Fig. 6(b), the attenuation of light in the epithelial layer is slightly underestimated by μ eff . As a result, the intensity of the excitation light delivered to the stromal layer, as well as the stromal fluorescence that propagates through the epithelial layer before detection, are overestimated in the analytical model. However, when the total detected stromal fluorescence is calculated by integrating the stromal fluorescence shown in Fig. 6(a), the difference between the two models is approximately 3. The two-layer analytical model was then used to examine the dependence of detected fluorescence on the optical properties of the epithelium and stroma. Results are shown as a function of the optical parameter in Fig. 7, assuming an excitation wavelength of 350 nm and an emission wavelength of 420 nm. The range of optical parameters was altered to span the range expected for normal and abnormal cervical tissue at this excitation-emission wavelength combination. Although only the optical parameters at the excitation wavelength are shown in the x axis in Fig. 7, the optical parameters at the emission wavelengths were varied proportionally. Figure 7Effect of various optical parameters on detected fluorescence calculated by the analytical model (black) and the Monte Carlo simulations (gray). In each figure, the solid lines and the dotted lines show total detected fluorescence and detected fluorescence originating from the epithelium, respectively, generated by the two models. The following parameters were investigated: (a) epithelial thickness, (b) μa of the epithelium, (c) μs of the epithelium, (d) μa of the stroma, (e) μa of collagen, and (f) μs of the stroma. In each case, the following values were used for the rest of the optical parameters: epithelial thickness=200 μm, μa1(λx)=4.2 cm −1, μs1(λx)=50.9 cm −1, μa1(λm)=2.98 cm −1, μs1(λm)=42.43 cm −1, μa2(λx)=14.93 cm −1, μs2(λx)=319.5 cm −1, μa2(λm)=9.37 cm −1, and μs2(λm)=266.25 cm −1.  As the epithelial thickness increases from 100 to 500 μm, the detected epithelial fluorescence increases [Fig. 7(a)]. At the same time, the detected stromal fluorescence decreases because the excitation light traveling to the stroma undergoes increased attenuation in the thicker epithelium. The epithelial and stromal fluorescence calculated by the analytical model are in good agreement with results of the Monte Carlo simulations. Increasing the epithelial absorption has a similar effect [Fig. 7(b)]. Increasing the epithelial absorption increases epithelial fluorescence, since light absorption in the epithelium is assumed to contribute directly to fluorescence emission. However, increased attenuation of light in the epithelial layer decreases detected stromal fluorescence. It is interesting to note that the analytical model slightly underestimates both the epithelial fluorescence and the stromal fluorescence at relatively high levels of epithelial absorption. As the epithelial scattering is increased, Monte Carlo simulations show a slight increase in epithelial fluorescence [Fig. 7(c)]. However, the Beer-Lambert law used in the analytical model does not account for this increase, and the epithelial fluorescence calculated by the analytical model slightly decreases with increased epithelial scattering. Increasing stromal absorption associated with hemoglobin reduces the detected stromal fluorescence, as shown in Fig. 7(d). Similarly, increasing the stromal absorption reduces the detected epithelial fluorescence from F epi +(z=D), which initially was directed downward. The results of the analytical model and the Monte Carlo simulations are in good agreement throughout the range of the stromal absorption considered. Stromal absorption is also affected by the fluorophore absorption coefficient in the stroma. Figure 7(e) shows that the detected stromal fluorescence increases as the fluorophore absorption coefficient is increased. At the same time, the detected epithelial fluorescence decreases slightly because of the attenuation of F epi +(z=D) epithelial fluorescence, which is initially directed downward. Results of the analytical model show good agreement with the Monte Carlo simulations. Monte Carlo simulations show that both the detected stromal fluorescence and the epithelial fluorescence increase slightly as stromal scattering increases [Fig. 7(f)]. Increased stromal scattering increases the diffusion of light at shallow depths in the stroma, resulting in an increase of stromal fluorescence. However, detected stromal fluorescence calculated by the analytical model remains relatively constant for the range of stromal scattering shown in Fig. 7(f). Fluorescence spectra at 350-nm excitation generated by the analytical model and the Monte Carlo simulations are plotted in Fig. 8. In Fig. 8(a), the optical properties of normal cervical tissue were used. The analytical model underestimates the epithelial fluorescence by approximately 4 and overestimates the stromal fluorescence by approximately 6, relative to the results of the Monte Carlo simulations. The difference between the total detected fluorescence calculated by the two models is approximately 4. Figure 8(b) compares predictions of the analytic model and Monte Carlo simulations using the optical properties of HG-SIL at 350-nm excitation. The discrepancy of the total detected fluorescence between the two models is less than 5. Figure 8Fluorescence spectra calculated using the analytical model (black) and the Monte Carlo simulations (gray) using optical parameters of (a) normal and (b) abnormal tissue. The excitation wavelength was 350 nm. In each figure, the solid lines and the dotted lines show total detected fluorescence and detected fluorescence originating from the epithelium, respectively, generated by the two models. Average clinical measurement of squamous normal sites and HG-SIL sites are plotted as gray dashed lines in Figs. 7(a) and 7(b), respectively. The two clinical measurements were scaled with an identical factor. 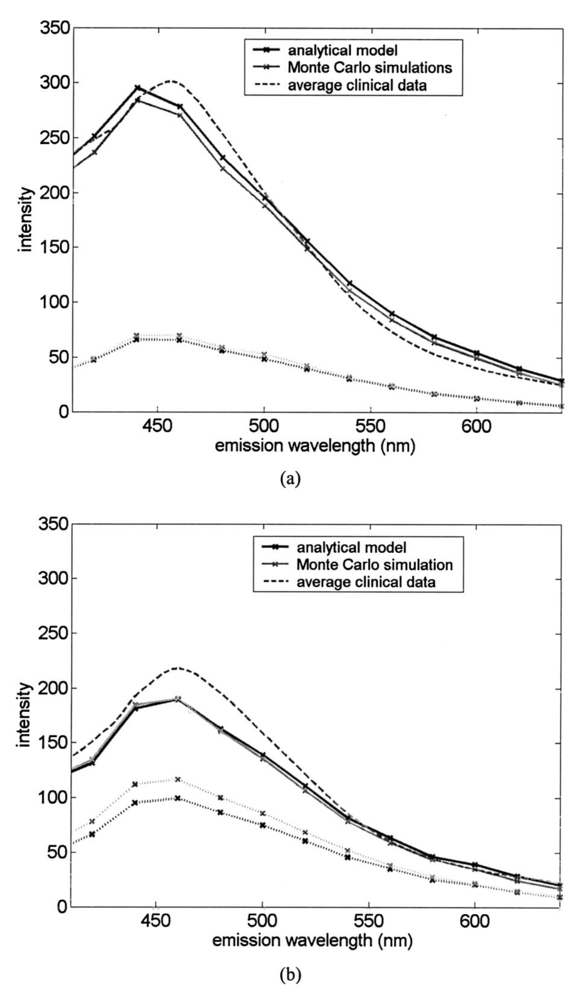 To compare the spectra predicted from the models with clinical measurements, average fluorescence spectra measured at 350-nm excitation are also plotted in Fig. 8. Fluorescence emission spectra were measured from 209 normal squamous cervical sites in 116 patients with the clinical device described in Ref. 23; the average spectrum is shown as a dashed line in Fig. 8(a). A linear scaling factor was used to scale the model prediction and the clinical measurement to the intensity at 440-nm emission. The line shape of the fluorescence predicted by the models agrees well with that measured clinically. Figure 8(b) shows the average spectrum from 45 HG-SIL cervical sites from 28 patients. The scaling factor from Fig. 8(a) was applied to the average clinical measurement in Fig. 8(b). While the lineshapes of the predicted and measured fluorescence from HG-SIL agree well, the model underestimates the average fluorescence measurement from HG-SIL cervical tissue by 5 to 20 at emission wavelengths below 550 nm. 4.Discussion and ConclusionsIn this study, an analytical model to describe fluorescence in a two-layer medium is developed. Results of the analytical model are compared with those generated by the Monte Carlo simulations to investigate the validity of the model. Under most optical conditions tested in the study, the Beer-Lambert law provides a good description of light propagation in the epithelial layer. Theoretically, the Beer-Lambert law is applicable to media where the albedo is small. Figure 5 shows that there is a higher level of scattering than absorption in the epithelium. However, strong forward scattering in the epithelium reduces the effect of light scattering, and low values of reduced albedo a′ provides an optical regime favorable for the Beer-Lambert law. Moreover, the optical parameters in Fig. 5 suggest that the mean free path δ in the epithelium is approximately 200 μm for normal tissue and 70 μm for abnormal tissue. Considering that the epithelial thickness typically ranges between 100 to 500 μm, the number of scattering events in the epithelial layer is very small, further reducing the effect of epithelial scattering. Figure 7(c) shows that the analytical model underestimates the epithelial fluorescence by more than 15 when the reduced albedo is greater than 0.3. Comparisons with Monte Carlo simulations show that the diffusion theory provides a good description of light propagation in the stromal layer under the various optical conditions tested in this study. Although the diffusion theory provides a good description of light propagation in the stromal layer, a limitation of the analytical model in describing the stromal fluorescence is due to the fact that the attenuation of the excitation and the emission light is slightly underestimated in the epithelial layer. However, in terms of the total detected fluorescence from the stroma, the difference between the two models is about 3. The advantage of the analytical model relative to the Monte-Carlo-based approach is that the analytical model can be readily applied to clinical measurements to extract various optical parameters of the epithelium and stroma. In inverse estimation, a set of optical parameters that best fits a mathematical model to the measured spectra will be determined in an iterative process. The analytical model presented in this work is designed to describe fluorescence measured from a clinical device currently used to measure in vivo fluorescence spectra. The results described show that the analytical model provides a good description of fluorescence for the optical properties associated with normal and precancerous cervical epithelium and stroma. Future work will explore the diagnostic performance of classification algorithms based on model parameters extracted in this approach. REFERENCES
P. Pisani
,
D. M. Parkin
,
R. Bray
, and
J. Ferlay
,
“Estimates of the worldwide mortality from 25 cancers in 1990,”
Int. J. Cancer , 83 18
–29
(1999). Google Scholar
L. G. Koss
,
“The Papanicoloau test for cervical cancer detection: A triumph and a tragedy,”
J. Am. Med. Assoc. , 261 737
–743
(1989). Google Scholar
R. J. Kurman
,
R. E. Herison
,
A. L. Herbst
,
K. L. Noller
, and
M. H. Schiffman
,
“Interim guidelines for management of abnormal cervical cytology,”
J. Am. Med. Assoc. , 271 1866
–1869
(1994). Google Scholar
L. Gustafsson
,
J. Ponten
,
M. Zack
, and
H. O. Adami
,
“International incidence rates of invasive cervical cancer after introduction of cytological screening,”
Cancer Causes Control , 8 755
–763
(1997). Google Scholar
M. Follen Mitchell
,
S. B. Cantor
,
C. Brookner
,
U. Utzinger
,
D. Schottenfeld
, and
R. Richards-Kortum
,
“Screening for squamous intraepithelial lesions with fluorescence spectroscopy,”
Obstet. Gynecol. (N.Y., NY, U. S.) , 94 889
–896
(1999). Google Scholar
M. Follen Mitchell
,
D. Schottenfeld
,
G. Tortolero-Luna
,
S. B. Cantor
, and
R. Richards-Kortum
,
“Colposcopy for the diagnosis of squamous intraepithelial lesions: a meta-analysis,”
Obstet. Gynecol. (N.Y., NY, U. S.) , 91 626
–631
(1998). Google Scholar
S. B. Cantor
,
M. Follen Mitchell
,
G. Tortolero-Luna
,
C. S. Bratka
,
D. C. Bodurka
, and
R. Richards-Kortum
,
“Cost-effectiveness analysis of diagnosis and management of cervical squamous intraepithelial lesions,”
Obstet. Gynecol. (N.Y., NY, U. S.) , 91 270
–277
(1998). Google Scholar
N. Ramanujam
,
M. Follen Mitchell
,
A. Mahadevan-Jansen
,
S. L. Thomsen
,
G. Staerkel
,
A. Malpica
,
T. Wright
,
N. Atkinson
, and
R. Richards-Kortum
,
“Cervical pre-cancer detection using a multivariate statistical algorithm based on laser induced fluorescence spectra at multiple excitation wavelengths,”
Photochem. Photobiol. , 6 720
–735
(1996). Google Scholar
R. J. Nordstrum
,
L. Burke
,
J. M. Niloff
, and
J. M. Myrtle
,
“Identification of cervical intraepithelial neoplasia (CIN) using UV-excited fluorescence and diffuse-reflectance tissue spectroscopy,”
Lasers Surg. Med. , 29 118
–127
(2001). Google Scholar
S. K. Chang
,
M. Follen
,
A. Malpica
,
U. Utzinger
,
G. Staerkel
,
D. Cox
,
E. N. Atkinson
,
C. MacAulay
, and
R. Richards-Kortum
,
“Optimal excitation wavelengths for discrimination of cervical neoplasia,”
IEEE Trans. Biomed. Eng. , 49 1102
–1111
(2002). Google Scholar
I. Georgakoudi
,
E. E. Sheets
,
M. G. Mu¨ller
,
V. Backman
,
C. P. Crum
,
K. Badizadegan
,
R. R. Dasari
, and
M. S. Feld
,
“Trimodal spectroscopy for the detection and characterization of cervical precancers in vivo,”
Am. J. Obstet. Gynecol. , 186 374
–382
(2002). Google Scholar
R. Drezek
,
C. Brookner
,
I. Pavlova
,
I. Boikol
,
A. Malpica
,
R. Lotan
,
M. Follen
, and
R. Richards-Kortum
,
“Autofluorescence microscopy of fresh cervical-tissue sections reveals alterations in tissue biochemistry with dysplasia,”
Photochem. Photobiol. , 73 636
–641
(2001). Google Scholar
I. Pavlova
,
K. Sokolov
,
R. Drezek
,
A. Malpica
,
M. Follen
, and
R. Richards-Kortum
,
“Microanatomical and biochemical origins of normal and precancerous cervical autofluorescence using laser scanning fluorescence confocal microscopy,”
Photochem. Photobiol. , 77 550
–555
(2003). Google Scholar
J. R. Mourant
,
M. Canpolat
,
C. Brocker
,
O. Esponda-Ramos
,
T. M. Johnson
,
A. Matanock
,
K. Stetter
, and
J. P. Freyer
,
“Light scattering from cells: the contribution of the nucleus and the effects of proliferative status,”
J. Biomed. Opt. , 5 131
–137
(2000). Google Scholar
R. Drezek
,
M. Guillaud
,
T. Collier
,
I. Boiko
,
A. Malpica
,
C. MacAulay
,
M. Follen
, and
R. Richards-Kortum
,
“Light scattering from cervical cells throughout neoplastic progression: influence of nuclear morphology, DNA content, and chromatin texture,”
J. Biomed. Opt. , 8 7
–16
(2003). Google Scholar
D. Arifler
,
M. Guillard
,
A. Carraro
,
A. Malpica
,
M. Follen
, and
R. Richards-Kortum
,
“Light scattering from normal and dysplastic cervical cells at different epithelial depths: finite-difference time-domain modeling with a perfectly matched layer boundary condition,”
J. Biomed. Opt. , 8 484
–494
(2003). Google Scholar
T. Collier
,
A. Lacy
,
A. Malpica
,
M. Follen
, and
R. Richards-Kortum
,
“Near real-time confocal microscopy of amelanotic tissue: detection of dysplasia in ex vivo cervical tissue,”
Acad. Radiol. , 9 504
–512
(2001). Google Scholar
A. Dellas
,
H. Moch
,
E. Schultheiss
,
G. Feichter
,
A. C. Almendral
,
F. Gudat
, and
J. Torhorst
,
“Angiogenesis in cervical neoplasia: microvessel quantitation in precancerous lesions and invasive carcinomas with clinicopathological correlations,”
Gynecol. Oncol. , 67 27
–33
(1997). Google Scholar
G. Zonios
,
L. T. Perelman
,
V. Backman
,
R. Manoharan
,
M. Fitzmaurice
,
J. Van Dam
, and
M. S. Feld
,
“Diffuse reflectance spectroscopy of human adenomatous colon polyps in vivo,”
Appl. Opt. , 38 6628
–6637
(1999). Google Scholar
M. S. Nair
,
N. Ghosh
,
N. S. Raju
, and
A. Pradhan
,
“Determination of optical parameters of human tissue from spatially resolved fluorescence: a diffusion theory model,”
Appl. Opt. , 41 4024
–4034
(2002). Google Scholar
D. E. Hyde
,
T. J. Farrell
,
M. Patterson
, and
B. C. Wilson
,
“A diffusion theory model of spatially resolved fluorescence from depth-dependent fluorophore concentrations,”
Phys. Med. Biol. , 46 369
–383
(2001). Google Scholar
G. Alexandrakis
,
T. J. Farrell
, and
M. S. Patterson
,
“Accuracy of the diffusion approximation in determining the optical properties of a two-layer turbid medium,”
Appl. Opt. , 37 7401
–7409
(1998). Google Scholar
A. Zuluaga
,
U. Utzinger
,
A. Durkin
,
H. Fuchs
,
A. Gillenwater
,
R. Jacob
,
B. Kemp
,
J. Fan
, and
R. Richards-Kortum
,
“Fluorescence excitation emission matrices of human tissue: a system for in vivo measurement and data analysis,”
Appl. Spectrosc. , 53 302
–311
(1998). Google Scholar
T. Collier
,
D. Arifler
, and
R. Richards-Kortum
,
“Determination of epithelial tissue scattering coefficient using confocal microscopy,”
IEEE J. Sel. Top. Quantum Electron. , 9 307
–313
(2003). Google Scholar
J. Qu
,
C. MacAulay
,
S. Lam
, and
B. Palcic
,
“Optical properties of normal and carcinomatous bronchial tissue,”
Appl. Opt. , 33 7397
–7405
(1994). Google Scholar
S. T. Flock
,
M. S. Patterson
,
B. C. Wilson
, and
D. R. Wyman
,
“Monte Carlo modeling of light propagation in highly scattering tissues-I: Model predictions and comparison with diffusion theory,”
IEEE Trans. Biomed. Eng. , 36 1162
–1168
(1989). Google Scholar
D. C. Walker
,
B. H. Brown
,
A. D. Blackett
,
J. Tidy
, and
R. H. Smallwood
,
“A study of the morphological parameters of cervical squamous epithelium,”
Physiol. Meas. , 24 121
–135
(2003). Google Scholar
J. Wu
,
M. S. Feld
, and
R. P. Rava
,
“Analytical model for extracting intrinsic fluorescence in turbid media,”
Appl. Opt. , 32 3585
–3595
(1993). Google Scholar
J. R. Mourant
,
J. P. Freyer
,
A. H. Hielscher
,
A. A. Eick
,
D. Shen
, and
T. M. Johnson
,
“Mechanisms of light scattering from biological cells relevant to noninvasive optical-tissue diagnostics,”
Appl. Opt. , 37 3586
–3593
(1998). Google Scholar
K. Sokolov
,
J. Galvan
,
A. Myakov
,
A. Lacy
,
R. Lotan
, and
R. Richards-Kortum
,
“Realistic three-dimensional epithelial tissue phantoms for biomedical optics,”
J. Biomed. Opt. , 7 148
–156
(2002). Google Scholar
J. R. Mourant
,
J. P. Freyer
,
A. H. Hielscher
,
A. A. Eick
,
D. Shen
, and
T. M. Johnson
,
“Mechanisms of light scattering from biological cells relevant to noninvasive optical-tissue diagnostics,”
Appl. Opt. , 37 3586
–3593
(1998). Google Scholar
A. J. Welch
,
C. Gardner
,
R. Richards-Kortum
,
E. Chan
,
G. Criswell
,
J. Pfefer
, and
S. Warren
,
“Propagation of fluorescent light,”
Lasers Surg. Med. , 21 166
–178
(1997). Google Scholar
|


