
|
|
1.IntroductionNear-infrared (NIR) imaging provides a method of quantifying the spatial and temporal changes in breast tissue composition of features that provide contrast in this region of the optical spectrum. While clinical breast imaging is performed with x-ray mammography, ultrasound or contrast-enhanced magnetic resonance imaging (MRI), these standard imaging modalities provide comparatively little information about molecular-level changes in breast tissue. NIR imaging supplies contrast information that is specific to oxyhemoglobin, deoxyhemoglobin, and water, as well as scattering parameters that are related to the microscopic fluctuations in refractive index.1 2 Because of these unique contrast mechanisms, there has been considerable interest in using NIR measurements to quantify changes in breast physiology or transition to pathology.3 4 In this study, a clinical prototype NIR tomography system was used to quantify average breast properties in premenopausal and postmenopausal women, and to examine the typical spatial fluctuations observed when imaging breasts with lesions. The origin of contrast in medical imaging systems can provide insight into the detection limits of normal and pathological tissues. For imaging breast tumors, mammography is the front line for screening and diagnostic purposes and relies upon low-energy x-rays (10 to 30 keV) that have a contrast based upon the structural matrix of soft tissue, owing largely to changes in collagen or calcium deposits. As is illustrated in Fig. 1(a), these wavelengths have a dominant interaction with water and tissue that is due to the photoelectric effect and Compton scattering; hence, a change in the density of bulk materials having a high atomic number typically causes contrast. These changes in bulk tissue composition are typically small and lead to a maximum tumor-normal tissue contrast of 10, as illustrated in Fig. 1(b).5 Since mammography has become the main line for clinical cancer screening, there has been an enormous volume of investigation into the typical patterns of contrast visible in the normal breast, and how tissue radiographic composition varies in individual women.6 7 8 9 Similarly, intrinsic contrast with MRI10 or ultrasound typically shows less than 10 variation,11 even when imaging tumors within the normal tissue background, as illustrated in Fig. 1(b). The contrast can be increased by either log compression of the scale, as in ultrasound, or with injected contrast agents such as gadolinium, as in MRI. Figure 1The graph in (a) shows the dominant interactions between photons and water across the medically useful electromagnetic spectrum. In x-ray mammography, the photon energies involved are near 2×10⁴ eV (10–30 keV), and thus Compton scattering and the photoelectric effect are dominant in producing the contrast in the images. In near-infrared imaging, near the 800-nm wavelength region, the dominant interaction is Mie scattering (dotted line) of photons from intracellular fluctuations in the refractive index, which is about 100 times greater than in Compton scattering. The absorption that is due to water is quite low in comparison, and so the light transport in this wavelength region is diffuse, owing to the random walk of photons in a highly scattering region. The graph in (b) shows the tradeoff between resolution and contrast in imaging tumor tissue in the breast. Mammography, ultrasound, and MRI all have higher resolution, but the intrinsic contrast available is low. In comparison, NIR imaging has exceptionally high intrinsic contrast, but suffers from lower spatial resolution because of diffuse light scattering.  NIR contrast mechanisms and signal propagation in tissue are quite different than other clinical imaging modalities. NIR photons are completely dominated by elastic Mie-like scattering in tissue, as shown in Fig. 1(a), and contrast variations in this scattering are also generally small, on the order of 10 to 20, as with Compton scattering. However, because the scattering causes photons to follow a diffuse path in tissue, owing to multiple elastic scattering events, changes in absorption coefficient are amplified in the final signal because of an increased path of travel. In addition, absorption contrast in tumors is largely based upon concentration variations in blood and water relative to the surrounding tissue, and the absorption ratio between tumor and normal breast tissue is perhaps one of the highest intrinsic biological contrasts available in medical imaging, being assessed up to 200 based upon the level of vessel formation in the tumor.1 3 12 13 Thus the combination of high absorption contrast and increased photon path length from scattering contributes to a high intrinsic optical contrast when diffuse light is used. Of course the benefit of this enormous contrast is diminished somewhat by multiple elastic scattering, reducing the achievable resolution to near 5 mm within a few centimeters of tissue. In fact, studies have suggested that because of the dominance of scattering, further increases in contrast would most likely not provide significantly improved resolution. However, a review of the literature indicates that while a major focus on breast NIR imaging has been established, there is comparatively little information on typical variations in breast tissue optical properties and how they change temporally in an individual. Histological studies of breast physiology14 15 have shown that mitotic activity is significantly affected by hormone variations during the menstrual cycle, with peaks occurring in the second half of the cycle, having maximum values near 20 to 26 days and minimums near 6 to 8 days into the cycle. Similarly, MRI imaging16 17 has shown that cyclic variations are observable in water volume, with glandular tissue volumes peaking in the second phase of the cycle, although the magnitude and significance of these changes are quite variable among subjects.17 Studies with gadolinium-enhanced MRI for characterizing breast lesions have shown that parenchymal enhancement does not occur as strongly in the beginning or latter parts of the cycle,18 which has led to the recommendations that this type of imaging take place 1 to 6 or after 21 days into the cycle in premenopausal women. If similar variations are observed in NIR imaging, as recent studies have indicated,2 19 it will be important to establish how these changes affect image quality and diagnostic capabilities. In this paper, a clinical prototype NIR tomography system is described and the results of measurements in a series of women are reported. The goal is to report on the intersubject variability both before and after menopause, and to quantify the intrabreast variation in properties observed in normal breasts, which is compared with specific lesions imaged with the system in order to establish the feasibility of detecting and/or characterizing cancer lesions. In addition to the goal of imaging cancer with NIR, there may be a role for these types of measurements in normal breast tissue, either as a method of characterizing tissue composition, changes in composition, hormonal status, vascular disease, or lymph node changes. Until a solid understanding of the normal tissue variation is established, these other applications cannot be realistically assessed. 2.Methods2.1.HardwareThe clinical prototype imaging system is shown in Fig. 2 and is currently being used in a clinical trial to determine its efficacy in characterizing breast lesions. Figure 2(a) shows a drawing of the hardware subsystems for light generation and detection as well as the stage used to rotate the light source around the fibers that encircle the breast. The photograph in Fig. 2(b) shows the circular tissue–fiber interface that is mounted on sixteen linear translation stages, allowing coupling of the fibers to the breast surface in any diameter between 45 and 200 mm. The breast (or calibration phantom) to be imaged is circled uniformly by the interface of three layers of sixteen silica glass fibers of 6-mm diameter each. The larger opening size of 200 mm is mainly used to allow easy placement of the breast in the array. In order to transmit and detect light through the breast, the opening generally has to be 120 mm or less in diameter at the time of tomography measurement. All of the sources and detectors uniformly contact the breast and force transducers are located in the array to allow online measurement of the pressure applied to the tissue surface. This feature was initially added as a safety measure, but we later realized that the pressure-induced changes in breast tissue optical properties are significant and need to be featured in when imaging with NIR.20 In Fig. 2(c), the system is shown with the exam table covering the imaging array, while in Fig. 2(d) a patient is lying prone on the table with the breast to be imaged pendant through the opening. Figure 2(a) An engineering drawing of the optical source and detection subsystem. The upper circular region holds three rings of sixteen fiber bundles each, mounted to sixteen linear translation stages. The tomography imaging is achieved by cycling the laser source into each fiber sequentially, through the circular translation stage on the bottom. While the laser is cycled into each fiber, the remaining fifteen fibers align with photomultiplier tubes to allow detection of the transmitted light. Similarly to x-ray CT, the source and detector array rotate together, but in this geometry the tissue is physically remote from the rotating gantry because the light is delivered via multiple fiber bundles. (b) A photograph of the same optical subsystem, with a tissue contact ring; linear translator motors; a vertical translation stage that allows the entire array to be moved up or down; overall motor controller panel; and the optical tomography source–detector rotation system. (c) The patient examination table with the optical subsystem located immediately beneath the central hole in the table. (d) A female subject positioned on the table with her breast in the imaging array. 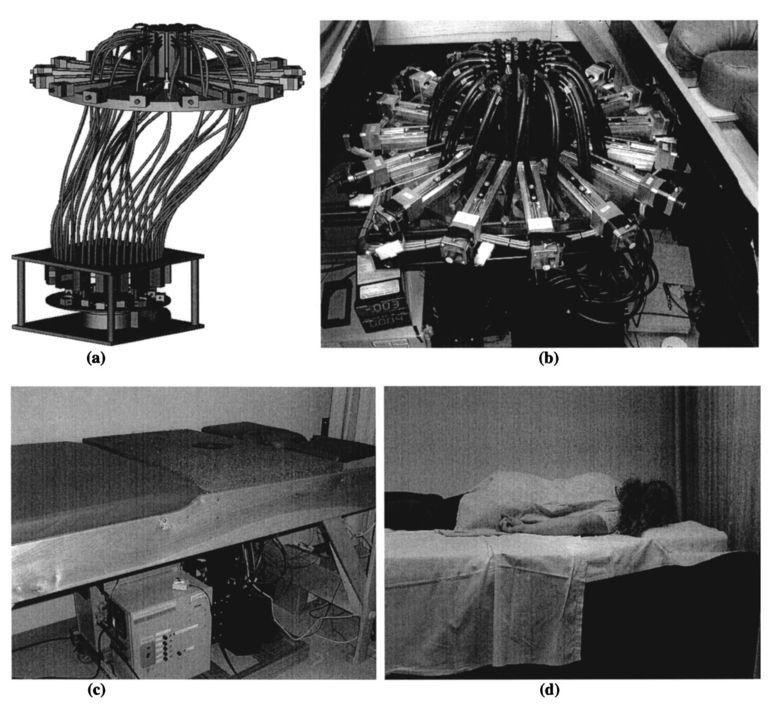 Inside the optical subsystem, near-infrared light from six laser diodes is used serially as the source, with average power of more than 30 mW each, and wavelengths of 661, 761, 785, 808, 826, and 849 nm. The source wavelength is interchanged using a high-power radio frequency (rf) switch for the driving current. The driving current contains both direct current and rf components, with the rf modulated by a function generator with a frequency of 100 MHz. The light is sequentially delivered to the breast through one of the sixteen fibers. The diffusely transmitted light is detected by the remaining fifteen fibers that are aligned to output to each of 15 photomultiplier tube detectors that sample the signal in parallel. The electrical signal outputs from the photomultipliers are heterodyned down to 500 Hz, filtered and sampled by a 64-channel 200-kHz analog to digital (A/D) board in the computer. A single measurement at all detectors for one source location requires approximately 0.5 s, and the complete measurement for all six wavelengths at all source–detector pairs requires approximately 5 min. A complete discussion of this system and its technical specifications is given elsewhere.21 2.2.Theory and SoftwareLight transport in tissue can be modeled with many different approaches, including Maxwell’s equations, Mie scattering, or radiation transport theory. It is well established for near-infrared wavelengths interacting in tissue that scattering dominates over absorption, and that the scattering interaction is characterized by elastic processes resulting from refractive index fluctuations at the microscopic level of cellular organelles. Under these complex circumstances, the Boltzmann transport equation has been the most useful approach for modeling over large tissue distances. This equation can be simplified to the diffusion approximation when the radiation concerned is neutrally charged and when it is dominated by elastic scattering.22 23 Frequency-domain light measurements have been implemented perhaps more successfully than time-domain or continuous-wave methods, owing to their simplicity while providing a unique dataset that allows estimation of both absorption and scattering coefficients. In this case, the phase shift of the signal provides a measurement that is dominated by the optical path length through the tissue, while the amplitude of the traveling wave provides information about the overall attenuation of the signal. In addition, the lock-in detection capabilities of frequency-domain hardware make this type of system very reliable, robust, and efficient. The theoretical analogue of this hardware approach is to model the diffusion equation in the frequency domain, given by: where S0(r,ω) is an isotropic source, ϕ(r,ω) is the photon fluence rate at position r, and D(r)={3[μa(r)+μs ′(r)]}−1 is the diffusion coefficient. A type III boundary condition is applied as where α is a term that incorporates reflection as a result of refractive index mismatch at the boundary and n^ is the outward-pointing normal to the boundary. The data are represented by a nonlinear operator, f, which is a complex-valued vector having a real and imaginary components, which is actually utilized as logarithm of the amplitude and phase in the measurements. The diffusion theory solution to the forward problem is then a nonlinear functional estimate of f, denoted as F(μa,D), which is also a complex-valued vector function corresponding to the computed photon fluence rate at the detector sites. Then the image reconstruction method uses a Newton-minimization approach to seek a solution to where ‖⋅‖ represents the square root of the sum of squared elements. The magnitude of this is sometimes referred to as the projection error and provides a value for determining the convergence of the iterative reconstruction algorithm. The finite-element method (FEM) is used as a general and flexible method for solving the forward problem in arbitrary geometries. In the inverse problem, the internal optical property distributions are recovered from boundary measurements, yielding images of μa(r) and D(r) at all discrete points within the field representing the tissue.To find the solution to Eq. (3), a Newton-minimization approach is followed, as developed by Paulsen and Jiang.24 25 Briefly, a matrix equation that can be iteratively solved from Eq. 3 is as follows, where δμ is a solution update vector, δμ=[δμa,δD], which includes separate information on the updates in absorption and diffusion coefficients, respectively, and J is the Jacobian matrix (sometimes called the sensitivity matrix) for the diffusion equation solution. Since J is a nonsquare matrix, we multiply by the transpose, and because J T J is an ill-conditioned matrix, we require significant regularization in order to invert it. Thus the final matrix equation becomes The regularization parameter, κ, is implemented in a Levenberg-Marquardt algorithm where it starts at a high value (typically 100) and is systematically reduced at each iteration. This iterative solution must be completed with the following matrix equation: At each iteration, the new set of μa and D values is updated by μa i+1=μa i+δμa i, and Di+1=Di+δDi, where i is the index for the iteration number. Also, the value of the Jacobian matrix is updated at each iteration in order to provide a correction to the sensitivity matrix for changes in the coefficient maps. A significant change to Eq. (6) was introduced by Dehghani26 by adding the adjoint method of calculating the Jacobian, and using the Moore-Penrose pseudoinverse instead of the direct inverse.The FEM reconstruction program is based on the frequency-domain diffusion equation and allows recovery of images of μa and μs ′ from the measured data. The FEM solution of the diffusion equation on a circular mesh determines a dataset calculated from an initial estimate of the average optical properties (μa,μs ′) obtained from a calibration procedure. In order to initiate the Newton-Raphson minimization with Levenberg-Marquadt regularization, an initial estimate of the optical properties is obtained from a separate minimization algorithm. The accurate implementation of an initial estimate has been found to be essential for achieving a good solution to the image recovery problem described here. This homogeneous estimate uses the same forward FEM solver, but with the data averaged over all source positions and the assumption of homogeneous μa and μs ′ throughout the circular mesh. The details of the reconstruction program and homogeneous fitting algorithm can be found elsewhere.26 27 28 2.3.Spectral Decomposition SoftwareAn important feature of NIR imaging is the ability to provide information about different absorbing molecules and scatterers within tissue. When spectral analysis is used with NIR imaging, a number of chromophores can be deconvolved, assuming that a sufficient number of wavelengths are measured to provide the information required. In single-point measurement systems such as those demonstrated by Cerussi et al.;,1 Shah et al.;,2 and Tromberg et al.;,29 it is relatively easy to sample multiple wavelengths and solve for the concentrations of chromophores present. If the absolute absorption coefficient at any wavelength can be calculated based upon a diffusion theory analysis of the data, then this coefficient is assumed to be a linear combination of the absorption that is due to all relevant chromophores in the sample, each having a well-characterized molar absorption coefficient, ε, leading to the equation: where C is the concentration of each chromophore, with index i, under the assumption that there are only N relevant chromophores present in the tissue at wavelength λ. In Fig. 3(a), the absorption coefficient spectra of oxyhemoglobin, deoxyhemoglobin, and water are shown over the relevant wavelength range used here, assuming concentrations of 0.5, 0.5, and 30, respectively, as a percent volume of the whole tissue. A linear combination of these spectra is used to match the measured absorption coefficient spectra at the six discrete wavelengths in order to determine the estimated concentrations of each chromophore.Figure 3Measurements from breast tissue have indicated that in the wavelength band of 650 to 850 nm, the dominant contributions to absorption are oxyhemoglobin, deoxyhemoglobin, and water, and representative absorption spectra are shown for each of these in (a) to illustrate their contribution to the overall absorption coefficient measured at each wavelength. The scattering spectrum is more difficult to relate to specific tissue characteristics, so spectral decomposition into structural features is generally not possible. However, fitting spectra to a model function that approximates Mie theory provides a useful summary of the overall scattering features of tissue. (b) Reduced scattering coefficient values at six wavelengths are shown, along with the model function fit to the data.  When this spectral analysis is applied to tomographically reconstructed images, it requires that a spectrum of values for μa,k(λ) be obtained for all pixels within the image, using index “ k ” for the pixel number. Thus at every pixel location, the linear inversion of Eq. (7) must be calculated to determine the array of Ci values, given a well-known set of εi(λ) for the relevant chromophores, leading to the matrix equation: where C is now a vector of chromophore concentrations at each pixel location k; E is the matrix of molar extinction coefficients having elements ε(i,λj), for each of the N chromophores at j and wavelength λj; and μa is the vector of absorption coefficients at each wavelength λ for each pixel location k. Applying this approach with an unconstrained linear fitting to matrix Eq. (8), we used multispectral tomographic data to derive images of oxyhemoglobin and deoxyhemoglobin. Clinical trials studying the value of hemoglobin and water images are under way to determine the accuracy and diagnostic value of these functional maps.The scattering spectrum of tissue provides information about the nature of the scattering particles and hence the composition of the tissue. Since the scattering occurs predominantly from Mie-sized particles, it has been observed that the general trend in a scattering coefficient is to decrease subtly with increasing wavelength, and that this curve is well fit by a power law of the type: where A and SP are arbitrary model parameters for amplitude and scattering power, respectively.1 30 31 In this situation, as the scattering centers decrease in size, the value of SP increases significantly, because the scattering takes on a shape more indicative of Rayleigh scattering, where SP=4 is well established. As the scattering objects become larger sizes, with dimension ≫λ, the value of SP decreases to zero. In tissue, typical values range between 0.1 and 0.3.32 33 In the 1 Intralipid solutions that are used to mimic the scattering of soft tissues, the value is SP=0.24. 30 Typical scattering spectral values at the six measurement wavelengths are shown in Fig. 3(b), along with the least-squares fit of Eq. (9) to the data.One of the major structural features of breast tissue is the large adipose fraction typically near the periphery of the breast, which is thought to be an average of nearly 75 in women. However, a large variation exists among individuals, based on body mass index and breast size.34 In the interior of the breast there is often glandular tissue, which has a higher blood content and hence higher water content. This area is thought to have a higher scattering power, perhaps owing to smaller scattering sites, although the origin of the scattering has not been established clearly.34 In areas of adipose tissue where fat content is high, the scattering power is lower, again perhaps because of the larger scattering centers of the lipid-filled cellular space. In our images of scattering power, we see this trend in most cases, where the scattering power is highest in the interior of the breast and decreases toward the exterior. Further study of the scattering power and its ability to predict valuable information about the tissue is needed. 2.4.Human Subject StudiesOver the past 6 years, NIR spectral imaging has been used to analyze breast composition from more than 120 female subjects, with approximately half being normal and half being abnormal.35 36 In this paper we present analyses from a selected subset of the normal subject imaging exams in order to interpret the breast changes and intersubject variability with an eye toward comparing these results with findings from abnormal subjects findings. The clinical examination protocol was approved by the institutional committee for the protection of human subjects, and written consent was obtained from all participating women. The age range of the subjects recruited was typically 40 to 80 years, but a few participants outside this age range were examined. The results from representative breast images where cancer tumors were present are shown. The majority of the recent images are part of a blind clinical trial assessing the ability of NIR imaging to detect and characterize breast lesions, and so only representative abnormal cases can be presented here prior to completion of the study. A subset of seven women who were premenopausal was studied in detail to examine the physiological variations in the breast that are due to menstrual cycle changes. These women were specifically chosen to have ACR1 mammograms and heterogeneously dense breast tissue, and were not taking any hormone replacement therapies. The age range was from 41 to 47, with an average of 45 years. These women were imaged at two time points during their menstrual cycle over two complete cycles, providing four sets of images, with two during the first phase (follicular) and two during the second phase (secretory) of their cycle. Images of total hemoglobin, oxygen saturation, water fraction, scattering power, and scattering amplitude were generated. A second subset of 39 women who had normal mammograms (ACR1 category) was imaged to examine the intersubject variation in normal breast tissue properties. In preliminary studies,34 36 it was observed that there is a strong correlation between radiographic density categorization and certain NIR parameters. We followed up this observation to specifically examine variation with breast density in this larger subset of our clinical exams. The participants had a range of differing radiographic densities and were classified in one of four categories: (1) fatty, (2) scattered, (3) heterogeneously dense, and (4) extremely dense. None of these subjects were known to have any form of breast disease at the time of examination. Classification and reading of mammograms were completed by two expert radiologists in the Breast Imaging Center of the Dartmouth Hitchcock Medical Center. Radiographic density was assessed from all three projection images from mammography, and the classification was made from assessment of the entire composition of the breast. The NIR breast examinations were carried out following procedures described elsewhere.35 36 3.Results3.1.Typical NIR Images In VivoImaging of women with abnormal mammograms has indicated that some lesions present increases in hemoglobin relative to the background tissue and relative to the contralateral breast tissue. A typical image from one breast of a subject is shown in Fig. 4, where a lesion was diagnosed from both core needle biopsy and excisional analysis to be a ductal carcinoma in situ with a size of 5 to 10 mm. In Fig. 4, a single plane is shown where the presence of the lesion is observable in the middle top of the hemoglobin image. Other features also exist in the image, which are most likely associated with glandular tissues, although they require further study to confirm their composition. Six images of absorption coefficient and reduced scattering coefficient were reconstructed for this plane, and the resulting spectral fits produce the images of total hemoglobin, oxygen saturation, water fraction, scattering amplitude, and scattering power, which are all contained in Fig. 4. This spectral imaging was completed for two planes in the symptomatic breast and one plane in the contralateral breast. The full set of images of hemoglobin is shown in Fig. 5, where the presence of the lesion is strongest in the image shown in Fig. 5(b). The image of the contralateral breast in Fig. 5(c) shows that localized heterogeneities are all significantly lower than that observed in the symptomatic breast. Figure 4The images in this figure are reconstructed from frequency-domain NIR measurements through one plane of a woman’s breast. The images in the top row show absorption coefficient estimates at all six wavelengths of 661, 761, 785, 808, 826, and 849 nm. The images in the middle row show the corresponding reconstructions of the reduced scattering coefficient at all six wavelengths. The five images in the bottom row have been calculated from spectral fitting of the middle row images, to estimate total hemoglobin, oxygen saturation, water fraction, and scattering amplitude, and scattering power.  Figure 5Images from the same subject as in Fig. 4 showing in (a) and (b) total hemoglobin maps for two planes in the symptomatic breast and (c) for one plane imaged from the contralateral breast. Image (a) was above the plane of the abnormality while image (b) was in the plane of the abnormality. Fine-needle and excisional biopsies confirmed that the lesion near the bottom of image (b) was a ductal carcinoma in situ.  This type of imaging was completed on a large number of subjects, and subsets of the imaging groups were analyzed for interpretation of variation within subjects and among subjects. Colocalized MRI and NIR imaging is also being developed to help determine the origin of other spectral features that appear in the images. In this case, the localized tumor appears with 100 to 200 contrast relative to the background, depending upon the assumptions used to define the background. 3.2.Menstrual Cycle StudiesThe premenopausal group of seven subjects was studied over four successive visits in which two exams occurred during the follicular phase of the cycle (7 to 14 days of the cycle; phase 1) and two exams during the secretory phase (21 to 28 days of the cycle; phase 2). Three planes (separated by 1 cm) along the breast from the chest wall toward the nipple were measured in a single positioning of the fiber array. A set of measurements was obtained from each breast, providing a total of six planes of information. The data for total hemoglobin from each plane of each subject were acquired sequentially and are plotted in Fig. 6, where the values for phase 1 are plotted against the corresponding values for phase 2. There is a large variation, but there is a significant trend of increasing hemoglobin in the second phase, by 2.6 μm, or 13 of the average hemoglobin concentration in the breast (p<0.0001, with a paired Student’s t -test). The seven individual hemoglobin changes are plotted in Fig. 7 and were 0.67, 0.76, −0.3, 5.7, −1.3, 4.35, and 0.50 μm, or 3.7, 2.9, −1.2, 28.9, −5.6, 21.7, and 2.2 of the phase 1 values. Quantitative analysis of the average changes in oxygen saturation, water fraction, scattering power, and scattering amplitude did not demonstrate any statistically significant differences between the phase 1 and phase 2 measurements when all subjects were grouped together. The individual differences for each subject are plotted in Fig. 7 for these four quantities. Figure 6Menstrual cycle variations in tissue composition were measured in seven subjects, within three planes in each breast, during the first and last phases of the menstrual cycle. Each woman was followed through two menstrual cycles, and the data on total hemoglobin estimate are shown for each subject in each plane in each breast. The clustering of the data above the line illustrates that there is a significantly higher hemoglobin concentration in the breast in the second phase of the cycle, when all data are compared with a Student’s t -test (p<10−5).  Figure 7In these plots, the absolute changes in (a) hemoglobin, (b) oxygen saturation, (c) water, (d) scattering power, and (e) scattering amplitude are shown for each of the seven subjects. These values are reported as averages over all planes from both breasts, with the error bars showing the standard error of the mean in each case. 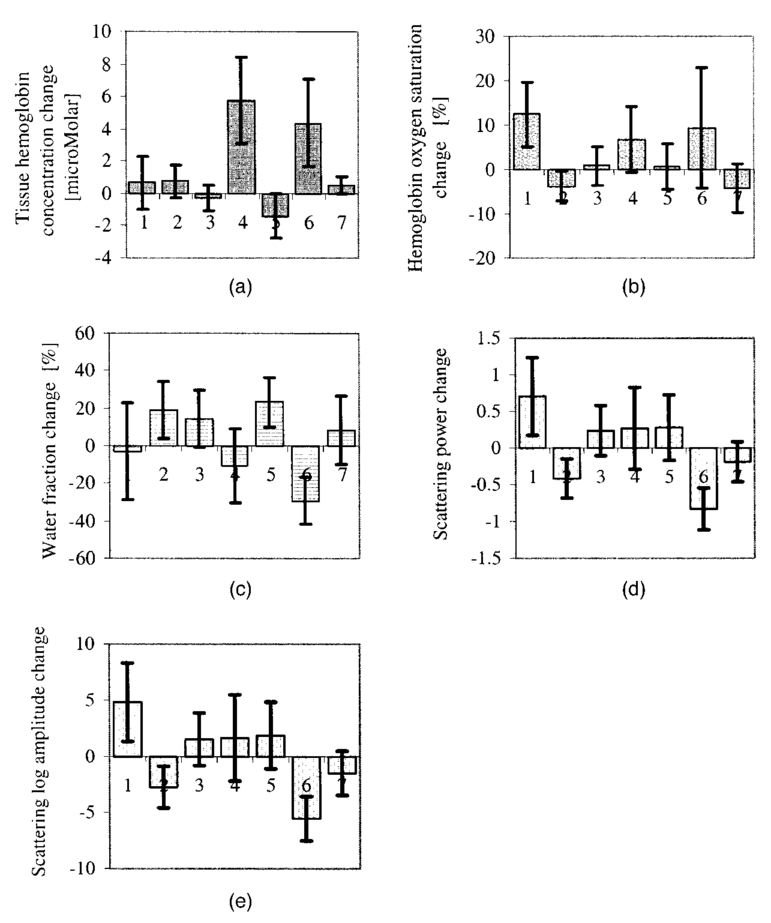 3.3.Normal Intersubject VariationA subset of our data from imaging subjects over several years was used to examine the variation in NIR properties among women, based on using radiographic density as a surrogate marker of tissue composition. A group of thirty-nine subjects was used to plot values for the different radiographic densities, as shown in Fig. 8. The radiographic densities of (1) fatty, (2) scattered, (3) heterogeneously dense, and (4) extremely dense are denoted by different symbols in these graphs. There was no ability to separate radiographic densities based upon oxygen saturation, but hemoglobin values are significantly different between groups 1 and 3, 1 and 4, 2 and 3, and 2 and 4 (p<0.001). Scattering power is also significantly different between groups 1 and 2, 1 and 3, 1 and 4, 2 and 3, and 2 and 4 (p<0.05). Unfortunately there were probably not enough subjects in the extremely dense category to allow sufficient statistical power when comparing groups 3 and 4. It is interesting though, if groups 1 and 2 are taken together as low density, and groups 3 and 4 are taken together as high density, then hemoglobin, scattering power, and scattering amplitude are all significantly different among these densities (p<10−4). Conversely, the values for oxygen saturation and water fraction are quite scattered in each category and are not significantly different based upon breast radiographic density. The absolute value averages for all NIR properties and associated standard deviations are shown in Table 1, separated into the four groups of radiographic densities. Figure 8Average breast data from a group of normal subjects of mixed pre- and postmenopausal status. The data are divided into the radiographic density categories of (1) fatty, (2) scattered, (3) heterogeneously dense, and (4) extremely dense. (a) The oxygen saturation from each breast is shown against the total hemoglobin in the same breast. (b) The scattering power is plotted against the total hemoglobin for the same subjects.  Table 1
4.DiscussionHemoglobin imaging can provide very high contrast for certain types of lesions. Because the dominant factor causing absorption is hemoglobin, the fraction of hemoglobin or the functional vessel density of a tissue defines the absorption-based attenuation that will be detected. The relative difference between a tissue to be imaged and its background defines the available contrast, and based upon the data shown here and our experiences described in previous publications,1 13 35 37 38 it appears that the total hemoglobin contrast is nearly 100 to 200 for cancer tumors within the background of normal breast tissue. This contrast level is extremely high, perhaps higher than the intrinsic contrast of any other imaging modality used today. Of course this ultrahigh contrast is offset by the modest spatial resolution that can be achieved with NIR image reconstruction. Because of the diffuse light path that is taken between source and detectors, it appears unlikely that major advances in the spatial resolution will occur in the near future. Perhaps one of the most promising directions for improving spatial resolution is to couple the NIR reconstruction to another modality that provides higher structural information, such as ultrasound, computed tomography (CT), or MRI. Investigations into MRI-guided NIR imaging are under way and should reveal potential solutions for improving resolution. Another factor of importance in evaluating NIR imaging is assessment of tumor contrast relative to the typical variations observed in normal tissues, both longitudinally over time as well as among different women. In this study we have been able to quantify the bulk average values of subjects in both of these terms, and can estimate changes related to menstrual cycle variations and inherent compositional differences as reflected by radiographic density. Menstrual cycle changes in breast composition are generally accepted, yet quantitative measurements of these changes are somewhat less traceable. While these changes have been known qualitatively, Vogel et al.;39 quantified the variations from histological examination of normal breast tissue removed from women. The specific phases of the cycle are (1) a proliferative phase (days 3 to 7), (2) a follicular phase of differentiation (days 8 to 14), (3) a luteal phase of differentiation (days 15 to 20), (4) a secretory phase (days 21 to 27), and (5) a menstrual phase (days 28-2). Vogel found that changes consistent with reduced metabolism are observed in the follicular phase, whereas increased metabolic activity is observed in the secretory, menstrual, and proliferative phases. In our study, the subjects were examined in the follicular phase (called phase 1 here) and in the secretory phase (called phase 2 here). The menstrual cycle changes observed for hemoglobin concentration are in reasonably good agreement with those of parenchymal cellular proliferation increasing in phase 2 of the menstrual cycle, as observed by Potten et al.;15 and Going et al.;,14 and with a maximum average increase in fibroglandular tissue volume of 10 observed by Graham et al.;17 Here, there was a 13 overall average change in total hemoglobin. As observed by Graham et al.;, there was considerable intersubject variation in these changes, indicating that it is most likely difficult to make generalized observations about the average tissue changes. It is possible that certain subjects consistently exhibit larger variations than others; however, further study of the magnitude and repeatability of these changes would be required to confirm this hypothesis. Since whole breast values were quantified here, it is likely that increases in hemoglobin would be correlated with increases in fibroglandular breast volume since this is the fraction of the breast that has the most dominant vascularity. In interpreting our menstrual cycle variation data here, it is important to note that the age range of these seven subjects was 41 to 47 with an average age of 45, so they were actually all quite close to menopause age. Thus it is reasonable to expect that a younger group of subjects might exhibit stronger and overall more systematic fluctuations in breast composition. Nonetheless, we specifically chose this age range for our subjects because it is the relevant age for patients who are likely not to receive routine mammography screening, but are at a higher risk of developing breast cancer. Further studies of menstrual cycle variations in younger women are important to augment what is presented here. Finally, it is important to note that the changes were most dominant in only two subjects, whereas of the other five, three were positive but not significant alone and two were negative changes but not significant alone. These data are in relatively good agreement with the individual cases presented by Shah et al.;2 and Cubbedu et al.;,19 where in the Shah data the individual patient’s total hemoglobin varied from 3.1 to 4.7 μM in the cycle and in the Cubbedu study the total hemoglobin varied from near 48 to near 80 μM, when transmission data were used. The intersubject variations observed appear to be high in all studies, and thus the heterogeneity of changes among subjects is an important issue and one that will likely require the study of large numbers of subjects in order to reach useful conclusions. As part of the second goal of this paper, we wanted to be able to quantify the typical range of variations observed in normal subjects for hemoglobin, oxygen saturation, water, and scattering. These variations are plotted in Fig. 8 for a subset of thirty-nine normal subjects who were imaged. They were divided into different radiographic density categories (1 through 4) simply to provide an initial grouping of breasts with specific tissue types. Since fatty tissue is likely to have substantially different NIR chromophore composition than dense fibroglandular tissues, radiographic density is a reasonable criterion for grouping the breasts. In previous studies, Shah et al.;2 indicated that total hemoglobin values in a range of subjects varied from 2 to 26 μM on average, whereas Cubbedu et al.;19 indicated values nearer 35 to 80 μM. Our values fall within these large and widely varying ranges. The average values listed in Table 1 can be used to interpret how much the background values of each quantity vary among subjects. For example, variation among the hemoglobin in the breast ranges from 9 up to 45 μM in absolute range, or 15 up to 30 μM for average values. This represents a very large range of values, indicating that vascular density must vary considerably among these breast density types. In contrast, oxygen saturation varies over an absolute range from 30 up to 76; and yet, average values for the different breast categories are all within the range of 60±2, indicating that there is no difference in breast tissue oxygenation based upon radiographic density. However, other factors likely influence the oxygenation differences among breasts. Further study of the ability to use oxygen saturation as a useful parameter is most likely required, perhaps with focus on the dynamics in response to a stimulus, rather than the absolute value in a resting state. A considerable amount of data are being developed on the NIR properties of tumors, but assuming that the contrast is largely due to blood volume in the tumor, it is relatively clear that the contrast observed from a tumor in normal tissue will be affected by the normal tissue values. In our studies of tumors, it appears that cancer tumors have higher total hemoglobin; however, a detailed analysis of the contrast available needs to be carried out to see how much the intersubject variation in total hemoglobin affects the ability to detect or characterize changes in the total hemoglobin spatially. Thus, as the large contrast is exploited to image and characterize lesions within the breast, it will likely be essential to interpret the changes in hemoglobin and other NIR parameters relative to the background properties of the same breast and to avoid numerical comparisons of the absolute values among breasts. The large variation in scattering power and scattering amplitude among subjects with different radiographic densities is interesting, and most likely is a measure of the dominant compositional changes among these different breast types.33 In particular, the index of refraction and size of particles causing scattering changes as the composition varies from a fatty one to a glandular or a fibrous one. The exact features that contribute to bulk scattering coefficients in tissue are extremely hard to identify because these are contributions from a number of structural components of the tissue. However, it is clear that there are significant changes in the scattering power and amplitude as the bulk composition changes across different radiographic densities. Further microscopic study of what causes these changes would be an important line of research. The strong correlation between radiographic density and NIR parameters may possibly provide a useful tool for assessing breast physiology and potential risks of disease. NIR spectroscopy has been used to classify tissues according to breast density in larger population studies.40 41 Our results indicate that the spectral features responsible for these correlations are most likely predominantly due to hemoglobin and scattering differences. Since the use of mammography has become the primary form of clinical screening for breast disease in older women, large epidemiological studies have demonstrated that radiographic density is correlated to risk of developing breast cancer.42 43 The reasons for this are difficult to determine and a causal relationship has not been demonstrated, although many studies are under way to examine the features of the breast that are likely to be the origin of disease.44 It is a challenge to elucidate the causal link between density and risk of cancer because the tools to measure breast composition are limited. In this context, near-infrared measurements do provide an independent measure of tissue, where the contrast is based upon the elastic scattering of light and the absorption that is due to molecules present, such as water and hemoglobin. In addition, irrespective of the causal relationship between radiographic density and risk, mammography is the main screening tool available for assessing the breast, and it is becoming clear that women with breasts of higher radiodensity should probably be screened at an earlier age and perhaps screened more frequently than those in a lower risk category.45 If near-infrared imaging can be implemented in a low-cost manner, then scanning subjects at an earlier age would be feasible, potentially as a method to categorize the tissue composition and risk of developing disease. AcknowledgmentsThis work has been funded by National Cancer Institute grants RO1CA69544 and PO1CA80139. REFERENCES
A. E. Cerussi
,
A. J. Berger
,
F. Bevilacqua
,
N. Shah
,
D. Jakubowski
,
J. Butler
,
R. F. Holcombe
, and
B. J. Tromberg
,
“Sources of absorption and scattering contrast for near-infrared optical mammography,”
Acad. Radiol. , 8
(3), 211
–208
(2001). Google Scholar
N. Shah
,
A. Cerussi
,
C. Eker
,
J. Espinoza
,
J. Butler
,
J. Fishkin
,
R. Hornung
, and
B. Tromberg
,
“Noninvasive functional optical spectroscopy of human breast tissue,”
Proc. Natl. Acad. Sci. U.S.A. , 98
(8), 4420
–4425
(2001). Google Scholar
B. J. Tromberg
,
N. Shah
,
R. Lanning
,
A. Cerussi
,
J. Espinoza
,
T. Pham
,
L. Svaasand
, and
J. Butler
,
“Non-invasive in vivo characterization of breast tumors using photon migration spectroscopy,”
Neoplasia , 2
(1–2), 26
–40
(2000). Google Scholar
B. W. Pogue
,
S. Geimer
,
T. O. McBride
,
S. Jiang
,
U. L. O¨sterberg
, and
K. D. Paulsen
,
“Three-dimensional simulation of near-infrared diffusion in tissue: boundary condition and geometry analysis for finite-element image reconstruction,”
Appl. Opt. , 40
(4), 588
–600
(2001). Google Scholar
K. J. Robinson
,
C. J. Kotre
, and
K. Faulkner
,
“The use of contrast-detail test objects in the optimization of optical density in mammography,”
Br. J. Radiol. , 68 277
–282
(1995). Google Scholar
N. F. Boyd
,
B. O’Sullivan
,
E. Fishell
,
I. Simor
, and
G. Cooke
,
“Mammographic patterns and breast cancer risk: methodologic standards and contradictory results,”
J. Natl. Cancer Inst. , 72
(6), 1253
–1259
(1984). Google Scholar
N. F. Boyd
,
G. A. Lockwood
,
J. W. Byng
,
D. L. Tritchler
, and
M. J. Yaffe
,
“Mammographic densities and breast cancer risk,”
Cancer Epidemiol. Biomarkers Prev. , 7
(12), 1133
–1144
(1998). Google Scholar
J White
,
“Breast density and cancer risk: what is the relationship?,”
J. Natl. Cancer Inst. , 92
(6), 443
(2000). Google Scholar
C. H. van Gils
,
J. H. Hendriks
,
R. Holland
,
N. Karssemeijer
,
J. D. Otten
,
H. Straatman
, and
A. L. Verbeek
,
“Changes in mammographic breast density and concomitant changes in breast cancer risk,”
Eur. J. Cancer Prev., 8
(6), 509
–515
(1999). Google Scholar
I. R. Young
,
“Considerations affecting signal and contrast in NMR imaging,”
Br. Med. Bull. , 40
(2), 139
–147
(1984). Google Scholar
A. E. Profio
and
G. A. Navarro
,
“Scientific basis of breast diaphanography,”
Med. Phys. , 16 60
–65
(1989). Google Scholar
V. Ntziachristos
and
B. Chance
,
“Probing physiology and molecular function using optical imaging: applications to breast cancer,”
Breast Cancer Res. Treat. , 3
(1), 41
–46
(2001). Google Scholar
J. J. Going
,
T. J. Anderson
,
S. Battersby
, and
C. C. A. MacIntyre
,
“The correlation of histologic changes in the human breast with the menstrual cycle,”
Am. J. Pathol. , 130 193
–204
(1988). Google Scholar
C. S. Potten
,
R. J. Watson
,
G. T. Williams
,
S. Tickle
,
S. A. Roberts
,
M. Harris
, and
A. Howell
,
“The effect of age and menstrual cycle upon proliferative activity of the normal human breast,”
Br. J. Cancer , 58 163
–170
(1988). Google Scholar
P. A. Fowler
,
C. E. Casey
,
G. G. Cameron
,
M. A. Foster
, and
C. H. Knight
,
“Cyclic changes in composition and volume of the breast during the menstrual cycle, measured by magnetic resonance imaging,”
Br. J. Obstet. Gynaecol. , 97 595
–602
(1990). Google Scholar
S. J. Graham
,
P. L. Stanchev
,
J. O. A. Lloyd-Smith
,
M. J. Bronskill
, and
D. B. Plewes
,
“Changes in fibroglandular volume and water content of breast tissue during the menstrual cycle observed by MR imaging at 1.5T,”
J. Magn. Reson Imaging , 5 696
–701
(1995). Google Scholar
M. Muller-Schimpfle
,
K. Ohmenhauser
,
P. Stoll
,
K. Deitz
, and
C. D. Claussen
,
“Menstrual cycle and age: influence of parenchymal contrast medium enhancement in MR imaging of the breast,”
Radiology , 203 145
–149
(1997). Google Scholar
R. Cubeddu
,
C. D’Andrea
,
A. Pifferi
,
P. Taroni
,
A. Torricelli
, and
G. Valentini
,
“Effects of the menstrual cycle on the red and near-infrared optical properties of the human breast,”
Photochem. Photobiol. , 72
(3), 383
–391
(2000). Google Scholar
T. O. McBride
,
B. W. Pogue
,
S. Jiang
,
U. L. Osterberg
, and
K. D. Paulsen
,
“Development and calibration of a parallel modulated near-infrared tomography system for hemoglobin imaging in vivo,”
Rev. Sci. Instrum. , 72
(3), 1817
–1824
(2001). Google Scholar
M. S. Patterson
,
B. C. Wilson
, and
D. R. Wyman
,
“The propagation of optical radiation in tissue. I. Models of radiation transport and their application,”
Lasers Med. Sci. , 6 155
–168
(1990). Google Scholar
M. S. Patterson
,
B. C. Wilson
, and
D. R. Wyman
,
“The propagation of optical radiation in tissue. II. Optical properties of tissues and resulting fluence distributions,”
Lasers Med. Sci. , 6 379
–390
(1990). Google Scholar
K. D. Paulsen
and
H. Jiang
,
“Spatially varying optical property reconstruction using a finite-element diffusion equation approximation,”
Med. Phys. , 22
(6), 691
–701
(1995). Google Scholar
K. D. Paulsen
and
H. Jiang
,
“An enhanced electrical impedance imaging algorithm for hyperthermia applications,”
Int. J. Hyperthermia , 13
(5), 459
–480
(1997). Google Scholar
H. Dehghani
,
B. W. Pogue
,
S. P. Poplack
, and
K. D. Paulsen
,
“Multiwavelength three-dimensional near-infared tomography of the breast: initial simulation, phantom and clinical results,”
Appl. Opt. , 42
(1), 135
–145
(2003). Google Scholar
H. Dehghani
,
B. W. Pogue
,
S. Jiang
,
B. Brooksby
, and
K. D. Paulsen
,
“Three-dimensional optical tomography:resolution in small object imaging,”
Appl. Opt. , 42
(16), 3117
–3128
(2003). Google Scholar
T. O. McBride
,
B. W. Pogue
,
U. L. O¨sterberg
, and
K. D. Paulsen
, Adv. Exp. Med. Biol. , 531 85
–100
(2003). Google Scholar
B. J. Tromberg
,
O. Coquoz
,
J. B. Fishkin
,
T. Pham
,
E. R. Anderson
,
J. Butler
,
M. Cahn
,
J. D. Gross
,
V. Venugopalan
, and
D. Pham
,
“Non-invasive measurements of breast tissue optical properties using frequency-domain photon migration,”
Philos. Trans. R. Soc. London, Ser. B , 352 661
–668
(1997). Google Scholar
H. J. van Staveren
,
C. J. M. Moes
,
J. van Marle
,
S. A. Prahl
, and
M. J. C. van Gemert
,
“Light scattering in Intralipil-10 in the wavelength range of 400–1100 nm,”
Appl. Opt. , 30
(31), 4507
–4514
(1991). Google Scholar
T. O. McBride
,
B. W. Pogue
,
S. Jiang
,
U. L. Osterberg
,
K. D. Paulsen
, and
S. P. Poplack
,
“Multi-spectral near-infrared tomography: a case study in compensating for water and lipid content in hemoglobin imaging of the breast,”
J. Biomed. Opt. , 7
(1), 72
–79
(2001). Google Scholar
B. Beauvoit
,
H. Liu
,
K. Kang
,
P. D. Kaplan
,
M. Miwa
, and
B. Chance
,
“Characterization of absorption and scattering properties for various yeast strains by time-resolved spectroscopy,”
Cell Biophys. , 23
(1–3), 91
–109
(1993). Google Scholar
J. R. Mourant
,
J. P. Freyer
,
A. H. Hielscher
,
A. A. Eick
,
D. Shen
, and
T. M. Johnson
,
“Mechanisms of light scattering from biological cells relevant to noninvasive optical-tissue diagnostics,”
Appl. Opt. , 37
(16), 3586
–3593
(1998). Google Scholar
S. Srinivasan
,
B. W. Pogue
,
S. Jiang
,
H. Dehghani
,
C. Kogel
,
S. Soho
,
J. G. Chambers
,
T. D. Tosteson
,
S. P. Poplack
, and
K. D. Paulsen
,
“Interpreting hemoglobin and water concentration, oxygen saturation, and scattering measured by near-infrared tomography of normal breast in vivo,”
Proc. Natl. Acad. Sci. U.S.A. , 100
(21), 12349
–12354
(2003). Google Scholar
B. W. Pogue
,
S. P. Poplack
,
T. O. McBride
,
W. A. Wells
,
O. K. S.
,
U. L. Osterberg
, and
K. D. Paulsen
,
“Quantitative hemoglobin tomography with diffuse near-infrared spectroscopy: pilot results in the breast,”
Radiology , 218
(1), 261
–266
(2001). Google Scholar
B. Chance
,
Q. Luo
,
S. Nioka
,
D. C. Alsop
, and
J. A. Detre
,
“Optical investigations of physiology: a study of intrinsic and extrinsic biomedical contrast,”
Philos. Trans. R. Soc. London, Ser. B , 352 707
–716
(1997). Google Scholar
B. W. Pogue
and
T. Hasan
,
“Targeting in photodynamic therapy and photo-imaging,”
Opt. Photonics News , 14
(8), 36
–43
(2003). Google Scholar
P. M. Vogel
,
N. G. Georgiade
,
B. F. Fetter
,
F. S. Vogel
, and
K. S. McCarty
,
“The correlation of histologic changes in the human breast with the menstrual cycle,”
Am. J. Pathol. , 104 23
–34
(1981). Google Scholar
N. F. Boyd
,
J. W. Byng
,
R. A. Jong
,
E. K. Fishell
,
L. E. Little
,
A. B. Miller
,
G. A. Lockwood
,
D. L. Tritchler
, and
M. J. Yaffe
,
“Quantitative classification of mammographic densities and breast cancer risk: results from the Canadian National Breast Screening Study,”
J. Natl. Cancer Inst. , 87
(9), 670
–675
(1995). Google Scholar
J. W. Byng
,
M. J. Yaffe
,
R. A. Jong
,
R. S. Shumak
,
G. A. Lockwood
,
D. L. Tritchler
, and
N. F. Boyd
,
“Analysis of mammographic density and breast cancer risk from digitized mammograms,”
Radiographics , 18
(6), 1587
–1598
(1998). Google Scholar
N. F. Boyd
,
G. A. Lockwood
,
L. J. Martin
,
J. W. Byng
,
M. J. Yaffe
, and
D. L. Tritchler
,
“Mammographic density as a marker of susceptibility to breast cancer: a hypothesis,”
IARC Sci. Publ. , 154 163
–169
(2001). Google Scholar
C. H. van Gils
,
J. D. Otten
,
J. H. Hendriks
,
R. Holland
,
H. Straatman
, and
A. L. Verbeek
,
“High mammographic breast density and its implications for the early detection of breast cancer,”
J. Med. Screen. , 6
(4), 200
–204
(1999). Google Scholar
|
||||||||||||||||||||||||||||||||||||


