|
|
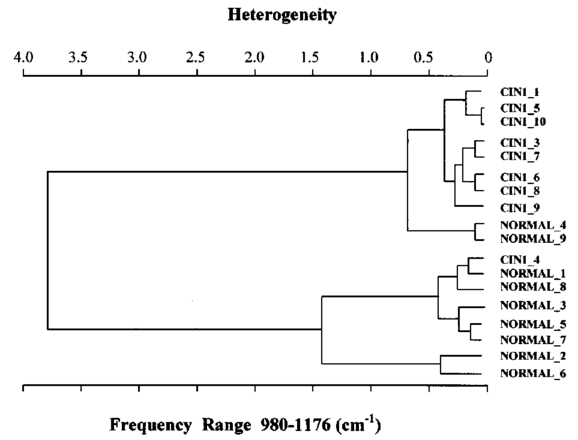
1.IntroductionSquamous intraepithelial lesion (SIL) or cervical intraepithelial neoplasia (CIN) is a disease of women in their reproductive years and is characterized by abnormal cellular proliferation, maturation, and cytological atypia such as hyperchromatic nuclei, abnormal chromatin distribution, and increased nuclear-cytoplasmic ratio1 (koilocytosis) in the cervix. Cervical neoplasia is categorized as low-grade squamous intraepithelial lesions (L-SIL), which includes the CIN1, and high-grade intraepithelial lesions (H-SIL) which includes2 CIN2 and CIN3. The prevalence of CIN in the general population has been attributed to many factors such as viral infections, smoking habits, and screening frequency for cervical disorders. Various approaches for detection of CIN included test for human papilloma virus3 (HPV) DNA, PAP (Papanicolaou) smear, monolayer cytology,4 examination of frozen sections,5 fluorescence spectroscopy,6 studies of chromosomal abnormalities,7 etc. However, the grading of the CIN was based on the severity in the histological or cytological findings. Thus, most of the data on CIN were based on PAP smears or on biopsy studies, which are subjective depending on the individual patients case history. It became important that a general set of classification be developed that can help to evaluate the disease based on more rudimentary and precise methods such as biochemical or biophysical analysis. Normally the onset of neoplasia in the cervical tissue indicated either cervical cancer or HPV infections.8 Pathologists have often characterized the onset of neoplasia using biopsies. This approach, however, was not very quantitative and relied a lot on the pathologist during the selection of accurate samples and regions in biopsies. Moreover, there was an element of human error involved. The involvement of HPV in the system9 made things further difficult to ascertain which of the cases would proceed to cervical cancer especially at the CIN1 stage, since reversion of the condition in patients have been observed.10 Thus, the accurate diagnosis of the stages is essential. Various approaches have been undertaken for diagnosis of premalignant neoplasia using methods such as PAP smear, polymerase chain reaction (PCR) of HPV DNA (Ref. 10), and fluorescence spectroscopy.6 However, the identification of the different stages of CIN and neoplasia classification on a quantitative and rational basis for the diagnostics purposes still remained a major challenge. It therefore became important that a quantitative method for evaluation of the degree of neoplasia be developed. An alteration in the biochemical composition of tissues occurs during the onset of cervical cancer and neoplasia.11 Several approaches have been used to quantitatively link biochemical changes during the onset of neoplasia and malignancy with spectral characteristics of tissue.12 13 However, these approaches involved sophisticated cell mechanisms and techniques to understand and interpret them. Fourier-transformed IR microspectroscopy (FTIR-MSP) has been shown to be a promising diagnostic tool to monitor biochemical changes in the tissues and cells by several groups14 15 16 in their experiments using exfoliated cervical cells and biopsies. Earlier works17 18 19 20 had shown that FTIR spectroscopy could be used to differentiate between normal and abnormal cells from the cervix. The changes in FTIR spectra in the cervical tissues due to the onset of dysplasia were reported by Chiriboga et al.;16 Similarly, Wood et al.;21 examined the utility of FTIR spectroscopy for diagnosis of cervical malignancy. However, there are several hurdles to be overcome in the use of FTIR spectroscopy for the diagnosis of abnormality in the cervix from data collection to final diagnosis.22 Proper absorption of IR by cervical tissues has been hindered due to presence of confounding variables that greatly alter the results and interpretations of the spectral data.23 24 Several approaches were undertaken to minimize the effect of these confounding factors to make the application of FTIR spectroscopy possible for cervical diagnosis.24 25 The utility of various methods for analysis of the data obtained from FTIR spectroscopy of cervical samples has been examined to test the efficiency of using these methods to increase the diagnostic potential of vibrational spectroscopy for cervical cancer and cervical abnormalities.26 27 In the study reported here, for the first time we use the FTIR-MSP technique to study the onset of premalignant neoplasia and its sensitivity and draw a quantitative relationship between spectral changes occurring in the tissue and the degree of pathogenesis. By the use of biopsies as samples, we overcame several of the confounding factors as well as verifying the measurement sites for absence of any possible interfering elements. Previously, the use of histology in tandem with FTIR MSP for diagnosis of liver abnormalities was tested by Chiriboga et al.;28 We carried out FTIR-MSP and histological studies of consecutive sections of biopsies from cervical patients. We report a quantitative approach wherein it is possible to differentiate between the normal and CIN1, which is often controversial in histology, and also show that contrary to normal beliefs, the CIN1 is more like normal cervix and it is biochemically more similar to the other forms of precancerous conditions. 2.Materials and Methods2.1.Sample PreparationFormalin-fixed, paraffin-embedded tissue from 38 patients with different stages of CIN were retrieved with their consent from the histopathology files of Soroka University Medical Center (SUMC), Beer-Sheva. A set of eight additional candidates without any evidence of cervical neoplasia on subsequent follow-up were selected and samples were taken from them for biopsy with their consent to act as the control group in the study. The tissue samples used in this study were selected to include one or more neoplastic regions with a clear premalignant stage whenever possible. The method of Argov et al.;29 was followed for sample preparation. Two adjacent paraffin sections were cut from each biopsy; one was placed on a zinc-selenium slide and the other on a glass slide. This procedure was carefully followed to ensure that the tissue sections were practically identical. The thickness of the tissue samples was 10 μm. The first slide was deparaffinized using xylol and alcohol and was used for FTIR measurements. The second slide was stained with hematoxylin and eosin for histology review. In cases where the biopsy contained regions with histological similarity to more than one neoplastic stage, the different regions were identified and measured separately with the help of an expert pathologist who distinguished the stages under a microscope. Thus, the number of samples for the different stages was greater than the total number of patients in the study. 2.2.FTIR-MSPBiopsies from cervices of patients were obtained from SUMC. From each biopsy two thin (10-μm) sections, one for histological review and one for FTIR-MSP measurements were cut. An expert pathologist examined the tissue histology online to ensure accurate determination of the measured microscopic site. The sections were examined under a Zeiss microscope, and circular areas with 50-μm diameters were marked for measurement. The areas of measurements were selected keeping in view the occurrence and the diagnostic features of the neoplasia as described.30 31 Measurements on biopsies were performed using the FTIR microscope IRscope II with a liquid nitrogen cooled mercury-cadmium-telluride (MCT) detector, coupled to the FTIR spectrometer16 17 18 (Bruker Equinox model 55/S, OPUS software). In our study, 46 (38 CIN cases and 8 controls) different samples were used, and from each patient at least one CIN stage was measured. To achieve a high signal-to-noise ratio (SNR), 256 coadded scans were collected in each measurement in the wavenumber region 600 to 4000 cm−1. The spectra were baseline corrected using OPUS software. The spectra were normalized to the amide I (around 1652 cm−1) absorbance peak for subsequent calculations and analysis. Normalization to amide II did not significantly alter the results. 2.3.Multiscale Decomposition by the Fast Wavelet Transform (FWT) and Probabilistic Neural Networks for Prediction of CINIn this paper, the FWT proposed by Mallat and Zhong32 was applied. The sampled spectrum was decomposed into an orthogonal set of waveforms that are the dilations, translations, and modulations of the Coiflet wavelet (mother wavelet). The Coiflet wavelet was chosen because in practice it showed better results than other common wavelets that were tested. The wavelet transform was computed by convolving the spectrum with these dilated wavelets and provided an important tool for signal analysis and feature extraction.33 It provided a good local representation of the signal in both the time domain and the frequency domain. Unlike the Fourier transform, which is global and provides a description of the overall regularity of the signals, the wavelet transform looks for the spatial distribution of singularities. This transform suits the sampled signal that contains normal singular events such as the peaks observed at the phosphate bands carbohydrate bands or DNA region. Specht34 described the probabilistic neural networks (PNNs) paradigma. The network structure is similar to that of the multilayer perceptron (MLP) described earlier.35 36 The main difference is that the sigmoid activation function is replaced by an exponential function. The wavelets’ coefficients of the different scales offer a compact representation of the spectrum signal. The numbers of scales are chosen by searching for the optimal signal representation. It was found that scales higher than the first five did not add significant information about the spectrum. 2.4.Cluster AnalysisThe Ward’s minimum variance method provided with the OPUS software was used for the cluster analysis. The spectra of nine controls and an equal number of CIN1 patients were used for analysis. The analysis was performed in the region 980 to 1176 cm−1 to differentiate between these two groups, which is more difficult using conventional histopathology than differentiating between normal and CIN2 and CIN3. 3.Results3.1.Histopathological StudiesFigures 1(a) to 1(d) show the normal tissue and the various stages of cervical intraepithelial neoplasia. These stages were distinguished based on their histological features as seen under the microscope with eosin-haematoxylin staining. The most prominent features distinguishing the stages were the perinuclear clearing and the level of dysplasia. Thus, the CIN1 stage was mildly dysplastic while the CIN2 stage was moderately dysplastic. Severe dysplasia was seen in cases of CIN3, which is considered as cancer in situ. The staging of the neoplasia was as reported.30 It was seen that while CIN1 was not very distinct from the normal tissue, the CIN2 measured in the basal two-thirds showed abnormal cytological features. Similarly, the CIN3 was spread across the entire depth of the squamous epithelium, which had abnormal histopathological features as compared to the normal tissue. The presence of koilocytic cells differentiated the CIN1 from the normal squamous epithelium. However, the subtle changes in the biochemical composition were not visible in such sections. Thus, the IR spectra of biopsies were compared to detect biochemical alterations and for diagnostic purposes. Figure 1Histopathological sections of biopsies representative of the various CIN stages showing regions of measurements in the FTIR-MSP: (a) normal cervical tissue, (b) tissue with lesions showing CIN1, (c) tissue showing CIN2, and (d) tissue section showing CIN3. The boxes represent B, basal layer; M, region of measurement of spectra; BV, blood vessels; and S, stroma. 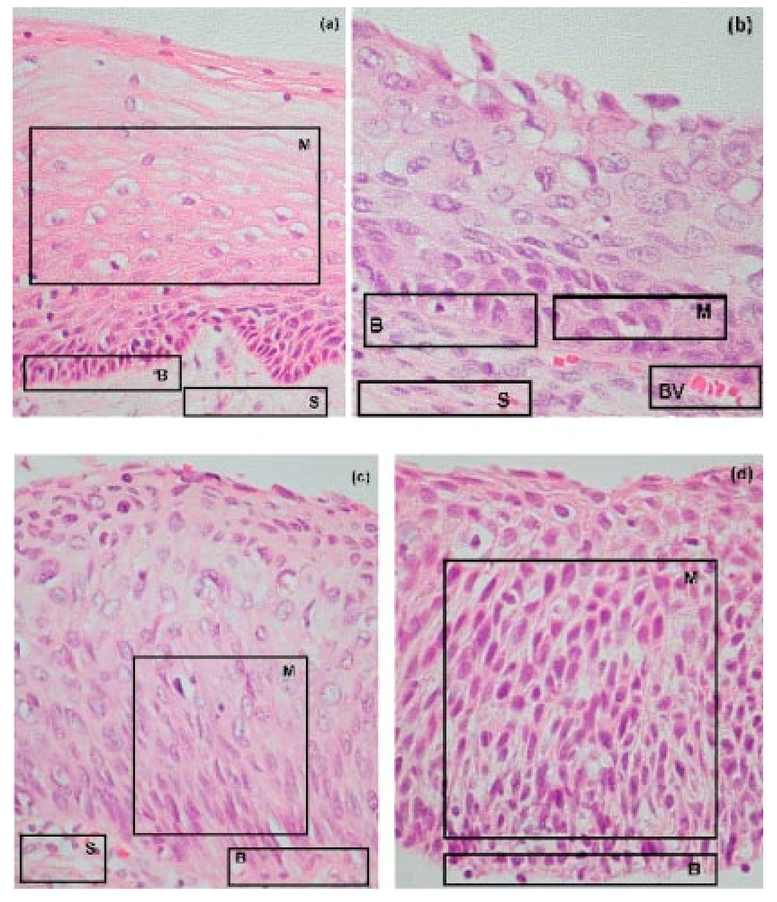 3.2.FTIR Spectra of TissuesThe characteristic absorbance spectra of various stages of CIN are shown in Fig. 2(a). The spectra were normalized to the amide I absorbance band. There is a change in the spectra of the various stages in a progressive manner proceeding from the normal tissue to the CIN3 stage. The changes occur in the wave number regions between 900 and 1200 cm−1, where the absorbance of the neoplastic cells is lower than that of the normal cells, and in the region from 1200 to 1600 cm−1, where it is greater than that of the normal cells. There is a decrease in the absorbance in the region 900 to 1200 cm−1 with the progression in the degree of dysplasia or in other words the severity of the CIN stage, which indicates that the carbohydrate (glycogen) level is less in the neoplastic tissue compared to normal tissue. Such observations on glycogen levels of normal and malignant cervical cells were reported earlier.16 17 18 Similarly, absorbance in the amide II region is more in the case of CIN1 and CIN2 when compared to normal cells, while it is at a par in case of the CIN3. These characters can help to differentiate the different stages. Thus, the spectra in the IR region reflect the biochemical changes in the cells and tissues and the severity of the disease. Figure 2(b) shows the expanded spectra in the region 800 to 1200 cm−1, where we clearly see that there is a decrease in the absorbance of the neoplastic cells as compared to the normal cells. This type of decrease progresses from normal to CIN1, CIN2, and CIN3. This region of the spectra arises from the vibrations of the carbohydrates and symmetric phosphates vibrations. There is also a prominent peak in the normal spectrum at 933 cm−1, which is not so prominent in the neoplastic spectra. Similarly, the peak at 966 cm−1 is more prominent in case of the neoplastic tissues. A peak at 969 cm−1 was reported to be present in case of myeloid leukemia cells at the S phase by Boydston-White et al.;37 which corresponded to DNA. This was similar to the peak of hydrated DNA films at 967 cm−1 observed by the same group. We propose that the increased DNA levels or hydration of DNA due to unfolding during cell division could be responsible for this peak in our study on neoplastic tissues compared to the normal tissues. Figure 2(a) Mid-IR spectra of biopsies representing the absorbance pattern of different premalignant stages in the wavenumber region 800 to 1800 cm−1, (green) normal, (blue) CIN1, (pink) CIN2, and (black) CIN3, and (b) expanded region between 800 and 1200 cm−1 of the absorbance due to carbohydrates (glycogen).  The second derivative of the preceding spectra is presented in Fig. 3(a). We clearly see that the peak at 933 cm−1 recedes while the peak at 966 cm−1 increases during the onset of neoplasia. Similarly the peaks at 1024 and 1081 cm−1 are diminished due to neoplasia, indicating decreased absorbance at these wavelengths. The shoulder at 1170 cm−1 increases in all the CIN cases, showing that there is increased phospohorylation of the C—OH groups in proteins,38 which is also indicative of abnormal metabolism due to neoplasia. Figure 3(a) Second derivative of the spectra in Fig. 2(b) showing the wave number at which maximum absorbance occurs. The color codes are same as those of Fig. 2(a). (b) Difference spectra of biopsies representing the different premalignant stages of cervical intraepithelial neoplasia in the wave number region 800 to 1200 cm−1 with respect to normal tissue. The green line represents the baseline. The color codes are same as those of Fig. 2(a).  Similarly, the bands at 1400 and 1455 cm−1 arising due to the vibrations of the methyl and methylene groups of membrane lipids and proteins is higher in the CIN1 and CIN2 cases. These differences between the normal and neoplastic spectra are more distinct in the difference spectra, as shown in Fig. 3(b). Thus, the CIN1 and CIN2 cases are biochemically distinguishable from the normal cases and can be traced earlier by FTIR than by histological studies. The absorbance of the various stages in the region 2750 to 3050 cm−1 is shown in Fig. 4. This region mainly arises due to the stretching vibrations in the groups of lipids. The peaks labeled A, B, C, and D represent the symmetric (peaks A and B) and antisymmetric (peaks C and D) stretching vibrations of the CH 2 and CH 3 groups in fatty acids respectively.39 These are mostly found in the membranes and to some extent in the cytoplasm of the cells. Thus, the spectra indicate that the cell shape and alterations are linked to the membrane fluidity, which in turn is affected by the membrane composition. Unlike the absorbance due to carbohydrates (glycogen level), the absorbance of the CIN1 and CIN2 spectra is more than the control in this region, while CIN3 absorbance is less than the normal. The second derivative spectra [Fig. 4(b)] do not show significant shifts in the peak wave number, indicating a change only in the intensity. This indicates that the type of lipids and phospholipids may not be altered qualitatively, though their cellular quantity is altered. We can see from Fig. 2 that other cellular components are also affected. Figure 4(a) IR spectra of biopsies representing the different premalignant stages of CIN in the wave number region 2750 to 3050 cm−1 and (b) the second derivative of the spectra in (a) showing the wave number at which maximum absorbance occurs. The color codes are same as in Fig. 2(a). 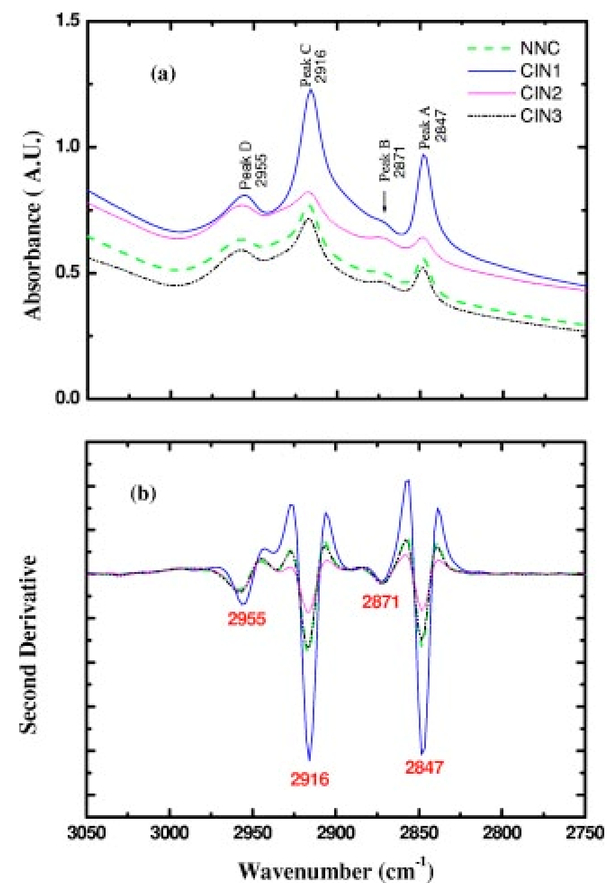 3.3.Changes in Biochemical Composition due to Premalignant Stage as Seen in the FTIR SpectraThe changes in the various biochemical components as calculated from the spectra are plotted as a function of the CIN stages (Fig. 5). We see that there is a separation of the various neoplasia stages from the normal tissue when the components calculated from the spectra are used as the parameters. We see in Fig. 5(a) that when the glucose per phosphate and RNA/DNA ratios are used as two parameters indicative of neoplasia, the points representating normal tissue are all in a distinct zone. The CIN1 cases are nearly in a cluster, while the clusters of CIN2 and CIN3 are overlapping, indicating the overlapping nature of these two stages. Thus, the overlap of the various stages in the figure signifies the gradual transition of one neoplastic stage to another. This transition is not abrupt but progresses slowly due to gradual change in the biochemical composition. A similar pattern is observed when the absorbance of lipids is used as a parameter [Fig. 5(b)]. Here also there is clustering of the normal values, while there is a high overlap in CIN2 and CIN3 values with a partial overlap of CIN1 and CIN2 values. The variation in the biochemical composition helps to separate these stages from the normal cells, which indicates different levels of these components in the cells at different neoplastic stages. The distribution of the various neoplastic stages is plotted in Fig. 6 using the levels of lipids, glucose/phosphate, and the RNA/DNA ratio as variables, as calculated from the spectra. Figure 5(a) The 2-D plots of RNA/DNA versus glucose/phosphate for the various biopsies as obtained from spectral data. The glucose/phosphate ratio was measured at 1030/1080 and the RNA/DNA at 1121/1020. (b) The 2-D plots of lipids versus glucose/phosphate for the various biopsies as obtained from spectral data. The glucose/phosphate ratio was measured at 1030/1080 and the lipids was calculated from the area under the curves of the bands shown in Fig. 4. The color codes are same as in Fig. 2(a).  Figure 6A 3-D plot of the various premalignant cases based on simultaneous use of three parameters (lipids, RNA/DNA, and glucose/phosphate), showing the distribution of the various CIN stages and clustering and overlapping of points belonging to the same histological classification. The color codes are same as in Fig. 2(a). 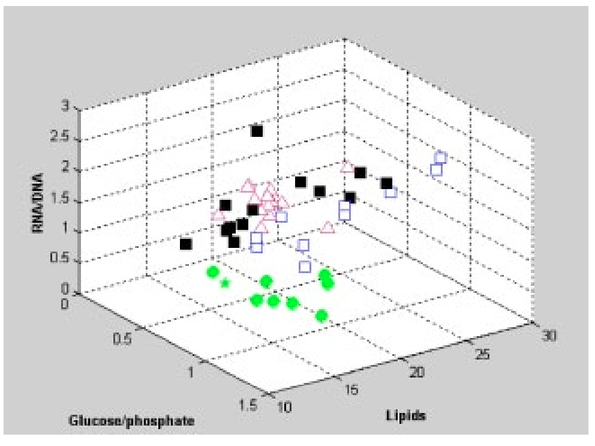 In these figures, the star symbol shows a biopsy, which was diagnosed by the pathologist as normal based on its histopathological characteristics but from our data analysis it indicated characteristics of CIN1. The follow-up biopsy confirmed that it was CIN1. Thus, the system efficiently predicts the staging and can help to decrease or eliminate false positive and false negative cases. To classify the CIN1 and normal stages, cluster analysis was performed. Figure 7 shows a dendrogram of normal tissue and CIN1 as two distinct hierarchical clusters with good heterogeneity (>3.5). Except for two normal cases, which were classified into the CIN1 cluster, all other normal patients were grouped in a single distinct cluster. Out of these two normals, one is labeled as a star in Figs. 5 and 6 and has already been discussed. The other normal is the data point closest to this star in Fig. 5, and showed more similarity to CIN1 from the data. The single CIN1 case (No. 3), which occurred in the cluster of normals, showed abnormal biochemical levels in Figs. 5 and 6. Thus, it did not cluster with CIN1. Therefore, additional methods of analysis were required to distinguish CIN1 from normal cases. 3.4.PNN Analysis of the Spectra and Assignment of Stages to the PatientsThe PNN input was composed of wavelet coefficients obtained as already described. A total of 201 spectra were available for analysis (Table 1) corresponding to 46 (38 CIN cases and 8 control) different patients were used. In this study, training and test sets were selected randomly from the same data sets. Thirty percent of each set was employed for training and the remainder for the test. Therefore, for each simulation run, the data from 15 different patients (3 control and 12 CIN cases, about 60 spectra) were employed for training while the remainder data (5 control and 26 CIN cases, about 141 spectra) were used for testing. In addition, the simulations were repeated 1000 times, with the same network parameters but with different sets of randomly selected training vectors, and the results were averaged. This led to a low error value, which is less than the possibility of one erroneous classification in the data set of 201. Table 1
Appropiate feature extraction is considered to be one of the most important components of the classification procedures. Feature selection for classification can be regarded as the search among all possible combinations for the one that preserves separability in the lowest possible dimensional space. This subspace enables a faster and generally more robust and invariant classification procedure. In the quest for the optimal feature subset, several combinations of wavelet coefficients were tried as inputs for the PNNs. A summary of the different feature sets used in this work is shown in Table 2, while a comparision between the different sets is presented in Table 3. Table 2
Table 3
The PNN with an input set composed of five coefficients located from 2631 to 2797 cm−1 and nine coefficients located from 1221 to 1553 cm−1 gave the best results. The PNN-based classifier shows success rates of 90.95, 84.28, 89.46, and 83.26 for normal, CIN1, CIN2, and CIN3 patients, respectively. Increasing the coefficients to 47 did not significantly alter the grading of the data, as seen from Table 3. Although the success rate of the classifier is high, a careful analysis of Table 4 reveals that about 5.96 of the CIN1 patients might be classified as normal, while up to 9.04 of the normal patients might be classified as CIN1. On the other hand, the risk of misclassifing the CIN2 and CIN3 as normal is only 0.01 and 0.14, respectively, which is a good indication of decreasing false negatives. Viewed in the light of classifying only the biopsies without assigning the stages to patients, the MLP classifier shows success rates of 82.33, 87.93, 89.33, and 91.16 for normal, CIN1, CIN2, and CIN3 patients, respectively. Although the success rate of this classifier is high, about 6.39 of the CIN1 biopsies might be classified as normal while up to 13.95 of the normal biopsies might be classified as CIN1. On the other hand, the risk of misclassifing the CIN2 and CIN3 biopsies as normal is only 0.04 and 0.81, respectively, which is a good indication of decreasing the false negatives (data not shown). Table 4
The CIN2 and CIN3 data are slightly overlapped, indicating the rapid progress from one to the other or small changes in biochemical composition between these two stages. However, all the normal, CIN1, and CIN2 and CIN3 are distinguished by their RNA/DNA ratio, which increases with the severity. 4.DiscussionThe accurate diagnosis and staging of neoplasia in cervical cancer is important as treatment at early stages ameliorates the symptoms and can prevent onset of malignancy.40 41 42 Various approaches have been undertaken to understand the efficiency of diagnostic methods to identify neoplasia with varying interpretations and results.43 44 45 46 Currently, the diagnosis is not foolproof due to poor understanding of the detailed mechanism of cervical neoplasia and sampling methods as well as association of HPV with the process of onset of neoplasia.47 48 Although the selection of the sample for diagnosis has had a scientific explanation,49 often the samples used were from PAP smears or similar processes. Various efforts were undertaken to remove factors contributing to errors in the classification and diagnosis of neoplasia by FTIR spectroscopy.23 25 In most studies, the samples used for classification were from smears or other methods, which inherently carried a lot of confounding factors such as cell debris, blood, microorganisms, etc. Thus, discrepancies between the observed results and the actual interpretations became important and the attempts to remove variables that confounded the results were undertaken.24 It therefore became important that a proper representative tissue is subjected to scrutiny before diagnosis and staging of neoplasia, especially in case of tests related with premalignant staging. To reduce the stated factors we selected accurately diagnosed biopsies for the FTIR-MSP measurements, maximizing the epithelial layers and avoiding cellular debris, blood cells, and microorganisms such as bacteria. The classification of neoplasia has hitherto been dependent on the selection of the biopsy and the identification of certain regions on the biopsy by pathologists and experts.31 Cervical neoplasia has been known to progress to cancer or even regress depending on several factors such as the viral strain causing it, the viral load in the patient, etc.9 Thus, due to the dynamic nature of neoplasia, occurrence of different CIN stages are observed at times in the same biopsy. Cases with multiple CIN stages from the same patient are ideal for testing the spectral variations due to premalignant conditions, since they enable comparisons with minimum heterogeneity in sampling. Under such circumstances, the selection of the correct biopsy and staging becomes crucial to understand progression/regression of the disease. The monitoring of progression/regression requires that the observations are based on maximum possible samples. While monitoring the patients at periodic intervals can do this, the temporal factor also introduces other variables such as the health status, nutrition, and degree of infection. Thus, monitoring the dynamics of neoplasia by a fewer number of medical examinations and more sampling per time through in vivo methods to scan as much surface would make it possible to accurately determine the progression/regression of the disease. This is possible when the staging of neoplasia is made on basis of quantifiable variables such as biochemical changes rather than on the conventional histological observations, which are subjective. We see in Fig. 3 that such chemical changes are prominent in certain regions of the IR spectra of the tissues and cells. The onset of such changes is an indication of the disease. The second derivatives of the spectra show hidden peaks and shifts in the wavelengths, which further confirms the disease. This makes the staging more authentic than just changes in the intensity. In this paper, we showed that the biochemical changes manifest themselves as changes in the FTIR spectra of cervical tissues. Comparison of Figs. 1 and 2 shows that the changes in the cell morphology occur along with changes in biochemical composition. The losses of materials from paraffin-wax-processed tissues include small water-soluble molecules, alcohol-soluble lipids, and other molecules that are soluble in xylol and hot paraffin. Our data thus, deal with nucleic acids, proteins, insoluble carbohydrates (glycogen), and nonextractable lipids. By taking in vivo observations in spectral mode for a large region and averaging, it is possible to reach a quantification of the disease on a biochemical basis to monitor the disease dynamics. This would also alleviate the problem of dealing with large volumes of PAP smears, the presence of false positives and false negatives,50 and repeated biopsy studies, which are an inconvenience to both the pathologist and the patient. The most important aspect of such a study would be the accuracy with which population can be screened for the degree of the neoplasia. Note that the preparation of samples for FTIR from biopsies involves treatment with chemicals, which can alter the actual chemical composition. However, since we processed the normal and premalignant tissues in the same manner, the relative changes are not affected. It is important that these treatments do not hinder our main objective of distinguishing the premalignant from the normal tissue. The neoplastic tissues have characteristic spectra where the absorbance of glycogen is decreased and there are also observable changes in the absorbance peaks at 933 and 966 cm−1. Thus, it is easy to distinguish neoplasia from the normal tissue based on these features. However, accurate distinction between the different stages is crucial. This distinction can be made taking into consideration the other regions of the spectra. The CIN1, CIN2, and CIN3 spectra has higher absorbance in the wavelength region from 1200 to 1300 cm−1. However, absorbance at the amide II region of CIN3 is on a par with that of the normal while it is not so in case of CIN1 and CIN2. The quantitative distinction between CIN1 and CIN2 can be made only based on consideration of several parameters simultaneously, as shown in Fig. 6, where the variation in phospholipid, RNA/DNA ratio, and glucose/phosphate is used simultaneously resulting in clusters of separate CIN1 and CIN2 cases. The spectral characteristics of the premalignant tissues help to identify the different degrees of cervical malignancy at a very early stage of neoplasia. Based on these markers, an in vivo approach can be designed to directly diagnose the stage without the problems associated with sample extraction and histological observations. However, this would require more automation, which makes it mandatory to use a software system for the entire operation. The use of a PNN on the existing data shows its feasibility for future uses. We see in Tables 3 and 4 that the spectral data when used to train a system for identification does so to a great degree of precision, which is on a par with that of histological grading. The system efficiently distinguishes between CIN1 and CIN2 and normal tissue with a false positive rate of the normal being diagnosed as CIN1 and CIN2 at 9.05 and a false negative rate of CIN2 and CIN3 being diagnosed as normal at 0.15. This especially places the patients at an advantage since the low rate of false negatives for patients helps in effective screening for malignancy and early detection. The system, however, is not able to distinguish between CIN1 and normal tissue (the false positive for normal as CIN1 is 9.04 and false negative of CIN1 as normal is 5.96) as these two stages are very similar in nature and the training depends on the difference in the nature of the specimen as diagnosed by the pathologist. This is responsible for the error in the clear-cut differentiation of CIN1 from normal tissue. However, the diagnosis of the CIN3 and CIN2 cases was achieved with a high degree of precision, which is important from a clinical point of view as these are known more or less to progress to invasive cervical cancer, while CIN1 often regresses due to various factors. Thus, the system definitely overrules any subjective error in classifying the normal case as CIN2 or CIN3 and vice versa, which is important in initial screening. The cluster analysis (Fig. 7) also supports these observations. The region between 980 and 1176 cm−1 is efficient in distinguishing between the CIN1 case and the normal case when used for cluster analysis. Since CIN1 is the stage that is closest to normal in histology, this method would prove to be most useful in distinguishing these two classes. Thus, the PNN has a marginal improvement in false negative (6) over the false negative from cluster analysis (12.5). The system can, however, be used to further decrease this error using a larger database, which would increase the efficiency of the system. 5.ConclusionsIn this paper, we reported a clear distinction of the different stages of CIN from the normal based on the spectral characteristics as determined by FTIR-MSP. The use of a PNN in tandem with the FTIR-MSP helps to evaluate a biopsy with a high degree of precision to the neoplastic stage assigned to it by the pathologist. These results encourage us to visualize the utility of the system for development of mechanized equipment for in vivo diagnosis of neoplasia based on biochemical changes rather than histopathological studies, alleviating the complexity involved in the conventional methods. AcknowledgmentsThis research work was supported by the Israel Science Foundation (ISF Grant No. 788/01) and the Israel Cancer Association (ICA). We are immensely grateful to Prof. A Katzir and Dr. Yosef Raichlin from the School of Physics and Astronomy, Raymond and Beverly Sackler Faculty of Exact Sciences, Tel-Aviv University, Israel, for their constructive remarks during preparation of the manuscript. REFERENCES
J. S. Berek
,
“Simplification of the new Bethesda 2001 classification system,”
Am. J. Obstet. Gynecol. , 188 S2
–S5
(2003). Google Scholar
M. A. Stanley
,
“Prognostic factors and new therapeutic approaches to cervical cancer,”
Virus Res. , 89 241
–248
(2002). Google Scholar
J. Coste
,
B. C. Priollet
,
P. de Cremoux
,
C. le Gales
,
I. Cartier
,
V. Molinie
,
S. Labb
,
M.-C. V. Larene
, and
P. Viell
,
“Cross sectional study of conventional cervical smear, monolayer cytology, and human papillomavirus DNA testing for cervical cancer screening,”
BMJ , 32 1
–5
(2003). Google Scholar
F. Bretelle
,
A. Agostini
,
M.-C. Rojat-Habib
,
L. Cravello
,
V. Roger
, and
B. Blanc
,
“The role of frozen section examination of conisations in the management of women with cervical intraepithelial neoplasia,”
BJOG , 110 364
–370
(2003). Google Scholar
N. Ramanujam
,
M. F. Mitchell
,
A. Mahadevan
,
S. Thomsen
,
E. Silva
, and
R. R. Kortum
,
“Fluorescence spectroscopy: a diagnostic tool for cervical intraepithelial neoplasia (CIN),”
Gynecol. Oncol. , 52 31
–38
(1994). Google Scholar
J. Bulten
,
W. J. G. Melchers
,
M. M. Kooy-Smits
,
P. C. M. de Wilde
,
P. J. Paddighe
,
J. C. M. Robben
,
M. V. E. Macville
,
L. F. A. G. Massuger
,
J. M. J. E. Bakkers
, and
A. G. J. M. Hanselaar
,
“Numerical aberrations of chromosome 1 in cervical intraepithelial neoplasia are strongly associated with infection with high-risk human papilloma virus types,”
J. Pathol., 198 300
–309
(2002). Google Scholar
D. J. McCance
,
R. Kopan
,
E. Fuchs
, and
L. A. Laimins
,
“Human papillomavirus type 16 alters human epithelial cell differentiation in vitro,”
Proc. Natl. Acad. Sci. U.S.A. , 85 7169
–7173
(1988). Google Scholar
M. Yokoyama
,
T. Iwasaka
,
C. Nagata
,
S. Nowaza
,
S. Sekiya
,
Y. Hirai
,
K. Kanazawa
,
S. Sato
,
H. Hoshiai
,
M. Sugase
,
T. Kawana
, and
H. Yoshikawa
,
“Prognostic factors associated with the clinical outcome of cervical intraepithelial neoplasia: a cohort study in Japan,”
Cancer Lett. , 192 171
–179
(2003). Google Scholar
H. M. Bauer
,
Y. Ting
,
C. E. Grecer
,
J. C. Chambers
,
C. J. Tashiro
,
J. Chimera
,
A. Reingold
, and
M. M. Manos
,
“Genital human papillomavirus infection in female university students as determined by a PCR-based method,”
JAMA, J. Am. Med. Assoc. , 265 472
–477
(1991). Google Scholar
V. Manju
,
J. K. Sailaja
, and
N. Nalini
,
“Circulating lipid peroxidation and antioxidant status in cervical cancer patients: a case-control study,”
Clin. Biochem. , 35 621
–625
(2002). Google Scholar
I. Georgakoudi
,
B. C. Jacobson
,
M. G. Miller
,
E. E. Sheets
,
K. Badizadegan
,
D. L. Carr-Locke
,
C. P. Crum
,
C. W. Boone
,
R. R. Dasari
,
J. Van Dam
, and
M. S. Feld
,
“NAD(P)H and collagen as in vivo quantifiable fluorescent biomarkers of epithelial precancerous changes,”
Cancer Res. , 62 682
–687
(2002). Google Scholar
N. Ramanujam
,
“Fluorescence spectroscopy of neoplastic and non-neoplastic tissues,”
Neoplasia , 2 89
–117
(2000). Google Scholar
P. T. T. Wong
,
R. K. Wong
, and
M. F. K. Fung
,
“Pressure tuning of FT-IR study of human cervical tissues,”
Appl. Spectrosc. , 47 1058
–1063
(1993). Google Scholar
L. Chiriboga
,
P. Xie
,
H. Yee
,
V. Vigorita
,
D. Zarou
,
D. Zakim
, and
M. Diem
,
“Infrared spectroscopy of human tissue. I. Differentiation and maturation of epithelial cells in human cervix,”
Biospectroscopy , 4 47
–53
(1998). Google Scholar
L. Chiriboga
,
P. Xie
,
H. Yee
,
D. Zarou
,
D. Zakim
, and
M. Diem
,
“Infrared spectroscopy of human tissue. IV. Detection of human cervical tissue via infrared microscopy,”
Cell. Mol. Biol. Lett. , 44 219
–229
(1998). Google Scholar
P. T. T. Wong
,
R. K. Wong
,
T. A. Caputo
,
T. A. Godwin
, and
B. Rigas
,
“Infrared spectroscopy of exfoliated human cervical cells: evidence of extensive structural changes during carcinogenesis,”
Proc. Natl. Acad. Sci. U.S.A. , 88
(24), 10988
–10992
(1991). Google Scholar
M. A. Cohenford
and
B. Rigas
,
“Cytologically normal cells from neoplastic cervical samples display extensive structural abnormalities on IR spectroscopy: implications for tumor biology,”
Proc. Natl. Acad. Sci. U.S.A. , 95
(26), 15327
–15332
(1998). Google Scholar
M. Diem
,
S. Boyston-White
, and
L. Chiriboga
,
“Infrared spectroscopy of cells and tissues: shining light on to a novel subject,”
Appl. Spectrosc. , 53 148A
–161A
(1999). Google Scholar
M. Fung Kee Fung
,
M. Senterman
,
P. Eid
,
W. Faught
,
N. Z. Mikhael
, and
P. T. Wong
,
“Comparison of Fourier-transform infrared spectroscopic screening of exfoliated cervical cells with standard Papanicolaou screening,”
Gynecol. Oncol. , 66
(1), 10
–15
(1997). Google Scholar
B. R. Wood
,
M. A. Quinn
,
F. R. Burden
, and
D. McNaughton
,
“An investigation into FTIR spectroscopy as a biodiagnostic tool for cervical cancer,”
Biospectroscopy , 2
(3), 145
–155
(1996). Google Scholar
R. A. Shaw
,
J. R. Mansfield
,
S. P. Rempel
,
S. Low-Ying
, and
V. V. Kupriyanov
,
“Analysis of biomedical spectra and images: from data to diagnosis,”
J. Mol. Struct.: THEOCHEM , 500 129
–138
(2000). Google Scholar
B. R. Wood
,
M. A. Quinn
,
B. Tait
,
M. Ashdown
,
T. Hislop
,
M. Romeo
, and
D. McNaughton
,
“FTIR microspectroscopic study of cell types and potential confounding variables in screening for cervical malignancies,”
Biospectroscopy , 4
(2), 75
–91
(1998). Google Scholar
M. J. Romeo
,
B. R. Wood
,
M. A. Quinn
, and
D. McNaughton
,
“Removal of blood components from cervical smears: implications for cancer diagnosis using FTIR spectroscopy,”
Biopolymers , 72
(1), 69
–76
(2003). Google Scholar
P. T. Wong
,
M. K. Senterman
,
P. Jackli
,
R. K. Wong
,
S. Salib
,
C. E. Campbell
,
R. Feigel
,
W. Faught
, and
M. Fung Kee Fung
,
“Detailed account of confounding factors in interpretation of FTIR spectra of exfoliated cervical cells,”
Biopolymers , 67
(6), 376
–386
(2002). Google Scholar
M. A. Cohenford
,
T. A. Godwin
,
F. Cahn
,
P. Bhandare
,
T. A. Caputo
, and
B. Rigas
,
“Infrared spectroscopy of normal and abnormal cervical smears: evaluation by principal component analysis,”
Gynecol. Oncol. , 66
(1), 59
–65
(1997). Google Scholar
M. Romeo
,
F. Burden
,
M. Quinn
,
B. Wood
, and
D. McNaughton
,
“Infrared microspectroscopy and artificial neural networks in the diagnosis of cervical cancer,”
Cell. Mol. Biol. Lett. , 44
(1), 179
–187
(1998). Google Scholar
L. Chiriboga
,
H. Yee
, and
M. Diem
,
“Infrared spectroscopy of human cells and tissues. Part IV: A comparative study of histopathology and infrared microspectroscopy of normal, cirrhotic and cancerous liver tissue,”
Appl. Spectrosc. , 54 1
–8
(2000). Google Scholar
S. Argov
,
J. Ramesh
,
A. Salman
,
I. Silenikov
,
J. Goldstein
,
H. Guterman
, and
S. Mordechai
,
“Diagnostic potential of Fourier transformed infrared microspectroscopy and advanced computational methods in colon cancer patients,”
J. Biomed. Opt. , 7 248
–254
(2002). Google Scholar
S. G. Mallat
and
S. Zhong
,
“Characterization of signal multiscale edges,”
IEEE Trans. Pattern Anal. Mach. Intell. , 10 710
–732
(1992). Google Scholar
D. F. Specht
,
“Probabilistic neural networks and polynomial Adaline as complementary techniques for classification,”
IEEE Trans. Neural Netw. , 1 111
–121
(1990). Google Scholar
R. P. Lippmann
,
“An introduction to computing with neural nets,”
IEEE Trans. Acoust., Speech, Signal Process. , 4 4
–22
(1987). Google Scholar
S. Boydston-White
,
T. Gopen
,
S. Houser
,
J. Bargonetti
, and
M. Diem
,
“Infrared spectroscopy of human tissue. V. Infrared spectroscopic studies of myeloid leukemia (ML-1) cells at different phases of the cell cycle,”
Biospectroscopy , 5 219
–227
(1999). Google Scholar
S. Neviliappan
,
L. F. Kan
,
T. T. L. Walter
,
S. Arulkumaran
, and
P. T. T. Wong
,
“Infrared spectral features of expfoliated cervical cells, cervical adenocarcimnoma tissue and an adenocarcinoma cell line (SiSo),”
Gynecol. Oncol. , 85 170
–174
(2002). Google Scholar
M. E. Sherman
,
A. T. Lorincz
,
D. R. Scott
,
S. Wacholder
,
P. E. Castle
,
A. C. Glass
,
I. M. Lohnas
,
B. B. Rush
, and
M. Schiffman
,
“Baseline cytology, human papillomavirus testing, and risk for cervical neoplasia: a 10-year cohort analysis,”
JNCI , 95 46
–52
(2003). Google Scholar
L. A. Koutsky
,
K. K. Holmes
,
C. W. Critchlow
,
C. E. Stevens
,
J. Paavonen
,
A. M. Beckmann
,
T. A. De Rouen
,
D. A. Galloway
,
D. Vernon
, and
N. B. Kiviat
,
“A cohort study of the risk of cervical intraepithelial neoplasia grade 2 or 3 in relation to papillomavirus infection,”
N. Engl. J. Med. , 327 1272
–1278
(1992). Google Scholar
M. J. Campion
,
D. J. McCance
,
J. Cuzick
, and
A. Singer
,
“Progressive potential of mild cervical atypia: prospective cytological, colposcopic, and virological study,”
Lancet , 2 237
–240
(1986). Google Scholar
A. A. Renshaw
,
“Deja vu in PAP testing: return of the 5 false-negative fraction and the zero-error rate,”
Diagn. Cytopathol , 26 343
–344
(2002). Google Scholar
R. M. Richart
,
H. W. Jones
, and
R. Reid
,
“Classification and interpretation of pap smears,”
Am. Coll. Obstet. Gynecol. Update , 18 1
–9
(1993). Google Scholar
N. M. Lonky
,
M. Sadeghi
, and
G. W. Tsadik
,
“Poor correlation of high-grade cervical dysplasia with referral cytology: clinical implications,”
Prim. Care Update Obstet. Gynecol. , 5 161
(1998). Google Scholar
M. J. Schiffman
,
“Recent progress in defining the epidemiology of human papillomavirus infection and cervical neoplasia,”
J. Natl. Cancer Inst. , 84 394
–398
(1992). Google Scholar
W. Sun
and
W. D. Grafton
,
“Litigation cells: their incidence and classification in gynecologic smears,”
Diagn. Cytopathol , 26 345
–348
(2002). Google Scholar
M. Durst
,
A. Kleinheinz
,
M. Hotz
, and
L. Gissman
,
“The physical state of human papillomavirus type 16 DNA in benign and malignant genital tumours,”
J. Gen. Virol. , 66 1515
–1522
(1985). Google Scholar
J. C. Felix
,
“The science behind the effectiveness of in vivo screening,”
Am. J. Obstet. Gynecol. , 188 S8
–S12
(2003). Google Scholar
P. H. Levine
,
P. A. Egert
, and
K. Mittal
,
“False-positive squamous cell carcinoma in cervical smears: cytologic-histologic correlation in 19 cases,”
Diagn. Cytopathol , 28 23
–27
(2003). Google Scholar
|
||||||||||||||||||||||||||||||||||||||||||||||||||||||||||||||||||||||||||||||||||||||||||||||||||||