
|
|
1.IntroductionMolecular sensing in intact living small animals is taking center stage in modern biology. The ability to detect various molecular events such as gene expression, receptor targeting, or exploring various intercellular pathways from within a living organism is of enormous biomedical interest.1 2 Imagable biomolecules of fluorescent3 and bioluminescent4 origins and various new compounds like fluorochromes,5 nanoparticles,6 and quantum dots7 are being investigated to measure cellular events within small living animals. Monitoring molecular events continuously and noninvasively from living animals using optical methods can be done with reporter genes that encode for bioluminescent luciferases. The luciferase enzymes derived from various sources (bacteria, marine crustaceans, fish, or terrestrial insects) generate visible light through the oxidation of a specific luciferin substrate. The spectral peaks range from 450 to 620 nm. An ideal bioluminescence reporter for noninvasive study would be the one that can give (i) emission in the red to infrared range, as there are chances of less attenuation in tissue with 600–900 nm wavelengths, (ii) yields higher measurable signals to image low level of reporter gene expression from weak promoters, or (iii) able to measure detectable light signals from deeper tissues. Noninvasive imaging of bioluminescence reporter genes in small animals was first observed using the Firefly luciferase reporter gene (Fluc) with the aid of an intensified charged coupled device (CCD) camera.8 Firefly luciferase enzyme (FL) is a 61 kDa single-subunit protein, that catalyzes D-Luciferin to produce oxyluciferin, in the presence of oxygen, Mg +2, and ATP to give a flash of green light at 562 nm.9 We have previously established Renilla luciferase reporter gene (Rluc) as a second promising strategy, which is imagable in living mice.10 Renilla luciferase (RL) is a 36 kDa monomeric enzyme, that can catalyze the non-ATP dependent oxidation of coelenterazine in the presence of oxygen in order to generate a flash of blue luminescence with a wavelength centered at 482 nm.11 Rluc can be used in combination with Fluc for dual reporter gene applications in living mice. This is possible because D-Luciferin, the substrate for FL, is structurally different from coelenterazine used by RL to produce light.10 Neither FL or RL require posttranslational modification for their activity12 and have been identified to be potential promising genetic reporters for various studies.13 14 Rluc, which has been cloned from the marine organism Sea pansy,11 has some inherent limitations when used in mammalian cells. It contains ∼10 codons that are of minimal use by mammalian cells and limits expression efficiency. Also, the presence of a large number of potential transcription factor binding sites causes anomalous transcriptional behavior in mammalian cells.15 In the present investigation, we have utilized a synthetic Renilla luciferase reporter gene (hRluc) from Promega15 where the native Rluc gene has been redesigned and the codon usage optimized to improve the expression of the reporter. The number of transcription factor binding sites has been reduced from 300 in the Rluc to 4–5 sites in hRluc. In addition, deletion of poly (A) additional signals (AATAAA) and incorporation of a kozak sequence at the beginning of the gene has been used for better expression efficiency.16 The resulting reporter gene is expected to have higher transcriptional efficiency, which should greatly enhance the detection of the reporter enzyme in vivo. In this study we have compared gene expression of hRluc to that of Rluc both in cell culture and in living mice. To date, Fluc has been more frequently used as a bioluminescence reporter gene for noninvasive, real time imaging studies. We therefore also compare the signal differences of hRluc and Fluc for real time noninvasive imaging from living mice. 2.Materials and Methods2.1.Cell Lines, Culture Conditions, and Transfection ProceduresC6 rat glioma cells were maintained in glucose deficient minimum eagle’s medium (DMEM) supplemented with 1 penicillin-streptomycin, 1 L-glutamine, and 5 fetal calf serum (FCS). N2a (mouse neuroblastoma) cells, COS-1 (green monkey kidney) cells, and 293T (human kidney) cells were maintained in DMEM supplemented with 1 penicillin-streptomycin and 10 FCS. For assessment of Rluc/hRluc expression in various cell types, each cell type described above was plated in 12 well plates (2×10⁵ cells/well) and transfected with pCMV-Rluc/pCMV-hRluc plasmids (pRL-CMV, phRL-CMV, Promega, Madison, CA) and co-transfected with pCMV β-gal, using SuperFect Transfection Reagent (Qiagen, Valencia, CA) to normalize for transfection efficiency. Mock-transfected cells were used as control. Cells were lysed in lysis buffer 24 h posttransfection, and biochemical studies were carried out using a luminometer as described later. For comparing Fluc expression, C6 cells were transfected with pCMV-Fluc plasmid (provided by C.H. Contag, Stanford University, Stanford, CA) and co-transfected with pCMV β-gal in parallel 12 well plates. The transiently transfected cells are referred to as C6-Rluc, C6-hRluc and C6-Fluc in the following studies. C6 and 293T cells were also grown in 35 and 100 mm plates (Costar), and transfected with pCMV-Rluc or pCMV-hRluc under similar conditions. They were collected by trypsinization 24 h posttransfection, washed with phosphate buffer saline (PBS), counted, and various concentrations of cells, resuspended in PBS, were implanted in mice for in vivo studies as described later. 2.2.Preparation of Coelenterazine and D-LuciferinCoelenterazine (also known as “native coelenterazine”), a substrate for RL/hRL, was purchased from Prolume Ltd. (Pinetop, AZ). The compound (2 mg/mL) was dissolved in absolute ethanol. Further dilutions were made in 50 mM sodium phosphate buffer (SPB), pH 7. D-Luciferin Firefly potassium salt, the substrate for FL, was purchased from Xenogen Corp. (Alameda, CA). A 30 mg/mL stock in PBS was prepared and filtered through 0.22 μm filters before use. 2.3.Luminometer MeasurementsAll bioluminescence assays were performed in a TD 20/20 luminometer (Turner Designs, Sunnyvale, CA). Five microliters of crude and clarified cell lysates obtained from C6-Rluc, C6-hRluc and mock-transfected C6 control cells were mixed with 100 μL of coelenterazine, prepared at various concentrations of 0.0001, 0.001, 0.01, 0.1, 1.0, 10, 50, and 100 μg/mL in SPB. The dose dependent relative light units (RLU) were recorded in the luminometer for 10 s. The lysates were collected from three separate wells for each dose and the bioluminescence was normalized to total cellular protein of the well. The protein content of the cell lysates was mixed with Bio-Rad protein assay reagent (Bio-Rad Laboratories) and recorded in a Beckman DU-50 spectrophotometer (Beckman Instruments Inc.). The luminescence results were reported as RLU per microgram of protein/s. The results are normalized to β-gal activity and represented as RLU/μg/s/β-gal activity. Cell lysates (5 μL) from C6-Fluc cells were mixed with 100 μL of LARII (Promega). The RLU was recorded in the luminometer and normalized to total cellular protein. The results are reported as RLU/μg/s/β-gal activity. 2.4.Reverse Transcription-Polymerase Chain Reaction (RT-PCR), SDS-PAGE and Western BlottingReverse transcription-polymerase chain reaction (RT-PCR) was conducted to compare the level of messenger RNA produced by C6 cells transiently transfected with pCMV-Rluc and pCMV-hRluc and mock transfected C6 control cells. An equal number of cells (2.5×10⁶) were plated to carry out the transfection experiments. RNA extraction was done from transfected C6 and control cells using RNeasy kit (Qiagen). The RNA was first treated with RQ1 Rnase-Free Dnase (Promega) to degrade any contaminated double and single stranded DNA prior to RT-PCR. Removal of DNA was confirmed by doing PCR with the treated RNA. The GAPDH housekeeping gene was used as a positive control and levels of expression were near equivalent in the four cell lines studied. The RT-PCR was done with the aid of GeneAmp EzrTth RNA PCR kit (Applied Biosystems) using separate primers designed against Rluc and hRluc. Rluc primers had the region flanking 64–83 bp as sense and region flanking 267–247 bp as antisense, whereas hRluc primers had the region flanking 162–181 bp as sense and region flanking 364–345 bp as antisense. A 50 μL of reaction contained 200 ng of total RNA, 100 ng each of Rluc/hRluc forward primers and Rluc/hRluc reverse primers, 1X reverse transcription buffer (100 mM Tris-HCl, pH 8.3, 900 mM KCl with 1 mM MnCl 2), 200 μM dNTPs and 10 units of rTth DNA polymerase. RT reactions were performed at 60 °C for 45 min followed by 1 min pre-heating at 94 °C and 35 cycles of PCR amplification at 94 °C for 1 min, annealing and extension at 48 °C for 1 min followed by a final extension at 72 °C for 15 min. The reaction products (10 μL) were separated in a 2 agarose gel stained with ethidium bromide. The band intensity was further quantified with Kodak 1D. 3.5 image analysis software and the mean intensity recorded. RT-PCR was also conducted to compare the level of messenger RNA produced by C6 cells transfected with pCMV-hRluc and pCMV-Fluc and C6 control cells. RNA extraction was done from transfected C6 and control cells and further treated with RQ1 Rnase-Free Dnase (Promega) to degrade any contaminated double and single stranded DNA prior to RT-PCR. The RT-PCR was done with the aid of GeneAmp EzrTth RNA PCR kit (Applied Biosystems) using primers designed against Fluc. The hRluc primers were the same as above, whereas Fluc primers had the region flanking 92–111 bp as sense and region flanking 293–274 bp as antisense. The 50 μL of reaction contained 200 ng of total RNA, 100 ng each of Fluc/hRluc forward primers and reverse primers, IX reverse transcription buffer, 200 μM dNTPs and ten units of rTth DNA polymerase. Equal volume of reaction products (10 μL) was separated in a 2 agarose gel stained with ethidium bromide. The band intensity was further quantified with Kodak 1D. 3.5 image analysis software and the mean intensity recorded. For Western blot, protein extracts were prepared from C6 cells transiently transfected with pCMV-Rluc and pCMV-hRluc. Mock transfected C6 cells were used as control. Cells (1×10⁶) were washed and boiled in Laemmli’s sample buffer. Equal amount of protein (10 μg) was resolved on 10 SDS-PAGE and transferred to nitrocellulose membrane (Immun-Blot polymer polyvinylidene fluoride Membrane, Bio-Rad). Immunoblotting was performed using anti-Renilla antibody (1:1000 μL, Chemicon Int.). The blot was washed and incubated with anti-mouse IgG coupled to alkaline phosphatase (1:3000 μL, Chemicon Int.) and developed with BCIP/NBT (Roche Diagnosics). 2.5.Imaging and Quantification of Bioluminescence DataThe in vivo IVIS™ Imaging System (Xenogen Corp., Alameda, CA) consisting of a cooled CCD camera mounted on a light-tight specimen chamber (dark box), a camera controller, a camera cooling system, and a Windows computer system for data acquisition and analysis was utilized.17 Each supine/prone mouse was placed in the specimen chamber mounted with the CCD camera cooled to −120 °C, with a field of view set at 25 cm height above the sample shelf. The photon emission, transmitted from mice, was measured. The gray scale photographic images and bioluminescence color images were superimposed using the LivingImage v. 2.11 software overlay (Xenogen Corp., Alameda, CA) and Igor image analysis software v. 4.05 (Wavemetrics, Lake Oswego, OR). A region of interest (ROI) was manually selected over the signal intensity. The area of the ROI was kept constant and the intensity was recorded as maximum (photons/s/cm2/sr) within a ROI. 2.6.Coelenterazine Dose StudiesAll animal handling was performed in accordance with University of California Los Angeles (UCLA) Animal Research Committee guidelines. Five sets (N=2) of CD-1 mice (≈30 g; Charles River Breeding Laboratories), four weeks old, were anesthetized by intraperitoneal injection of ≈40 μL of ketamine and xylazine (4:1) solutions, followed by subcutaneous implantation of C6-hRluc cells (1×10⁶ cells in 100 μL PBS) in the left forearm region and C6 control cells (1×10⁶) in the right thigh region. Different doses of coelenterazine (0.07, 0.36, 0.7, 1.4, 2.1 mg/kg body weight) were injected via tail vein in duplicate mice. Bioluminescence was measured from both C6 control and C6-hRluc sites, over a 5 min time period using ten 30 s acquisition scans. 2.7.Simultaneous Imaging of RL and hRL Bioluminescence in MiceTwo sets of CD-1 mice were anesthetized as mentioned earlier. To check for background signal from animals not expressing the Renilla luciferase reporter gene, one set of mice (N=2) was tail-vein injected with 0.7 mg/kg body weight of coelenterazine. Another set of mice (N=3) was injected at three subcutaneous sites with C6-Rluc (1×10⁶ cells) in the left forearm, C6-hRluc (1×10⁶ cells) in the right forearm and C6 control cells (1×10⁶) in the right thigh region. One hundred microliters of coelenterazine (0.7 mg/kg body weight) was injected via tail vein and a whole-body image of the mice was acquired by fifteen 1 min scans using the cooled CCD camera. An equal number (2×10⁶) of different batches of cells (C6, C6-Rluc C6-hRluc) were lysed with lysis buffer and the signal recorded in the luminometer prior to implantation into CD1 mouse. 2.8.Sensitivity StudiesExperiments were conducted on nude mice to minimize background signals from the body fur. Mice were anesthetized by i.p. injection of ≈10 μL of ketamine and xylazine (4:1) solutions. 293T cells, transiently transfected with pCMV-hRluc plasmid (referred to as 293T-hRluc) were collected 24 h posttransfection. Separate groups of nude mice (N=2) were implanted with different number of cells (10 and 100 cells) at subcutaneous sites using a 5 μL Hamilton syringe. Tail-vein injection of coelenterazine (1.4 mg/kg body weight) was performed. The images were acquired for 5 min under the cooled CCD camera. 2.9.Simultaneous Imaging of FL/hRL Bioluminescence from Subcutaneous Sites in Living MiceCD1 mice (N=3) were anesthetized and implanted (s.c) with C6-Fluc (1×10⁶ cells) in the right forearm, C6-hRluc (1×10⁶ cells) in the left forearm and C6 control cells (1×10⁶) at the right thigh region. A mixture of D-Luciferin (150 mg/kg body):coelenterazine (0.7 mg/kg body) was injected via tail vein and whole-body images of the mice were acquired with 15 1 min scans using the cooled CCD camera. 2.10.Imaging of FL/hRL Bioluminescence in Living Mice from Deep TissuesCD1 mice (N=3), 4 months old (∼35 g each), were injected with a mixture of C6-Fluc cells: C6-hRluc cells=1:1 (2×10⁶ cells total) via tail vein. The cells traveled via the circulation and traffic into the lungs. Two hours later, the mice were anesthetized followed by intravenous injections of high doses of coelenterazine (5.7 mg/kg body weight). A whole-body image of the mice was acquired with three 1 min scans using the cooled CCD camera. Two hours later, the mice were re-scanned to check for the residual signals from the implanted C6-hRluc cells. When no signal was detected, the same set of mice were injected with D-Luciferin (150 mg/kg body) given intraperitoneally followed by the whole-body images of the mice acquired with three 1 min scans using the cooled CCD camera. 3.Results3.1.pCMV-hRluc Transfected Cells Show Significantly Higher Signals as Compared to pCMV-Rluc Transfected Cells Across Different Cell Lines TestedCell lines from different tissue origins (C6, N2a, 293T, COS-1) were transiently transfected with either pCMV-Rluc or pCMV-hRluc plasmids. The difference in the expression of the two Renilla luciferase reporter genes was compared. All cell lines show significantly higher (P<0.05) levels of gene expression from pCMV-hRluc transfected cells when assessed by the luminometer (Fig. 1). However, the level of expression varied in different cell lines with 293T showing ∼500-fold, COSI ∼800-fold, N2a 1500-fold, and C6∼150 fold higher expression from pCMV-hRluc transfected cells as compared to pCMV-Rluc transfected cells. Successful transfection in different cell lines indicates that hRluc has consistent high expression level in different tissues. Figure 1Comparison of signals in different cell lines using two different Renilla reporter genes. The graph shows four different cell lines used for comparing signal produced from hRL:coelenterazine and RL:coelenterazine as measured in a luminometer. The cells were transiently transfected with pCMV-Rluc/pCMV-hRluc and the cell lysates assayed 24 h posttransfection with the substrate coelenterazine, to compare the luciferase activity of two groups of transfected cells. All the cell lines show significant (P<0.05) enhancement in signal from cells transfected with pCMV-hRluc plasmid as compared to the pCMV-Rluc plasmid. Signals from the control cell lysates are negligible. Note the y axis is in log scale. The values are normalized to μg of total protein/s and for transfection efficiency (β-gal activity). The error bars (not seen) represent standard error of mean (SEM) of triplicates.  3.2.Increasing Signal is Observed from C6-hRluc Cell Lysates with Increasing Doses of CoelenterazineTo compare the light yield from C6-Rluc and C6-hRluc cell lysates with increasing doses of coelenterazine, different doses (0.0001–100 μg/mL) were prepared in 50 mM SPB by serial dilution. Coelenterazine, as low as 0.0001 μg/mL, is able to produce a measurable light signal in the luminometer from C6-hRluc cell lysates but not with C6-Rluc or C6 control cell lysates. A maximum signal of 1.0×10⁶±4.2×10⁵ RLU/μg/s/β-gal activity from C6-hRluc cell lysates and 2.8×10³±.72×102 RLU/μg/s/β-gal activity from C6-Rluc cell lysates were recorded in the luminometer at 1 μg/mL dose (Fig. 2). There is ∼250-fold higher signal with hRL as compared to RL at every coelenterazine dose. An approximately linear relationship (hRL; R2=0.98, RL; R2=0.96) between the doses of coelenterazine (0.01–1 μg/mL) and signal intensity is observed from both samples. At higher doses (>1 μg/mL) there is a plateau and eventually a drop in light production. Figure 2Effects of coelenterazine dose on measured light from C6-hRluc, C6-Rluc and control C6 cell lysates. C6 cells were transiently transfected with pCMV-hRluc, pCMV-Rluc, or mock transfected. Cell lysates were prepared and equal volume of lysates (5 μL) were mixed with increasing concentration of coelenterazine. The RLU was measured in the luminometer. The signals from C6-hRluc cell lysates are ∼250-fold higher than C6-Rluc lysates at any given dose. A near linear increase with dose is observed between 0.01–1 μg/mL of coelenterazine with C6-hRluc lysates. Control C6 cell lysates do not show any significant signal. The y axis is in log scale. The values are from triplicate wells normalized to μg protein/s/β-gal activity. The error bars (not seen) represent SEM of triplicates. 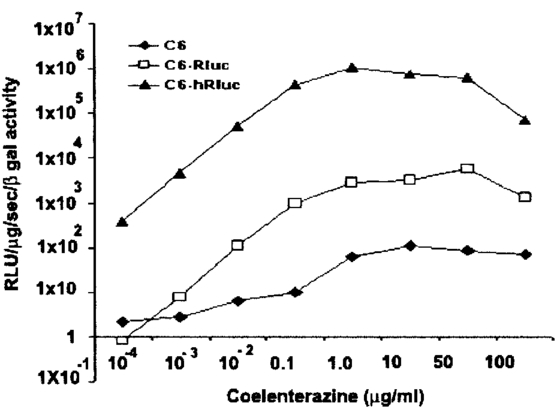 3.3.RT-PCR and Western Blot Analysis Shows Higher Message Level and Protein Production from C6-hRluc Cells as Compared to C6-Rluc CellsIn order to compare the transcription and translation levels in the C6-Rluc and C6-hRluc cells, RT-PCR and western blot were performed (Fig. 3). The RT-PCR study [Fig. 3(a)] shows a higher level of message production from C6-hRluc cells seen as a stronger band (lane 2) as compared to C6-Rluc cells (lane 3). Both amplified a product size of 203 bp. The control cells do not show any detectable band in the blot (lane 4). The mean intensity (MI) of the hRluc band is 117.16 and Rluc band is 90.23, whereas the control area is ∼65.52. Figure 3RT-PCR and Western blotting of C6/C6-Rluc/C6-hRluc cell extracts. Total RNA from C6-hRluc cells and C6-Rluc cells were isolated and an equal amount (200 ng) was analyzed by reverse transcription PCR as described in Sec. 2. The 203 bp RT-PCR products were separated in 2 agarose gel stained with ethidium bromide (a). An inverted image of the gel shows a higher amount of RT-PCR product from C6-hRluc mRNA as compared to equal volume (10 μL) C6-Rluc cell mRNA [Lane 1, molecular weight markers (100 bp); lane 2, C6-hRluc; lane 3, C6-Rluc; lane 4, C6 control], (b) The total protein was extracted from C6, C6-Rluc and C6-hRluc cells using Laemmli’s sample buffer. Equal amount (10 μg) of cellular protein was loaded in each lane. A higher expression of hRL is observed as compared to RL as seen by the 35 kDa band in the western blot treated with anti-Renilla antibody. [lane 1, C6 control cells; lane 2, C6-hRluc; lane 3, C6-Rluc]. 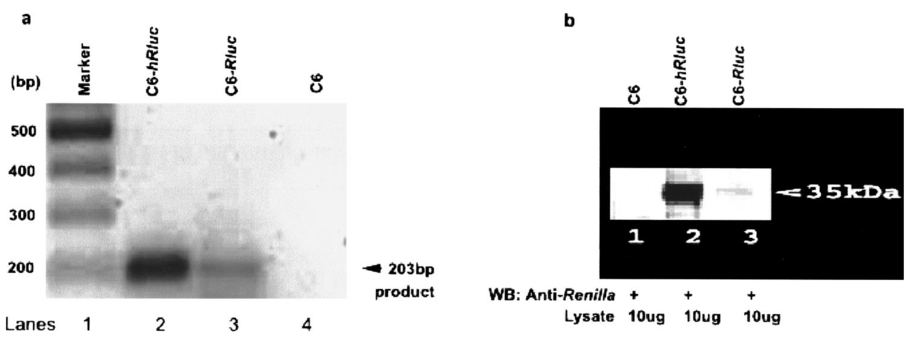 There is also a corresponding higher production of hRL versus RL as seen in the western blot [Fig. 3(b)]. C6-hRluc cell lysates show a more intense band (lane 2) than that of C6-Rluc cells lysates (lane 3). The control (lane 1) shows no detectable signal in the blot. 3.4.hRL Signal Enhances with Increasing Coelenterazine Dose in Living MiceC6-hRluc cells were subcutaneously implanted into the left forearm of mice (N=2) while mock-transfected C6 cells were implanted in the right thigh. Mice injected with very low doses of coelenterazine (0.07 mg/kg body weight) via tail vein show a measurable signal of ∼1.6×10⁵±1.1×10⁴ maximum (p/s/cm2/sr) from a ROI drawn on images over the site of implantation at the left shoulder area. There is a progressive increase in the bioluminescence from the implanted cells with increasing coelenterazine dose from 0.07 to 2.1 mg/kg body weight (Fig. 4). The C6 control site at the right thigh region shows a signal of ∼5.8×10³±8.0×10²−1.3×10⁴±1.9×10³ maximum (p/s/cm2/sr). Figure 4RL bioluminescence in living mice is dependent on the dose of coelenterazine injected. Coelenterazine doses ranging from 0.07 to 2.1 mg/kg body weight were injected via tail vein in duplicate sets of CD1 mice subcutaneously implanted with C6-hRluc and C6 control cells. The ROI signal increases as a function of higher coelenterazine dose from the C6-hRluc site. The error bar represents mean±SEM. 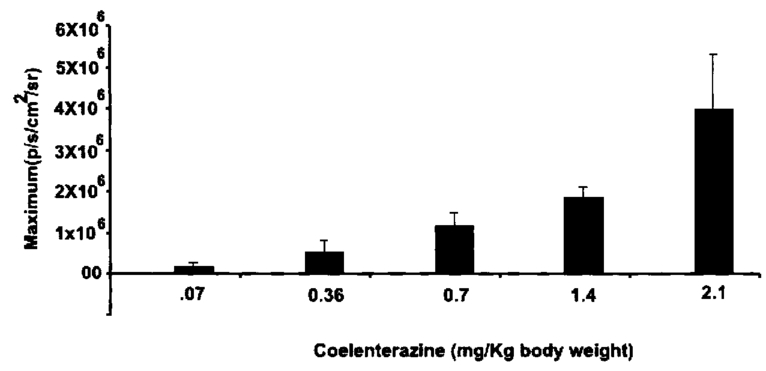 3.5.C6-hRluc Cells Yield Significantly Higher Signal Than C6-Rluc Cells When Both Sets of Cells are Implanted in the Same Living Mouse and Imaged SimultaneouslyTo compare the signal emission from a living mouse by a cooled CCD camera, C6-Rluc, C6-hRluc, and C6 control cells were implanted at three separate s.c. sites in living CD-1 mice (N=3). Coelenterazine (0.7 mg/kg body weight) was injected via tail vein. There is ∼25–30-fold difference in the detectable signal by cooled CCD camera between the two reporters, with synthetic Renilla showing significantly higher (P<0.05) and prolonged signal emission [Fig. 5(a)]. The C6-hRluc site shows signals up to 4.3×10⁶±2.4×10⁵ maximum (p/s/cm2/sr) in the first minute of scan which drops to 4.1×10⁵±3.9×10⁴ maximum (p/s/cm2/sr) after 15 min, whereas the signal from the C6-Rluc implanted site is 1.5×10⁶±0.8×10⁴ maximum (p/s/cm2/sr) and drops to 1.7×10⁴±0.72×10³ maximum (p/s/cm2/sr) within 15 min [Fig. 5(b)]. Control mice with no implanted cells, when injected with coelenterazine (0.7 mg/kg body weight), show a background signal of ∼3.1×10³±0.5×10² maximum (p/s/cm2/sr). Figure 5Optical imaging of mice carrying both C6-hRluc and C6-Rluc cells at two different s.c. sites. A mouse was injected subcutaneously with C6-Rluc, C6-hRluc, and C6 control cells on the left forearm, right forearm, and right thigh regions, respectively. Injection of coelenterazine (0.7 mg/kg body weight) via tail vein shows bioluminescence from both the C6-Rluc and C6-hRluc sites simultaneously with distinct kinetics. (a) An image recorded from a mouse using a 1 min scan with the cooled CCD camera demonstrating the higher signal from C6-hRluc as compared to C6-Rluc cells and background signal from the site of C6 cells. R and L represent the right and left side of the mouse resting in supine position. (b) Data demonstrating significantly higher and prolong signal from the C6-hRluc site as compared to the C6-Rluc site. Note the y axis is in log scale. 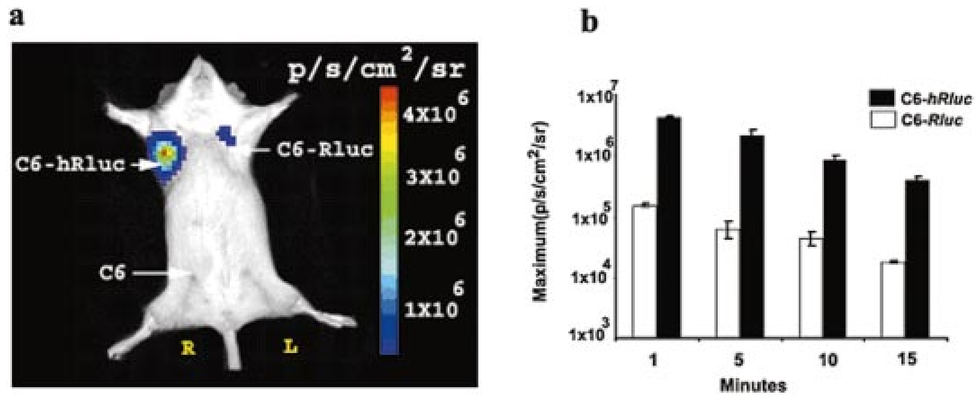 The lysates from the same batches of C6-hRluc cell show 104-fold higher signals (4.9×10³±5.1×10² RLU/μg/s) compared to C6-Rluc cell lysate (47±2.1 RLU/μg/s) when checked in the luminometer. C6 control cell lysates had negligible signal. 3.6.Measurable Signal is Detected from Living Mice Subcutaneously Implanted with 10–100 293T-hRluc CellsSince 293T-hRluc cells were observed to give the highest signal in the luminometer (Fig. 1), these cells were subcutaneously implanted in nude mice (N=2) to check for the minimum number of imagable cells. Detectable signals (P<0.05) were seen from as few as 10 cells [2.25×10⁴±7.3×10³ maximum (p/s/cm2/sr)] and 100 cells [4.4×10⁴±2.9×10³ maximum (p/s/cm2/sr)] implanted at s.c. sites by Hamilton syringe in low volume (5 μL) of buffer. The nontransfected control cells show a background signal ∼2.5×10³±2.3×10² maximum (p/s/cm2/sr). 3.7.RT-PCR and Luminometer Studies Show a Higher Message Level and Signal Production from C6-hRluc Cells as Compared to C6-Fluc CellsThe RT-PCR study [Fig. 6(a)] shows a higher level of message production from C6-hRluc cells seen as a stronger band (lane 4) as compared to C6-Fluc cells (lane 2). Both amplified a product size of ∼203 bp. The control cells do not show any detectable band in the blot (lane 1). The mean intensity (MI) of the hRluc band is 117.16 and Fluc band is 91.12, whereas the control area is ∼65.52. Figure 6Cell Culture and RT-PCR of C6/C6-Fluc/C6-hRluc cell extracts. Total RNA from C6-hRluc cells and C6-Fluc cells were isolated and equal amounts analyzed by reverse transcription PCR as described in the Experimental Protocol. The ∼203 bp RT-PCR products were separated in 2 agarose gel stained with ethidium bromide (a) an inverted image of the gel shows a higher amount of RT-PCR product from C6-hRluc mRNA as compared to C6-Fluc cell mRNA [Lane 1, C6 control; lane 2, C6-Fluc; lane 3, molecular weight markers (100 bp): lane 4, C6-hRluc]. (b) The cell culture data show ∼17-fold difference in the signal from C6-hRluc as compared to C6-Fluc cell lysates when checked in the luminometer. Data represented as RLU/μg protein/s/β-gal activity and the error bar represents mean±SEM. Note the y axis is in log scale.  In cell culture experiments, C6 cells transfected with pCMV-Fluc show ∼17–20-fold lower signal in a luminometer as compared to C6-hRluc cell lysates when normalized to the β-Gal activity [Fig. 6(b)]. 3.8.C6-hRluc Yields Significantly Higher Signal Than C6-Fluc Cells When Implanted Subcutaneously in the Same Living MouseC6-Fluc and C6-hRluc cells were implanted at two separate s.c. sites in the same living CD-1 mice (N=3) and a mixture of D-Luciferin:coelenterazine was injected via tail vein in order to compare the signal emission from two different reporters using two different substrates. The signal from C6-hRluc cells (left forearm) peaks up to 4.7×10⁶±6.7×10⁴ maximum (p/s/cm2/sr) within the first minute after coelenterazine injection. However, C6-Fluc cells implanted on the right forearm take ∼8–10 min to reach the peak signal [1.3×10⁵±1.7×10⁴ maximum (p/s/cm2/sr)]. A detectable signal from the C6-Fluc implanted site can be first seen ∼3–5 min after the injection of the substrate by the cooled CCD camera (data not shown). The measurable signals from the C6-hRluc cell implanted site were ∼30–40-fold higher than C6-Fluc cells. C6 control cells implanted at the right thigh region show only background signal (Fig. 7). Figure 7Optical imaging of mice carrying subcutaneous C6-hRluc, C6-Fluc cells, and C6 cells after tail-vein injection of a mixture of coelenterazine and D-Luciferin. A mouse was injected subcutaneously with C6-Fluc, C6-hRluc and C6 control cells on the right forearm, left forearm and right thigh regions, respectively. Injection of a coelenterazine and D-Luciferin mixture via tail vein shows bioluminescence from both the sites simultaneously with distinct kinetics. R and L represent the right and left side of the mouse in the supine position. 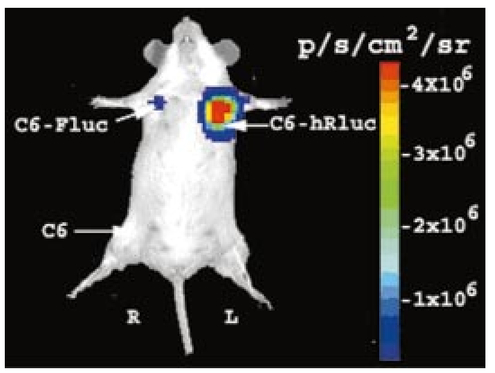 3.9.C6-hRluc Yields Higher Signals Than C6-Fluc Cells When Cells Traffic to Lungs in the Same Living MouseC6-Fluc and C6-hRluc cells were mixed and injected via tail vein in the same mice so that the cells could traffic to deeper lung tissue. The substrates coelenterazine and D-Luciferin were injected separately in order to compare the signal emission from the two different reporters from the same site. We have previously reported that there was no cross reactivity between hRL:D-Luciferin and FL:coelenterazine. The signals from both the reporters were emitted from the lung region as seen in Fig. 8(a). The signal from C6-hRluc cells peaks up to 1.2×10⁵±4.4×10⁴ maximum (p/s/cm2/sr) within the first minute after coelenterazine injection [Fig. 8(a1)]. Whereas C6-Fluc cells took around ∼8–10 min to reach the peak signal of 2.8×10⁴±2.7×10³ maximum (p/s/cm2/sr) by the cooled CCD camera [Fig. 8(a2)]. It should be noted that a higher dose of coelenterazine (5.7 mg/kg body weight) was used for these experiments. We also selected larger adult mice with maximum body weight to study the signal emission from deep tissues. The measurable signals from the C6-hRluc cells in the lungs were ∼4-fold higher than C6-Fluc cells even from the deeper tissues [Fig. 8(b)]. Figure 8Optical imaging of mice with C6-hRluc and C6-Fluc cells trafficked to lungs. A mouse was injected with a mixture of one million C6-Fluc and one million C6-hRluc cells via tail vein. The cells were allowed to traffic into the lungs by waiting for 2 h. (a) Separate injection via tail vein of coelenterazine (5.7 mg/kg) and 2 h later with i.p. injection of D-Luciferin (150 mg/kg) shows different levels of signal from the two cell populations in the same mouse. The animal injected with coelenterazine (1; left panel) shows a significantly (P<0.05) higher signal from the C6-hRluc population located in the lung region as compared to the same animal injected with D-Luciferin after 2 h (2; right panel). (b) Mean data from three mice demonstrating significantly higher (P<0.05) signal from C6-hRluc as compared to the C6-Fluc cells in the lung region. Note the y axis is in log scale. Error bars represent SEM. 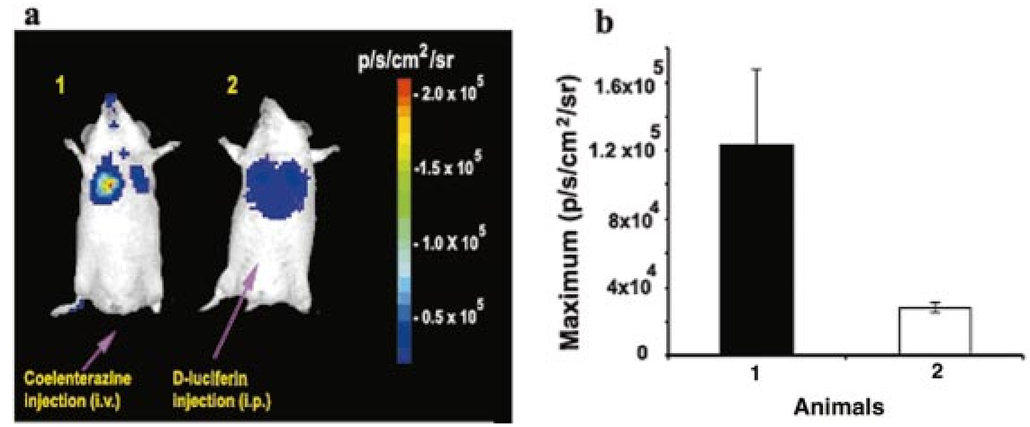 4.DiscussionIn our previous study we have shown that Rluc can be successfully used for real time imaging studies in living animals using a cooled CCD camera.10 Upon tail-vein injection of coelenterazine, the RL enzyme in the presence of coelenterazine and oxygen generates a flash of blue luminescence with a wavelength centered at ∼482 nm. In the current study, we have worked with an improved version of the Renilla luciferase reporter gene termed synthetic Renilla luciferase (hRluc). Though the nucleotide sequence of hRluc retains only 72 homology with the native Rluc, the amino acid sequence is unchanged (36 kDa protein) producing the same light yield centered at ∼482 nm.15 We initially demonstrated that the hRluc reporter gene is well adapted for mammalian cells and can be transiently transfected into a variety of cell types as we and others have previously reported to be the case with Rluc. In all the cell lines tested, there is a significant increase in the measured signal with hRluc as compared to Rluc while taking into account transfection efficiency. The absolute amount varied with cell type as shown in Fig. 1. The kinetics of light production from C6-hRluc cell culture lysates is rapid and ∼100–250-fold higher than C6-Rluc cell lysates when studied with various doses of coelenterazine. The signal from hRluc cell lysates peaks with increasing coelenterazine dose and then decreases similar to the signals from Rluc as we reported earlier.10 We show that the higher yield of signal from pCMV-hRluc transfected cells was due to a significantly higher level of transcription efficiency leading to more mRNA production as verified by RT-PCR [Fig. 3(a)]. Subsequent up-regulation of luciferase enzyme (hRL) in cells is further confirmed by western blot analysis using an anti-Renilla antibody [Fig. 3(b)]. The results in living mice carrying both C6-Rluc and C6-hRluc cells implanted subcutaneously, and tail-vein injected with coelenterazine, show differences in light yield from the two sites of cell implantation and correlated to the cell culture data. The typical pattern of flash kinetics was observed within the first minute of coelenterazine injection from both sites. The magnitude of the signal from the C6-hRluc cell implanted site is about ∼25–30-fold more than that of C6-Rluc cells. The relative advantage in vivo is still quite high as expected, but the absolute fold drops primarily due to light attenuation in tissue. The light from the C6-Rluc cells rapidly extinguishes within 15 min whereas the signal from C6-hRluc cell implanted site tends to persist beyond 15 min. The kinetics of measurable light production from regions containing C6-hRluc cells is also dependent on the doses of coelenterazine injection as we have previously observed with C6-Rluc cells.10 However, with C6-hRluc, even a very low dose of coelenterazine (0.07 mg/kg body weight) yields a measurable signal with the cooled CCD camera. C6 control cells implanted in mice show only background signal when mice were tail-vein injected with coelenterazine as we have previously observed.10 The background signal of ∼3.1×10³±0.5×10² maximum (p/s/cm2/sr) from control mice with no implanted cells, could be due to various factors including low levels of light emitted from the mice even though there is no bioluminescence, low levels of photons in the “light-tight” box, as well as noise from the cooled CCD camera due in part to thermal drift. Since cells transfected with synthetic Renilla luciferase show an improvement in signal level, it is important to study the minimum number of cells that lead to detectable signal. We selected 293T-hRluc cells for this purpose, as they show maximum signal in the cell culture study (Fig. 1). Results show measurable signal from as low as ten cells when implanted at a subcutaneous site of a living mouse. It should be noted that the ten cells were implanted in 5 μL PBS using a 5 μL Hamilton syringe, so that the cells were at close proximity. Injecting very few cells in higher volume of buffer gave inconsistent results, as the cells were spread over a larger area. However, 100 cells at a subcutaneous site gave a significant and consistent signal. Such observations may aid in future cell trafficking studies involving fewer cells.18 This improvement in the signal yield from C6-hRluc cells from small animals can be useful for several experimental strategies including: (i) significant signal with lower doses of substrate injection to animals, (ii) detectable signal from much fewer number of cells, or (iii) gene expression involving rare molecular events/weak promoters could be more easily imaged. To date, Fluc is the most thoroughly characterized reporter gene used for noninvasive imaging studies in small animals with optical bioluminescence approaches.4 In the present study we attempt to compare the signal of FL with that of hRL both in cell culture and from mice to see which is more sensitive for noninvasive studies. No absolute comparison of the two reporters was performed as there are differences in gene size, reaction parameters, substrate chemistry, as well as substrate pharmacokinetics. The lack of significant cross reactivity between the two reporters and their corresponding substrates10 provides for a basis to study and compare both hRluc and Fluc in the same living mouse. FL: D-Luciferin produces light with a peak in the range of 595–620 nm in the presence of oxygen, ATP and the cofactor magnesium, whereas hRL: coelenterazine produces light which peaks at ∼482 nm. Since the optical properties of mammalian tissue involve attenuation of light <600 nm, the chances of acquiring measurable signals from Fluc is greater. However, the cell culture study shows ∼104-fold more signal in the luminometer from C6-hRluc than those C6-Fluc cell lysates. Also, the measurable signal from C6-hRluc is found to be ∼30–40-fold more than C6-Fluc when cells are implanted subcutaneously in the same mouse and imaged by the cooled CCD camera. There can be several reasons for lower detectable signal from C6-Fluc cells. The FL:D-Luciferin reaction requires ATP from the cells to generate the light. This could be a limiting factor for higher signal yield as the reaction may subside with lower levels of cellular ATP. Also, utilizing cellular ATP reserve for the reaction may perturb cellular machinery. One key advantage of the Rluc/hRluc:coelenterazine reaction is that it does not utilize any ATP. It is known that the signal wavelength of hRluc:coelenterazine is centered at ∼482 nm where chances of attenuation of light from mammalian tissue is greater. There are also reports of faster rate of coelenterazine degradation and inactivation in tissues.19 However, the initial light yield from the hRL:coelenterazine reaction is so high that the measurable light is significantly higher than that of Fluc reporter even after attenuation by tissue at the depths and locations tested. It should be noted that the signal from the mouse could be controlled by the amount of substrate injected in each animal. There is a significant difference in the substrate dose of coelenterazine and D-Luciferin injected in each group of mice. The dose of D-Luciferin is ∼150 mg/kg body weight and that of coelenterazine is only ∼0.7 mg/kg body weight for most of the studies. With even a 150-fold lower dose of substrate (coelenterazine) we can see ∼30–40-fold more signal from C6-hRluc implanted cells as compared to C6-Fluc cells from the same mouse at the s.c. site. However, there is a marked decrease in the signal difference when signals are acquired from C6-hRluc cells present in deeper tissues such as the lungs. This was compensated for, by injecting higher doses of coelenterazine (∼5.7 mg/kg) via the tail vein. For the higher dose of coelenterazine, the signals emitted from C6-hRluc cells in lungs were ∼4-fold higher than C6-Fluc cells situated in the same location. It should be noted that since equal numbers of cells are used, and there is a difference in transfection efficiency of ∼30 in favor of pCMV-hRluc, that a more accurate fold difference is ∼4×0.7=∼threefold at the particular doses of coelenterazine and D-Luciferin utilized. However, in order to do an absolute comparison between Renilla and Firefly luciferase, one would need to know the exact levels of active FL and hRL, as the levels of transcription are likely different, even though transfection efficiency can be corrected for. The exact dose of D-Luciferin and coelenterazine are two additional variables that will need to be optimized for a given experimental strategy. It will be important in future studies to also study other deep tissue sites of expression (e.g., liver, brain, etc.). It is also possible that D-Luciferin and/or coelenterazine efflux from cells could be affected by levels of P-glycoprotein and other multi-drug-resistance mechanisms, and this will also have to be further investigated. Three repeated doses of coelenterazine as high as ∼3.5 mg/kg body weight and a single dose as high as 5.7 mg/kg did not show any toxicity effects of sudden death, lethargy, weight loss, and changes in vital signs. Formal toxicology studies will be needed to better define any potential toxicity of coelenterazine as a function of dose and frequency of administration. Formal toxicology studies for D-Luciferin are also needed. It should also be noted that our current costs for coelenterazine and D-Luciferin are approximately $75/mg (Prolume Ltd.) and $0.80/mg (Xenogen Corp.), respectively. Therefore at the typical doses used for each substrate (micrograms of coelenterazine and milligrams of D-Luciferin), the costs per mouse study are near equivalent. Additional work to further characterize relative advantages/disadvantages of Fluc and hRluc in living subjects should help to further accelerate bioluminescence based research. The use of bioluminescence in various paradigms in living subjects including gene delivery, cell trafficking, and transgenic models is already possible. We now show hRluc as a more sensitive primary reporter gene as compared to Rluc in various in vivo studies. We also show that the hRluc signal is significantly higher than Fluc at subcutaneous sites under transient transfection conditions. For lung imaging, higher doses of coelenterazine were needed in order to achieve signal greater than that with Fluc. The current work helps further clarify the issues surrounding the use of Rluc, hRluc, and Fluc as reporter genes for bioluminescence imaging in living subjects. AcknowledgmentsWe would like to thank R. Paulmurugan for his useful technical suggestions. We thank David Stout for helping with the CCD camera calibration. This work is supported in part by NIH R0-1 CA82214, SAIRP R24 CA92865, and Department of Energy Contract No. DE-FC03-87ER60615. REFERENCES
P. Ray
,
E. Bauer
,
M. Iyer
,
J. R. Barrio
,
N. Satyamurthy
,
M. E. Phelps
,
H. R. Herschman
, and
S. Gambhir
,
“Monitoring gene therapy with reporter gene imaging,”
Semin Nucl. Med. , 31 321
–320
(2001). Google Scholar
T. F. Massoud
and
S. S. Gambhir
,
“Molecular imaging in living subjects: seeing fundamental biological processes in a new light,”
Genes Dev. , 17 545
–580
(2003). Google Scholar
R. M. Hoffman
,
“Orthotopic transplant mouse models with green fluorescent protein expressing cancer cells to visualize metastasis and angiogenesis,”
Cancer Metastasis Rev. , 17 271
–277
(1998). Google Scholar
C. H. Contag
and
B. D. Ross
,
“It’s not just about anatomy: in vivo bioluminescence imaging as an eyepiece into biology,”
J. Magn. Reson Imaging , 16 378
–387
(2002). Google Scholar
V. Ntziachristos
,
C. H. Tung
,
C. Bremer
, and
R. Weissleder
,
“Fluorescence molecular tomography resolves protease activity in vivo,”
Nat. Med. , 8 757
–761
(2002). Google Scholar
L. Josephson
,
M. F. Kircher
,
U. Mahmood
,
Y. Tang
, and
R. Weissleder
,
“Near-infrared fluorescent nanoparticles as combined MR/optical imaging probes,”
Bioconjugate Chem. , 13 554
–560
(2002). Google Scholar
X. Wu
,
H. Liu
,
J. Liu
,
K. N. Haley
,
J. A. Treadway
,
J. P. Larson
,
N. Ge
,
F. Peale
, and
M. P. Bruchez
,
“Immunofluorescent labeling of cancer marker Her2 and other cellular targets with semiconductor quantum dots,”
Nat. Biotechnol. , 21 41
–46
(2003). Google Scholar
C. H. Contag
and
M. H. Bachmann
,
“Advances in in vivo bioluminescence imaging of gene expression,”
Annu. Rev. Biomed. Eng. , 4 235
–260
(2002). Google Scholar
M. DeLuca
and
W. D. McElroy
,
“Kinetics of the firefly luciferase catalyzed reactions,”
Biochemistry , 13 921
–925
(1974). Google Scholar
S. Bhaumik
and
S. S. Gambhir
,
“Optical imaging of Renilla luciferase reporter gene expression in living mice,”
Proc. Natl. Acad. Sci. U.S.A. , 99 377
–382
(2002). Google Scholar
W. W. Lorenz
,
R. O. McCann
,
M. Longiaru
, and
M. J. Cormier
,
“Isolation and expression of a cDNA encoding Renilla reniformis luciferase,”
Proc. Natl. Acad. Sci. U.S.A. , 88 4438
–4442
(1991). Google Scholar
H. K. Matthews
and
M. J. Cormier
,
“Purification and properties of Renilla reniformis luciferase,”
Biochemistry , 16 85
–91
(1977). Google Scholar
W. W. Lorenz
,
M. J. Cormier
,
D. J. O’Kane
,
D. Hua
,
A. A. Escher
, and
A. A. Szalay
,
“Expression of the Renilla reniformis luciferase gene in mammalian cells,”
J. Biolumin. Chemilumin. , 11 31
–37
(1996). Google Scholar
A. Rehemtulla
,
L. D. Stegman
,
S. J. Cardozo
,
S. Gupta
,
D. E. Hall
,
C. H. Contag
, and
B. D. Ross
,
“Rapid and quantitative assessment of cancer treatment response using in vivo bioluminescence imaging,”
Neoplasia , 2 491
–495
(2000). Google Scholar
Y. Zhuang
,
B. Butler
,
E. Hawkins
,
A. Paguio
,
L. Orr
,
M. Wood
, and
K. V. Wood
,
“New synthetic Renilla gene and assay system increase expression, reliability and sensitivity,”
Promega Notes , 79 6
–11
(2001). Google Scholar
M. Kozak
,
“At least six nucleotides preceding the AUG initiator codon enhance translation in mammalian cells,”
J. Mol. Biol. , 196 947
–950
(1987). Google Scholar
J. C. Wu
,
G. Sunderasan
,
M. Iyer
, and
S. Gambhir
,
“Noninvasive optical imaging of Firefly luciferase reporter gene expression in skeletal muscles of living mice,”
Mol. Therapy , 4 297
–306
(2001). Google Scholar
S. Mandl
,
C. Schimmelpfennig
,
M. Edinger
,
R. S. Negrin
, and
C. H. Contag
,
“Understanding immune cell trafficking patterns via in vivo bioluminescence imaging,”
J. Cell Biochem. Suppl. , 39 239
–248
(2002). Google Scholar
C. E. O’Connell-Rodwell
,
S. M. Burns
,
M. H. Bachmann
, and
C. H. Contag
,
“Bioluminescent indicators for in vivo measurements of gene expression,”
Trends Biotechnol. , 20 S19
–S23
(2002). Google Scholar
|


