
|
|
1.IntroductionA practical but crucial problem in studies of individual cells has been the choice of preparation method. Preferably, the cell should be immobilized without changing its intrinsic properties, while permitting variation of the external environment. Since the development of the first single-beam gradient optical trap by Ashkin and Dziedzic1 in 1986, optical tweezers have emerged as a powerful immobilization tool in molecular and cell biology. The technique of trapping an object under the microscope allows the user not only to be a passive observer, but also to actually control and manipulate the object studied under sterile conditions. The use of infrared (IR) wavelengths has improved the feasibility of optical traps further, since significantly less optical damage to a variety of living cells is observed.2 3 One of the strengths of optical tweezers is that they can be integrated and combined with different imaging systems and spectroscopic techniques.4 5 Here we are interested in the development of a so-called Raman tweezers, where the optical tweezers are integrated in a Raman spectrometer for vibrational spectroscopic analysis. This development dates back to 1994, when Lankers et al.;6 combined optical trapping with Raman and fluorescence spectroscopy to study single microparticles in water. Since then, several applications of the Raman tweezers have been reported7 8 9 10 11 12 and recently the first single-cell study was presented.13 Vibrational Raman spectroscopy, i.e., inelastic light scattered from vibrational modes, is an attractive optical technique because it provides direct access to the identity and relative concentration of molecules. Vibrational resonance Raman scattering occurs when the frequency of the exciting light falls within an electronic absorption band of the investigated molecule and leads to a strong enhancement of the Raman intensity. In this paper, we focus on hemoglobin (Hb) within functional red blood cells (RBCs). Resonance Raman scattering from Hb occurs only at its prosthetic group because only this part of the molecule absorbs in the visible and near ultraviolet region. Thus it is possible to investigate exclusively vibrations of the four heme groups of Hb without interference by scattering of the surrounding globin or other parts of the RBC. The resonance Raman spectra of Hb provide information about the oxidation and spin state of the heme irons, and the Raman bands are well known for several resonance excitation lines.14 15 16 The Raman excitation lines used in the present study (488.0, 514.5, and 568.2 nm) cause resonance enhancement as a result of the combined effect of the Soret band (415 nm) and the Q bands (α-band at 577 nm and β-band at 541 nm). However, different vibrational modes exhibit different degrees of resonance enhancement, depending on which resonance process dominates for the particular mode symmetry and normal coordinate. Because of this variation, the appearance of a hemoglobin resonance Raman spectrum strongly depends on the wavelength of the excitation.14 This could be an important aspect in future Raman spectroscopic diagnosis of RBC disorders, since certain alterations in the spectra of infected or sick cells might be most prominent for certain resonance Raman excitation lines. In early Raman spectroscopic investigations of single RBCs, the cells were immobilized by methanol fixation on a glass slide in air.17 Although it was shown that this method allowed the successful identification of erythrocytes infected by a malaria parasite, the cells were obviously not in an in vivo environment. Other Raman studies have demonstrated that Hb spectra from RBCs did not differ from purified Hb spectra,14 which is a great advantage since leaving Hb in its natural environment slows down protein degradation. Recently we studied single human RBCs immobilized on polylysine-coated glass slides in buffer solution.18 It was found that both the type of glass coating and the laser irradiation had an important influence on the Raman spectra and global Raman images of RBCs and Hb. The RBCs lost their intrinsic shape as a result of substrate-induced effects caused by the polylysine coating, and a photoinduced increase in fluorescence was observed for excitation at 514.5 nm.18 This shows that extreme care has to be taken to avoid spurious effects caused by the measurement itself. Under the right conditions, however, the Hb within the RBC remained functional over a long period of time, and a series of Raman spectra could be recorded during the oxygenation course from the same erythrocyte. The experiment clearly showed that Raman spectroscopy is a powerful tool for single-cell studies. Nevertheless, the choice of the right Raman excitation wavelength is crucial, not only to enhance certain bands, but also to prevent cell degradation.19 The Raman study of Hb in different oxidation states within single RBCs using 632.8-nm excitation by Wood et al.;20 is promising in this respect since no degradation has been observed at this wavelength. In this report we describe and test a combined optical tweezers—micro-Raman setup suitable for single-cell studies. The system differs from earlier setups in that a double-microscope configuration is used, so that the optical tweezers are separated from the micro-Raman spectrometer. One can then choose the appropriate microscope objectives, laser powers, and wavelengths for trapping and Raman excitation separately. Hence, it is possible to find optimal conditions for both optical processes independently. 2.Materials and MethodsThe goal of this study was to develop a setup that enables resonance Raman spectroscopy of single cells immobilized by an optical tweezers. This is accomplished by separating the optical path of the lasers used for the tweezers and the Raman excitation. Trapping is achieved by tightly focusing IR laser radiation through an inverted oil-immersion objective, which is facing the objective used for collection and excitation of Raman-scattered light. A schematic of the setup is shown in Fig. 1. Figure 1Schematic of the double-microscope Raman tweezers setup. Raman spectra were excited with an Ar:Kr laser while an IR diode laser (SDL-5432) operating at 830 nm was used for the tweezers. A 100× oil-immersion objective (NA=1.25) was used to trap the sample from below. The illumination and backscattering collection system consisted of a confocal microscope coupled to a single-grating spectrometer. The Rayleigh scattered signal was suppressed with a notch filter (Kaiser), while light from the IR diode laser was blocked with a high pass IR-blocking filter. The microscope objective used for the micro-Raman setup was a 60× water-immersion objective (NA=0.9).  Raman spectra are excited using an argon:krypton (Ar:Kr) laser (Spectra-Physics 2060), tuned to 488.0, 514.4, or 568.2 nm. The excitation and backscattering collection system consists of a confocal microscope equipped with a 60× water-immersion objective (NA=0.9) coupled to a single-grating spectrometer (Dilor XY800). The Rayleigh scattered signal is suppressed with an angle-tuned holographic notch filter (Kaiser). In order to block the IR light from the diode laser, an additional high-pass interference filter (750CFSP, Melles Griot) is mounted between the notch filter and the variable slit. A diode laser (SDL-5432) emitting at 830 nm is used for the tweezers. In an investigation of the intensity dependence of photodamage for tweezers on Escherichia coli in the near IR region,3 it was shown that the 830-nm region is less harmful than 870 or 910 nm. Even though RBCs are optically different from E. coli bacteria, the 830-nm wavelength is to be preferred since water has a low absorption coefficient at this wavelength. Trapping is achieved by utilizing an inverted oil-immersion objective with a high numerical aperture (NA=1.25). The procedure used to align the optical tweezers is according to Gokso¨r et al.;4 The first step is to create an optical trap movable in the x-y -plane; this is achieved by imaging the entrance aperture of the microscope objective, with a tube of 160 mm, on a gimbal-mounted mirror (GMM) using an external lens positioned at a distance equal to 160 mm plus the focal length measured from the objective entrance. Second, an optical trap in the z-direction is built. A telescope consisting of two lenses separated by a distance equal to the sum of their focal lengths is integrated into the light path so that the size of the beam at the GMM is held constant. In order to avoid unnecessary illumination from the diode laser, a shutter is integrated into the beam path of the tweezers. Consequently, the tweezers are only activated when required, and additional damage caused by IR radiation can be avoided. To determine whether the object and image planes of the Raman system and the tweezers coincide, an external CCD camera coupled to a screen is used. Observation and imaging of the sample are straightforward and it is possible to ensure that only one cell is trapped during measurements and that the RBC is trapped in the bulk, which is confirmed if the cell moves into an upright position along the trapping beam, as can be seen in Fig. 2(b). Cells adsorbed to the glass slide cannot be efficiently trapped or moved, and stay in the same position. Figure 2Bright-field images taken with the external CCD. (a) The red blood cells in the buffer solution. (b) The trap is activated and a single RBC is trapped, whereupon it turns into an upright position, which serves as an evidence that the RBC is in the bulk and not adsorbed onto the slide. (c) The focal point of the Raman excitation beam. Note how the focus of the Raman and the trapping lasers coincide with micrometer precision. 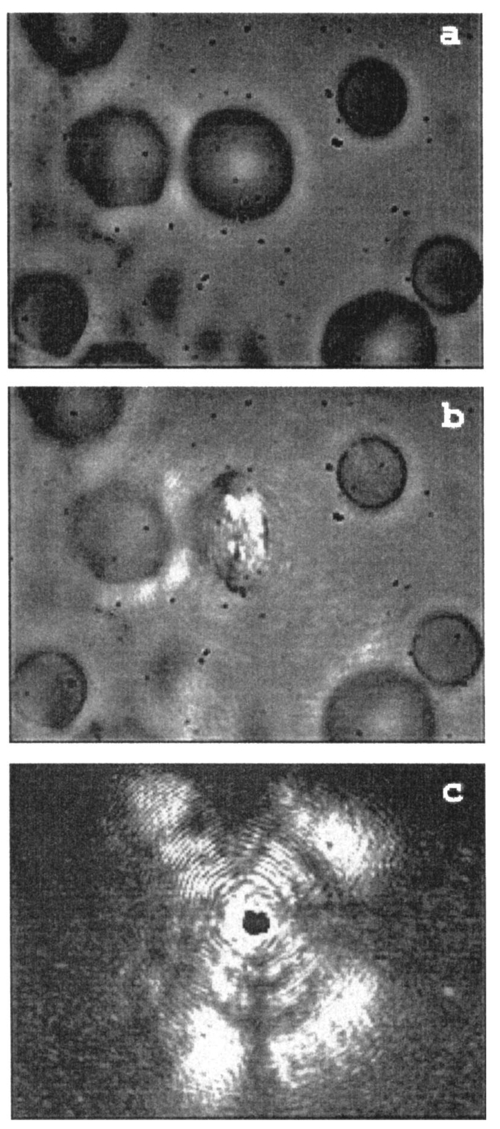 Samples were prepared according to the following procedure. Human adult blood (1 μl) drawn from the fingertip of a healthy subject (an author) was diluted in 2 ml of a saline phosphate buffer (pH 7, 0.1 mM, Sigma-Aldrich) and a drop of ∼300 μl was placed on a cover glass and put on the microscope table. Thus cells were kept in buffer at all times. This sample setup has the advantage that the surrounding buffer can be changed during the course of an experiment and that chemicals can be added to the buffer while keeping the same cell in the laser focus. The buffer also reduces the thermal heating caused by the laser radiation. The temperature increase T was estimated for both laser beams by solving the steady-state heat conductivity equation for a Gaussian beam profile P(r), assuming that all power absorption occurs in water. One then has where α is the wavelength-dependent absorption coefficient [α (488 nm)≈0.0144 m −1, α (514 nm)≈0.0396 m −1, α (568 nm)≈0.0672 m −1, and α (830 nm)≈3.195 m −1] ; k is the thermal conductivity for water (0.6 W/m⋅K); and I≈P(r)/α is the heat source. The resulting total temperature increase within the sample was calculated to be less than 1 Kelvin. Thus we assume that thermally induced damage can be neglected.3.Experimental Results And DiscussionThe functionality of the Raman tweezers setup was first investigated by comparing reference Raman spectra recorded from an RBC adsorbed to the cover glass with spectra recorded from an RBC trapped through 830-nm radiation, i.e., with the tweezers integrated into the system. In the latter case, an interference IR-blocking filter had to be mounted inside the Raman spectrometer to avoid saturation of the nitrogen-cooled CCD detector. The power of the Raman excitation laser measured at the objective mount was usually about 0.75 mW. Given a laser focal diameter of ∼1 μm, the irradiance at the sample is then ∼80 kW/cm 2. The power of the trapping laser was ∼120 mW measured at the same position, and the corresponding irradiance at the sample was ∼13 MW/cm 2. Spectra were recorded for three different Raman excitation lines (488.0, 514.5, and 568.2 nm, respectively) while the trapping conditions were kept constant. The background spectra of the buffer solution were taken next to the RBC used for experiments. The background spectra were smoothed with a binomial algorithm to prevent introduction of more noise into the resulting spectrum when background corrections had to be applied. The results from these measurements are shown in Fig. 3. Figure 3Testing of the Raman tweezers setup using three different laser lines for Raman excitation (λ=488.0, 514.5, and 568.2 nm from top to bottom). The integration time for all spectra is 30 s and the Raman excitation power is ∼0.75 mW. A is the reference spectra with the RBC adsorbed onto a cover glass (i.e., the tweezers and the IR-blocking filter are removed from the setup). The most prominent bands are denoted by numbers in the A spectra, according to Table 1. All spectra in A are divided by a factor of 4. The C spectra are taken with the tweezers (830 nm, 120 mW in the oil-immersion objective). IR illumination inside the spectrometer is removed by an IR-blocking filter mounted after the notch filter. D are smoothed background spectra taken next to the trapped RBC, while B are the spectra of the trapped cells with the background subtracted (B=C−D).  The spectra obtained for the three excitation wavelengths applied here are in good agreement with those reported in previous studies.15 16 21 The strong Raman bands observed for these excitation lines are spatially localized to the heme and are resonantly enhanced owing to coupling with the Soret or Q states of the porphyrin macrocycle. The core-size or spin-state marker band region lies between 1650 and 1500 cm −1, and the three principal bands are assigned to ν19, ν37, and ν17, respectively. Between 1400 and 1300 cm −1, modes originating from pyrrole ring-stretching vibrations with different phasing can be observed. The band between 1375 and 1355 cm −1, assigned to ν4, is dramatically modified, depending on the excitation wavelength. The C―H methine deformation region consists of three bands assigned to ν13, ν13 or ν42, and ν5+ν18 vibrations. At the lower wave numbers (1200 to 600 cm −1) bands have been assigned to the asymmetric pyrrole half-ring stretching vibrations (ν30 and ν22) , C―C asymmetric stretching vibrations (ν47 and ν46) , and finally to a pyrrole breathing (ν15) and a pyrrole deformation mode (ν7). In Table 1, the symmetries of the vibrations are given according to Ref. 22, while assignments and local coordinates follow Wood and McNaughton.21 In Fig. 3, the most prominent bands are numbered according to assignments and numbers from Table 1. Table 1
When comparing spectra from the adsorbed and the trapped RBCs [spectra A and B respectively in Figs. 3(a), 3(b), and 3(c)], it is clear that the interference IR-blocking filter has a significant impact on the background shape and the signal-to-noise ratio. The effect is most prominent for the 488-nm Raman excitation line, but decreases for longer excitation wavelengths because of the transmission profile of the IR-blocking filter. However, the positions of the Raman peaks are not influenced, and appropriate background subtractions can be made to correct for the smoothly fluctuating background (spectra B in Fig. 3). In addition, we could not observe any influence of the buffer or the immersion oil on the spectra. This was verified by taking spectra of the buffer solely, with and without the tweezers and the IR-blocking filter integrated into the spectrometer (data not shown). Potential photoinduced effects on the RBCs caused by irradiation of the lasers from both the optical tweezers and the micro-Raman setup were investigated. The spectral evolution over time was observed in the case where IR irradiation only, or visible and IR irradiation were applied simultaneously. First, the influence of the visible Raman excitation line combined with the 830-nm line was studied by recording several consecutive Raman spectra at an integration time of 30 s. In Figs. 4(a) and 4(b) we show a series of five spectra for 568.2- and 514.5-nm excitation, respectively. For the 568.2-nm line, no change in the overall band intensities was observed over time and no increase of the fluorescence background that was due to illumination could be detected. This differs from measurements at 514.5 nm, seen in Fig. 4(b), where a significant increase in fluorescence is concomitant with a decrease in the Raman signal, an observation that is in agreement with our previous study of immobilized RBCs.18 This effect is even stronger for the 488-nm line (data not shown) and obviously hampers observation of subsequent dynamics triggered by environmental changes or stimuli of the sample over time. However, shifts in the Raman peaks in the region between 1500 and 1650 cm −1 are observed for both excitation lines. It is well known that these bands are sensitive to photodissociation of oxygen from the heme.20 The shifts are ascribed to photoinduced oxidation of the RBC, i.e., the Hb is transferred into the metHb state, where the oxygen is irreversibly bound to the heme. This was verified by comparing the time evolution of spectra from initially oxygenated with those from deoxygenated RBCs; in both cases a transfer into the metHb state could be observed over time. The spectra in Fig. 4(b) have been treated using a Fourier filtering algorithm to remove a high-frequency intensity modulation caused by interference in the IR-blocking filter, which was prominent when a high-fluorescence background was present. Figure 4Raman spectra of trapped cells versus time for two different excitation wavelengths: (a) 568.2 and (b) 514.5. The integration time for each spectrum was 30 s and the laser power at the microscope’s objective entrance was ∼0.75 mW, corresponding to an irradiance of 80 kW/cm 2 at the sample. The spectra in (b) have been Fourier filtered to remove intensity modulations caused by the IR-blocking filter.  The influence of the IR radiation on the RBCs was tested by the following experiment. A Raman spectrum was first recorded immediately after trapping of an RBC. The cell was then held in the trap for 10 min under constant 830-nm radiation while the Raman laser was blocked, after which a second Raman spectrum was recorded. With the external CCD camera, it was straightforward to ensure that only one cell was trapped during the experiment. As can be seen from Fig. 5, the two spectra do not differ significantly from the first and second spectra shown in Fig. 4 for the corresponding excitation wavelength, where the second Raman spectrum was taken immediately after the first one. This strongly indicates that the photodamage caused by the 830-nm illumination from the trap is negligible compared with the damage caused by visible light, which is in accord with the investigations of the intensity dependence of photodamage in the near-IR region.3 The difference in absolute intensity seen in Fig. 5 is difficult to explain, but is probably the result of a slight movement of the trapped RBC in the z direction into the Raman probe-beam focus. The results demonstrate that the photodamage is instead caused by the Raman excitation light and not by the trapping laser. Since our setup enables the use of different Raman laser lines, it is possible to investigate which one causes the least harm; in our case it is the 568.2-nm line. This will be a great advantage when studying fragile biological samples. Figure 5Raman spectra of trapped RBCs for the 568.2-nm excitation line. The integration time for each spectrum is 30 s and the power into the microscope is ∼0.75 mW, with an estimated irradiance of 80 kW/cm 2 at the sample. In 1, the spectrum is recorded immediately after trapping of the RBC and in 2 a spectrum is recorded after at least 10 min of trapping, i.e., exposure to the 830 nm trapping laser.  4.ConclusionsWe have demonstrated the potential of a novel Raman tweezers setup in which the Raman illumination and collection optics are separated from the optical tweezers. This has the advantage that the tweezers can be applied when required but are also easily removed when necessary. The setup makes it easy to find optimal measurement conditions since it is possible to independently vary the laser wavelength and power for the Raman excitation and the tweezers. The system was tested by recording resonance Raman spectra of optically trapped erythrocytes in vivo. We found that great care has to be taken to avoid photodamage caused by the visible Raman excitation, but that the IR trapping irradiation does not seem to harm the cells or alter the Hb Raman spectra. The trapping irradiation needs to be filtered out from the Raman system, which results in a somewhat decreased signal-to-noise ratio. So far, we have not been able to record Raman spectra with the 647-nm line of the Ar:Kr ion laser because the emission of the diode laser obscures the Raman spectra in that region. It would certainly be the preferred excitation wavelength, since photodamage is minimized.20 23 In order to do so, it is necessary to integrate a narrow bandpass filter in the illumination path of the diode laser, which seems to emit other lines than just the 830-nm one. Alternatively, a laser emitting light at 1064 nm can be used for trapping since it is farther away from the region of the 647-nm Raman shifts. The ability to record resonance Raman spectra of single RBCs for different resonance Raman excitation wavelengths offers many new and exciting possibilities for biomedical applications. This was previously pointed out by Wood and McNaughton,21 who predict an important potential in the diagnosis and treatment of RBC disorders such as thalassaemia, sickle-cell disease, malaria, and altitude sickness. Using resonance Raman spectroscopy, drug therapy could be observed in vivo and the physiological response and oxygen uptake could be monitored for individual cells. When trapping an RBC in the bulk, the intrinsic shape is preserved and it is easier to select particular cells with certain properties for spectroscopic investigations, than if cells are affected by adsorption to surfaces.18 Another advantage is that trapped cells can be moved into different chemical environments, where, for instance, their response to different drug treatments could be investigated. Future applications of the type of resonance Raman tweezers setup for single-cell studies described here may also include the identification of cancer cells and measurements of metabolic dynamics within cells and bacteria in real time. AcknowledgmentsThis work was sponsored by grants from the Swedish Scientific Research Council and by the Carl Tryggers Foundation for Scientific Research and the Chalmers Bioscience program. Part of the work was performed at the SWEGENE Center for Biophysical Imaging. We also would like to thank Ezio Zanghellini, Jakob Andreasson, and Joakim Holmlund from the Department of Applied Physics, Chalmers University of Technology, for valuable advice and assistance with the Dilor spectrometer. REFERENCES
A. Ashkin
and
J. M. Dziedzic
,
“Observation of a single-beam gradient force optical trap for dielectric particles,”
Opt. Lett. , 11 288
–290
(1986). Google Scholar
A. Ashkin
,
J. M. Dziedzic
, and
T. Yamane
,
“Optical trapping and manipulation of single cells using infrared laser beams,”
Nature (London) , 330 769
–771
(1987). Google Scholar
K. C. Neuman
,
E. H. Chadd
,
G. F. Liou
,
K. Bergman
, and
S. M. Block
,
“Characterization of photodamage to Escheria coli in optical traps,”
Biophys. J. , 77 2856
–2863
(1999). Google Scholar
M. Gokso¨r
,
J. Enger
,
K. Ramser
, and
D. Hanstorp
,
“An experimental set-up for combining optical tweezers and laser scalpels with advanced imaging techniques,”
Proc. SPIE , 4966 50
–57
(2003). Google Scholar
K. Ko¨nig
,
“Laser tweezers and multiphoton microscopes in life sciences,”
Histochem. Cell Biol. , 114 79
–92
(2000). Google Scholar
M. Lankers
,
J. Popp
, and
W. Kiefer
,
“Raman and fluorescence spectra of single optically trapped microdroplets in emulsion,”
Appl. Spectrosc. , 48 1166
–1168
(1994). Google Scholar
M. Lankers
,
J. Popp
,
E. Urlaub
,
H. Stahl
,
G. Ro¨sslin
, and
W. Kiefer
,
“Investigation of multiple component systems by means of optical trapping and Raman spectroscopy,”
J. Mol. Struct.: THEOCHEM , 348 265
–268
(1995). Google Scholar
M. Lankers
,
J. Popp
,
G. Ro¨sslin
, and
W. Kiefer
,
“Raman investigations on laser-trapped gas bubbles,”
Chem. Phys. Lett. , 277 331
–334
(1997). Google Scholar
W. Kiefer
,
J. Popp
,
M. Lankers
,
M. Trunk
,
I. Hartmann
,
E. Urlaub
, and
J. Musick
,
“Raman-Mie scattering from single laser-trapped microdroplets,”
J. Mol. Struct.: THEOCHEM , 408/409 113
–120
(1997). Google Scholar
K. Ajito
and
K. Torimitsu
,
“Single nanoparticle trapping using a Raman tweezers microscope,”
Spectrosc. Technique , 56 541
–544
(2002). Google Scholar
K. Ajito
and
M. Morita
,
“Imaging and spectroscopic analysis of single microdroplets containing
p
-cresol using the near-infrared laser tweezers/Raman microprobe system,”
Surf. Sci. , 427–428 141
–146
(1999). Google Scholar
C. Xie
and
Y. Li
,
“Raman spectra and optical trapping of highly refractive and nontransparent particles,”
Appl. Phys. Lett. , 81 951
–953
(2002). Google Scholar
C. Xie
,
M. A. Dinno
, and
Y. Li
,
“Near-infrared Raman spectroscopy of single optically trapped biological cells,”
Opt. Lett. , 27 249
–251
(2002). Google Scholar
H. Brunner
and
H. Sussner
,
“Resonance scattering on haemoglobin,”
Biochim. Biophys. Acta , 310 20
–31
(1973). Google Scholar
T. G. Spiro
and
T. C. Strekas
,
“Resonance Raman spectra of heme proteins. Effects of oxidation and spin state,”
J. Am. Chem. Soc. , 96 338
–345
(1974). Google Scholar
T. C. Strekas
and
T. G. Spiro
,
“Hemoglobin: resonance Raman spectra,”
Biochim. Biophys. Acta , 263 830
–833
(1972). Google Scholar
C. W. Ong
,
Z. X. Shen
,
U. A. Ang
,
U. A. Kara
, and
S. H. Tang
,
“Resonance Raman microspectroscopy of normal erythrocytes and Plasmodium berghei-infected erythrocytes,”
Appl. Spectrosc. , 53 1097
–1101
(1999). Google Scholar
K. Ramser
,
E. J. Bjerneld
,
C. Fant
, and
M. Ka¨ll
,
“Importance of substrate and photo-induced effects in Raman spectroscopy of single functional erythrocytes,”
J. Biomed. Opt. , 8 173
–178
(2002). Google Scholar
G. J. Puppels
,
J. H. F. Olminkhof
,
G. M. J. Segers-Nolten
,
C. Otto
,
F. F. M. DeMul
, and
J. Greve
,
“Laser irradiation and Raman spectroscopy of single living cells and chromosomes: sample degradation occurs with 514.5 nm but not with 660 nm laser light,”
Exp. Cell Res. , 195 361
–367
(1991). Google Scholar
B. R. Wood
,
B. Tait
, and
D. McNaughton
,
“Micro-Raman characterisation of the R to T state transition of haemoglobin within a single living erythrocyte,”
Biochim. Biophys. Acta , 1539 58
–70
(2001). Google Scholar
B. R. Wood
and
D. McNaughton
,
“Raman excitation wavelengths investigations of single red blood cells in vivo,”
J. Raman Spectrosc. , 33 517
–523
(2002). Google Scholar
B. R. Wood
and
D. McNaughton
,
“Micro-Raman characterization of high- and low-spin heme moieties within single living erythrocytes,”
Biopolymers , 67 259
–262
(2002). Google Scholar
|
||||||||||||||||||||||||||||||||||||||||||||||||||||||||||||


