

|
|
1.IntroductionFor more than two decades, whole-body or localized hyperthermia as a primary or adjunctive treatment for cancer has been investigated.1 2 3 4 5 6 7 Other applications in which localized thermotherapy have been used include treatment of cardiac arrhythmia,8 the release of drugs from thermolabilized carriers,9 10 and treatment of tumors and choroidal neovascularization in the eye by direct, near-IR laser irradiation (800 to 810 nm) through the pupil11 12 13 (transpupillary thermotherapy, or TTT). A potential advantage of laser-induced hyperthermia is that the thermal therapy can be restricted to the targeted tissue (as compared to modalities more difficult to focus, such as ultrasound or radio frequency radiation). For treatment of ocular lesions, such as choroidal neovascularization, precise control over the area of treated tissue is critical, owing to the close apposition of the neurosensory retina and retinal pigment epithelium to the choroid, from which the lesions arise.13 Therefore, the successful application of TTT in the eye, or thermotherapy applied to other small organs, requires accurate measurement and control of temperature throughout the volume of the treated organ or tissue. A noninvasive method of temperature measurement in the irradiated volume is well suited for the clinical setting, as it minimizes stressful interventions to the patient, and reduces the possibility of confounding interactions between the laser radiation and the measurement system, as would be the case if an invasive temperature probe were used within the treatment area. With the goal of performing noninvasive thermography during ophthalmic procedures, we have used magnetic resonance thermography (MRT) to measure laser-induced hyperthermia in a tissue phantom of the same general size as the human eye. Magnetic resonance (MR) thermal imaging depends on several parameters that are known to be temperature dependent. The most important of these for application to thermography are the proton diffusion constant14 15 16 17 18 19 and the proton resonance frequency20 21 22 23 24 25 (PRF) of water molecules contained in the tissue. These methods as well as other techniques for generating temperature-dependent signals detectable by MR have recently been reviewed.26 Of all these methods, temperature measurement based on PRF is probably the most sensitive and has excellent linearity.26 We implemented MRT based on PRF to measure IR-laser-induced temperature changes in an ocular phantom to evaluate the suitability of this technique for clinical applications. This method was shown to be capable of generating 3-D temperature measurements in the phantom, with sufficient spatiotemporal resolution for practical measurements in the animal or human eye. In addition, IR imaging was combined with MRT and found to be useful for studying the propagation of the laser beam through a scattering medium containing an absorptive layer of melanin, analogous to that found in the intact eye. 2.Methods2.1.Ocular PhantomsTwo types of phantoms were used during the course of this research. A uniform ocular phantom was constructed by filling a 22-mm-diam, cylindrical glass cuvette with either clear, 1 agarose (Sigma Chemical Co., St. Louis, Missouri), or 1 agarose containing a uniform suspension of melanosomes isolated from bovine retinal pigment epithelium (RPE), as previously described.27 The agarose was dissolved in distilled water, heated to 60°C, poured into the cuvette, and allowed to gel. The uniform phantoms were used only for calibration of the MRT temperature response, as described in Sec. 2.3. For experiments involving laser radiation, a nonuniform phantom containing a thin layer of melanin was constructed using a 10-cm3 Pyrex glass beaker, also of approximately 22-mm diameter. The melanin layer was formed by mixing a suspension of bovine RPE melanosomes in agarose at a granule density estimated to be similar to that in native RPE, i.e., approximately27 1010 melanin granules/ml. This melanosome-agarose suspension was sandwiched and allowed to gel between two microscope cover slips, forming a layer of 1.5 mm thickness. The sandwich was placed in the middle of the beaker, and clear agarose was poured in around it. 2.2.IR Laser Irradiation of PhantomsThe laser source used in this study was an HPM-F1 laser diode module with a built-in fiber launch that produced 1-W cw maximum output power at 806 nm (Power Technology Corp, Little Rock, Arkansas). The experimental optical and temperature-recording arrangement is shown in Fig. 1. The laser console was situated about 4.5 m away from the center of the MR magnetic field. The laser emission was delivered into the cavity of the MR instrument using a 5-m-long, 600-μm-diam core, multimode optical fiber (Oz Optics, Carp, Ontario, Canada). An in-line, fiber optic variable attenuator (Oz Optics) controlled the laser power delivered to the phantom. Two lenses were used to collimate (L1, 50 mm focal length) and focus (L2, 11 mm focal length) the laser beam on the phantom target inside the MR cavity, as shown in Fig. 1. The lenses and fiber optic were mounted and aligned in a nonmagnetic holder. Separately, the focused laser spot size at the target was imaged with a BeamView Analyzer PC laser beam profiler (Coherent Inc., Instruments Div., Auburn, California) and was found to be an approximately Gaussian beam. In these experiments, two laser beam sizes on the target were used: a small spot with 1/e2 radius of 0.8 mm, and a large spot with 1/e2 radius of 2.4 mm. Figure 1Schematic of the experimental setup. The ocular phantom was placed on a two-turn, 6-cm-diam, circular radio frequency coil, in the 45-cm-diam bore of a 2T MR imager. Three reference phantoms were placed alongside the main phantom. Independent temperature measurements were made with Vitek fiber optic temperature probes. The laser was brought into the MR cavity with an optical fiber, and the 806-nm beam focused into the phantom with lenses L1 and L2. The orientation of the applied magnetic field, B0, is indicated on the diagram. Phase images were obtained using a Tecmag Libra console. 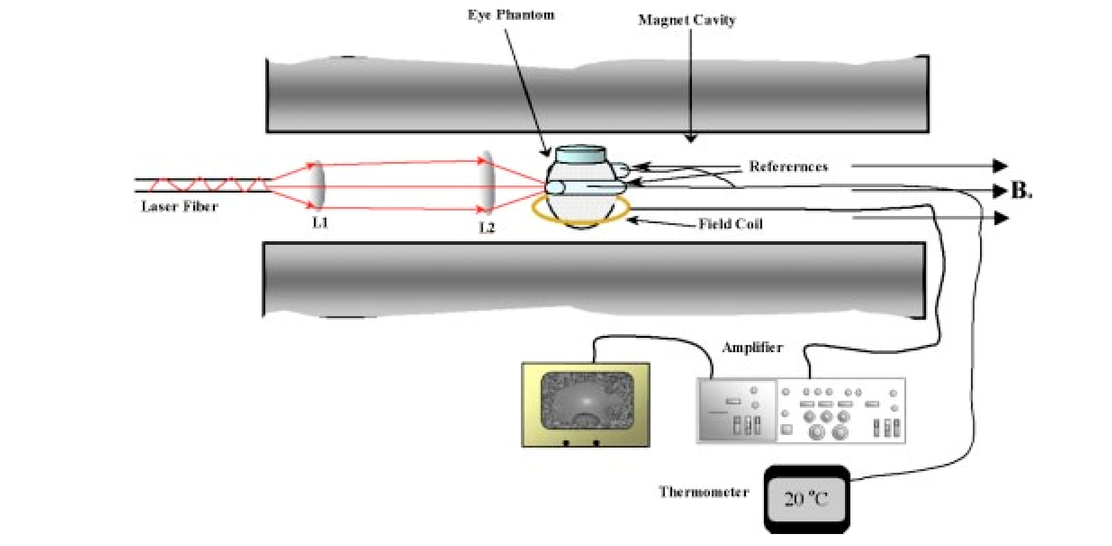 The laser power at the target position was measured with an EPM 1000 energy/power meter equipped with a MP3 thermopile detector head (Molectron, Eugene, Oregon). Depending on the experiment, the target irradiance was varied over the range of 2.4 to 21.6 W/cm2. This was determined by placing the power detector at the position of the phantom and taking into account the small attenuation due to the glass vessel and the agarose. Laser beam alignment was visually checked using a Find-R-Scope IR viewer (FJW Optical Systems, Palatine, Illinois) to ensure that the laser beam was centered in the ocular phantom. 2.3.MR ThermographyAll MRT experiments were performed in the MRI Laboratory of the Research Imaging Center at the University of Texas Health Science Center at San Antonio. Measurements were made using a PRF method similar to that described by Vitkin et al.;24 For MRT methods utilizing PRF, the image phase difference is linearly dependent on the change in temperature as follows: where Δϕ is the phase difference, γ is the gyromagnetic ratio for protons, B0 is the magnetic field strength, α is the thermal coefficient (chemical shift), TE is echo time, and ΔT is change in temperature. A two-turn radio frequency surface coil of 6 cm diameter was used as the transceiver. Images were obtained using an Oxford Magnet Technology 2T, 45-cm-diam bore, superconducting magnet (Oxfordshire, England), equipped with actively shielded Magnex gradients and a Tecmag Libra console (Tecmag, Houston, Texas).To calibrate the MRT measurements in terms of absolute temperature, an experiment was performed with a phantom containing a uniform distribution of melanin granules, constructed as described in Sec. 2.1. The phantom was heated by passing warm water from an external circulating water bath through Tyvek tubing wrapped around the phantom. When thermal equilibrium was reached, the water flow was stopped. MRT was performed by subtracting the phase images of the ocular phantom at two different temperatures, and constructing a phase difference map, from which the temperature difference was calculated using Eq. (1). To correct for phase drifts due to ambient temperature changes unrelated to temperature shifts in the ocular phantom, thermally isolated reference phantoms, consisting of small tubes of agarose, were placed adjacent to the ocular phantom. On the assumption that the phase in the image of the reference phantoms remained constant, the relative temperature change map of the ocular phantom was corrected by comparison to the phase of three points in the image of the reference phantoms (three points enabled an image plane to be defined). The reference phantoms had length, which enabled the correction of 3-D images. Gradient echo images were obtained at various phantom temperatures. From these images, the value of α (the chemical shift) was found to be 0.0102 ppm/°C, consistent with general PRF temperature measurements for biological tissues.26 The signal-to-noise ratio (SNR) for the temperature measurements was calculated as the inverse of the standard deviation of the phase over the region of interest (ROI) in the heated sample. For absolute calibration, the temperatures inside the ocular phantom and in the references were measured independently, with an accuracy of 0.1°C, using Vitek fiber optic temperature probes (Boulder, Colorado) placed in the phantoms. For all laser-induced heating experiments, the layered phantom consisting of a melanin layer embedded in clear agarose was used, as already described. The melanin itself has natural Tl contrast in MRI. The 806-nm light emitted from the diode laser source was not significantly absorbed in the clear agarose, but was almost entirely absorbed and scattered within the melanosome layer [refer to Fig. 3(a) in Sec. 3.2]. This was considered to be a close approximation of the behavior of near-IR light in the vertebrate eye. To obtain a time course of the heating in the phantom, a 2-D, gradient echo imaging sequence was used with repetition time (TR) of 210 ms, echo time (TE) of 12 ms, and the flip angle was 40 deg. Eight slices were acquired with images obtained every 22.9 s. The in-plane resolution was 0.25 mm with a slice thickness of 1.5 mm. Six images were taken before the laser was turned on and these were averaged to provide a phase reference image. Laser-induced heating was applied for 15 to 20 min, and images were taken sequentially throughout the exposure period. A 3-D temperature map was obtained in the melanin-layer phantom, using a 3-D gradient echo imaging sequence providing an image of 0.25×0.25×0.25 mm resolution in each direction. In this gradient sequence, TR=40 ms, TE=12 ms, and the flip angle=20 deg. The total time required for a 3-D scan was 8 min. A 3-D image prior to heating was acquired as the reference image, as well as two 3D images after the laser had been turned on. Acquisition of the first image commenced with the onset of laser exposure (the center of k-space was after 4 min), while the second image was acquired after the completion of the laser exposure (the center of k-space was after 13 min). Three-dimensional scans were acquired during heating of the phantom with the small (0.8 mm radius) as well as the large (2.4 mm radius) laser beam spot sizes. 2.4.Thermal ModelA model for the transient thermal tissue response to continuous diode laser output was used to predict the temperature rise and to compare it with the MRT measured values. The thermal model accounted for the effect of light scattering, which is predominant in the case of melanized tissue. In previous work, the inverse adding doubling (IAD) method28 was used to determine optical properties of RPE melanin. The scattering coefficients were found to be much higher than the absorption coefficients of melanin at visible wavelengths,29 30 and this relationship would be expected to be similar in the near IR, although the relative magnitude of each coefficient would be lower than the corresponding visible wavelength values.30 Moreover, the exact values depend slightly on the concentration of melanin in the phantom. Thus, when compared with visible wavelength lasers, lasers emitting in the near infrared (e.g., 806 nm wavelength) will experience less scattering and correspondingly increased transmission through nontransparent (turbid) media. Some simplifying assumptions were made. The thermal radiation away from the phantom walls was neglected, and material constants were taken to be uniform and time independent. The optical properties of the material were also considered to remain constant during temperature elevation. If the incident intensity, I0(r) (in watts per centimeter squared) of a cylindrical, symmetric laser beam penetrates the surface, then the intensity of the direct beam IB is where and μ is the extinction coefficient, μa is the (direct) absorption coefficient of radiation, and μs is scattering coefficient (redistribution) of radiation out of the beam. However, the intensity of scattering radiation at (r,z) is the sum of direct intensity as result of depolarization and other randomizing effects, and can be written as for cylindrical symmetry:31 32 where l is the distance between points [i.e., intensity of radiation arriving at (r′,θ′,z′), to which light has been scattered from (r,0,z) with coefficient μs in cylindrical coordinates].The temperature response of tissue to a laser radiation source S is governed by the following heat equation33: where T is temperature, ρ is density (in kilograms per cubic meter), c is the specific heat (J/kg K) of the substance, and K is the thermal conductivity (W/m K). The source function can be expressed as This enters the heat equation linearly as a driving function. The laser beam profile is considered as a Gaussian profile with laser beam waist r0: This distribution corresponds to total input power: An analytical solution of the heat differential equation by using the Eigenfunction with the relation between IS and IB has been discussed in detail.31 In the current application, these problems were solved numerically by using Mathcad (Mathsoft Engineering, Cambridge, Massachusetts); the results of the computation were displayed graphically, as will be shown in the following.2.5.Image AnalysisPhase maps were reconstructed from adjusted phase drifts using IDL (Interactive Data Language from Research Systems, Inc., Boulder, Colorado), using the three-point phase correction method described in Sec. 2.3, and by previous authors.25 34 Temperature maps were then calculated using Eq. (1). 2.6.Statistical AnalysisThe agreement between the temperature measurements obtained by MRT and the heating of the phantom predicted by the heat diffusion model was assessed by performing a χ2 statistical test on the difference between the two. The χ2 tests the hypothesis that there is not a significant difference between the observed and predicted values. Statistical tests were performed with the ProStat statistical software package (Poly Software International, Pearl River, New York). 2.7.IR ImagingIR photography was performed using a Sony F717 digital camera set to its “nightshooting” operational mode, i.e., with the CCD imager set to record only near-IR light. Images were taken of the phantom during 806-nm laser irradiation and then transferred to a personal computer for processing and display. 3.Results3.1.Measurement of Heating Time CourseTemperature profiles within the layered phantom during continuous application of the 806-nm diode laser were measured using MRT, and compared to the theoretical values predicted from the heat diffusion model. The optical properties assigned to the melanin layer phantom were as follows: (scattering coefficient) μs≈11.4 cm −1, and (absorption coefficient) μa≈0.55 cm −1. The thermal constants were taken as ρc=4.4 J/cm 3°C (i.e. as for water), and K=7×10⁻³ W/cm°C and were assumed to be uniform throughout the phantom. During steady exposure, the time course of heating was obtained by serial MRT measurements as described in Sec. 2.3. The layered phantom reached 75 thermal equilibrium after a laser exposure of 25 to 30 s, as shown in Fig. 2, with a target irradiance of 21.6 W/cm2 at the center of the phantom, and the 0.8-mm-radius (1/e2) laser beam. The experimental example shows that the steady state temperature reached within 60 s was 30°C above the initial baseline, which is very high relative to the temperature achieved in typical hyperthermia treatment. Also shown in Fig. 2 is an estimate of the error in the 2-D MRT measurements. Prior to the start of laser heating, the standard deviation of the phase in six consecutive 2-D images was 0.047 rad, corresponding to 0.72°C. This implied that the temperature resolution in the unheated sample was better than 1°. During laser heating, however, the SNR declined, and the standard deviation of the phase increased, leading to an estimate of measurement error of 1.4°C. This is indicated by the error bars in Fig. 2 for the time points starting at 75 s after the onset of laser exposure, i.e. for MRT measurements made during steady state heating. Figure 2Heating time course in the layered phantom during cw IR laser exposure, as determined by MRT. The solid line shows the temperature change at the hottest point in the phantom, within the melanin layer, measured by MRT in sequential images during laser irradiation; the dotted line shows the heating time course predicted by the heat diffusion model; and the error bars on the MRT measurements show the standard deviation of the phase measurements, converted to temperatures. Laser heating was applied for 15 min; the temperature measured in the phantom during the first 400 s of the experiment is shown in this figure. The ordinate shows the temperature increase in the melanin layer of the phantom during laser irradiation. Taking into account minor scattering and absorption of the 806 nm laser in the clear agarose of the phantom, the target irradiance was calculated as 21.6 W/cm2 at the melanin layer of the phantom, where the laser beam radius (1/e2) was 0.8 mm.  The agreement of the observed heating time course with the rate predicted from the thermal model was very good, as shown in Fig. 2. A χ2 statistical test of the agreement between predicted and observed heating time courses returned a value for χ2 of 2.00, well within the critical value of 8.67 for 95 confidence (17 deg of freedom) that the observed values were well correlated with the predicted values. 3.2.Spatial and Thermal Resolution of 2-D MRTThe spatial resolution of the MRT method was assessed by measuring 2-D temperature gradients in the layered phantom during infrared laser exposure. A difference in the spatial temperature gradients due to the nonhomogeneity of the melanin layer in the phantom was readily apparent. The optical propagation of the laser beam through the phantom was revealed by IR imaging. The beam propagated with a small amount of scattering and very little absorption through the clear agarose gel, but was highly scattered and absorbed in the melanin layer [Fig. 3(a)]. A corresponding MR magnitude image of the phantom is shown for comparison in Fig. 3(b). Because of its paramagnetic moment,35 the melanin layer has higher T1 contrast than the surrounding agarose. Temperature gradients were measured in the layered phantom using MRT during laser exposures delivering sufficient power into the phantom to produce heating (Fig. 4). A thermographic image was constructed by obtaining the phase difference between a magnetic resonance image taken prior to the onset of the laser, and one taken during the laser exposure. The thermographic (phase difference) image is shown in Fig. 4(a). The spatial resolution of the MRT images was determined by the number of image voxels within the physical field of view. The in-plane resolution of the 2-D MR images was 0.25 mm. The MRT spatial resolution was sufficient to distinguish between temperature gradients measured within the plane of the melanin layer, and those orthogonal to the layer, as shown in Fig. 4(b). The gradient within the melanin layer is wider compared to the orthogonal profile. That difference can be explained by the low optical absorption of the laser beam within the clear agarose, in contrast to the high optical absorption—and hence, heating—of the laser beam in the melanin layer. Figure 3(a) IR image taken of the 806-nm laser beam propagating through the layered phantom. The IR image was taken with a Sony F717 camera in “night shooting” mode (near-IR imaging mode) of a laboratory setup outside the MR cavity. During the actual experiment the laser beam incidence was normal to the melanin layer. (b) MR magnitude image of the layered phantom. The melanin layer appears brighter than the surrounding clear agarose because of the inherent T1 contrast of melanin. 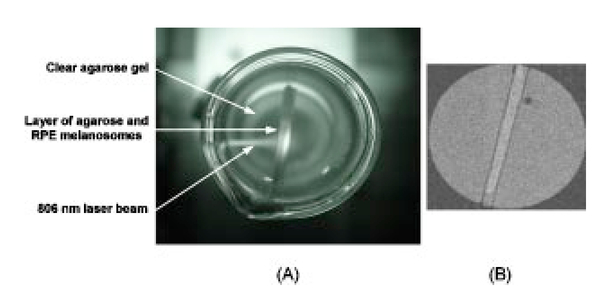 Figure 4Orthogonal temperature profiles in the layered phantom during laser exposure. (a) The phase image of the phantom during laser-induced heating; the dark band near the top of the image is an artifact in the phase unwrapping algorithm. The white lines in the figure indicate the relative orientations of the temperature gradients with respect to the melanin layer in the phantom. (b) Graph of the temperature gradients in the phantom as a function of displacement from the focal point of the laser beam in the melanin layer. The filled symbols represent MRT measurements in a slice extending through the hottest point in the phantom, i.e., within the plane of the melanin layer through the laser focal point; while open symbols represent MRT measurements in a slice running through the laser focal point, in a plane perpendicular to the melanin layer. Both image slices extended across the entire width of the phantom. Smooth lines through both data sets are best-fit Gaussian functions. The temperature gradient within the melanin layer is broader than the gradient across the layer extending into the clear agarose on each side of the layer, due to the greater scattering and absorption of the laser energy in the melanin granules.  The theoretical temperature resolution of MRT based on the PRF method may approach26 0.1°C. By using an external water bath to heat the phantom uniformly to a known temperature, the MRT measurements were calibrated so that an absolute temperature could be derived from the temperature-dependent phase changes in the image. In addition, by comparing the agreement of MRT of the water-bath heated phantom, determined from 2-D images, with temperature measurements made with a Vitek probe, an estimate of the accuracy of the method was attained, and was found to be within 0.5°C, at least for temperature excursions less than 10°C. 3.3.3-D Temperature ProfilesOnce at the thermal equilibrium, volume image scans were made to construct a 3-D thermographic image of steady-state heat flow through the phantom, starting from the focal point of the laser beam where it interacted with the melanin layer. The spatial resolution of the 3-D images was 0.25 mm in all three axes. The data sets shown in Fig. 5 illustrate the temperature topography inside the volume of the phantom. We can appreciate that the temperature gradients follow a Gaussian profile due to the Gaussian distribution of power in the laser beam. The diameter of the laser beam irradiating the phantom also affected the shape of the 3-D heating profile. The 3-D thermogram resulting from exposure to the 0.8-mm-radius laser beam [shown in Fig. 5(a)] is narrower than the thermogram produced by the 2.4-mm-radius beam [shown in Fig. 5(b)]. The SNR for the 3-D magnitude image was 11.5 (calculated as the inverse of the standard deviation of the phase over the ROI). To obtain an estimate of the error in the temperature measurements, the squares of the errors across the image ROI were added, and the square root was taken. Converting back to temperature, the derived estimate of error in the 3-D data set was ±1.9°. Figure 5Surface plots taken from 3-D temperature maps of the layered phantom during steady-state laser exposure: thermograms resulting from exposure of the phantom to (a) the 0.8-mm-radius laser beam and (b) the 2.4-mm-radius laser beam. The inset at the upper right-hand corner of each graph shows the phase difference image (thermogram) of the melanin layer (the image slice was taken within the plane of the melanin layer). The thermograms illustrate the temperature gradients spreading out into the phantom, away from the center of the laser beam impacting the melanin layer. The view of the surface plot is approximately 90 deg to the axis of the incident laser beam.  3.4.Correlation of Thermal Model and MRT MeasurementsTo compare a temperature profile measured by MRT during laser exposure with the heating gradient predicted by the heat diffusion model described in Sec. 2.4, a 2-D image slice was taken out of the three-dimensional data set shown in Fig. 5(a) (Sec. 3.3). The temperature profile obtained from this image slice is shown in Fig. 6 as the discrete points, while the continuous line in Fig. 6 shows the temperatures predicted by Eq. (5). The error bars shown in Fig. 6 represent the error estimates derived from the 3-D data sets as described in Sec. 3.3. The phantom heating was produced by continuous wave laser exposure of 21.6-W/cm2, 0.8-mm-beam radius (1/e2) and 700 s duration. The maximum temperature rise at the center of the phantom was about 32°C, which was extreme for hyperthermia treatment but a good test of the ability of MRT to record a large temperature excursion with high resolution. The agreement in Fig. 6 between the theoretical and experimental values is quite close. A χ2 analysis revealed that χ2=9.82, which is well below the limiting value of 16.15 for 95 confidence (27 deg of freedom). This result indicates that the observed values were well correlated with the predicted values, and that the heat diffusion model is an excellent predictor of heat transfer throughout the phantom during laser exposure. Figure 6Comparison of the heat diffusion model computational results and the MRT measured temperature profile within the layered ocular phantom. The filled, discrete symbols represent the MRT measurements taken from a central image slice of the 3-D data set shown in Fig. 5(a). The continuous line represents the temperature rise in the phantom predicted by the thermal model as a function of distance from the center of the laser beam incident on the melanin layer. Error bars on the discrete points are estimates of temperature measurement standard deviation, calculated as described in Sec. 2.3.  4.Discussion4.1.Practical Spatial, Temperature, and Temporal Resolution of MRTThe accuracy of the temperature calculations made with MRT depend on several factors, the most important of which is the determination of the temperature coefficient α. In this application, for elevations of less than 10°C produced by passive heating of the uniform phantom with the water bath, the temperature values determined by MRT were compared to measurements made with a Vitek fiber optic probe having an accuracy of 0.1°C, and usually agreed to within 0.5°C. The temperature resolution, however, may depend on the magnitude of the temperature excursion. For example, during the more extreme heating produced by the laser exposure, the SNR of the temperature measurements decreased, and for temperature changes of more than 20°C, the resolution decreased in 2-D MRT to about 1.4°C, and to 1.9°C for the 3-D MRT. This implies that the practical temperature resolution of the MRT method decreases with an increase in the relative temperature change in the target, although the resolution is probably better than 1°C for clinically relevant temperature excursions. Another potential source of error is due to an interaction between the size and orientation of the heat source with the external magnetic field. Peters et al.; demonstrated that, with an interstitial laser fiber having a 1-cm-long quartz diffuser, there was an orientation-dependent effect on the measured temperature that was ascribed to a change in the volume-magnetic susceptibility of the tissue along the axis of the fiber diffuser.22 36 37 With a laser beam applied externally, as in our case, this orientation artifact would be expected to be minor, because the effective heat source in the phantom, i.e., the image of the laser beam, is thin compared to the optical zone absorbing the laser energy, i.e., the melanin layer. In a more complicated target such as the eye (in which the RPE layer containing melanin is very thin), a correction for orientation dependence may have to be introduced. This will be examined in future work. In terms of spatial resolution, an effective resolution of 0.25 mm was obtained. Given38 the average thickness of the human retina (350–500 μm), the RPE (20 μm), and the choroid (100 to 200 μm), the 0.25-mm spatial resolution in our MRT implementation is sufficient to provide two or three temperature measurement points through the combined thickness of the retina and choroid layers, although it is insufficient to distinguish retinal and RPE temperature. Nevertheless, the currently achievable resolution supports the application of MRT to monitor the heating of the target vascular membrane, as well as surrounding retina and RPE, during treatment of choroidal neovascularization11 12 13 by TTT. A current limitation of TTT is that the target temperature required for the optimal therapeutic effect has not been established. Use of MRT for feedback control during TTT could provide critical temperature information to correlate with the resulting tissue responses to the treatment. 4.2.Technical Limitations and Improvements in the MethodThe temperature and spatial resolution of our system appear to be adequate for application to the human eye. The temporal resolution, however, could be improved. There is a trade-off between temporal, spatial, and temperature resolution. Increasing the resolution of one inevitably reduces the resolution of one or both of the remaining parameters; therefore, the experiment must be designed to maximize the most important parameter. For example, in a study of experimental interstitial laser hyperthermia therapy to the prostate, a single image slice was acquired in 6.7 s, but with a slice thickness39 of 5 mm. Certainly, a faster image acquisition rate would be very useful in improving the accuracy of heating time course measurements in the target tissue. It is likely that advances in MR instrumentation will improve overall imaging performance. 4.3.Application of MRT to Characterizing the Interaction of IR Laser with Ocular Tissue ComponentsThe MR measurements in the ocular phantom provided a means for directly studying the factors governing the temperature distribution during IR laser exposure. The physical distribution of the melanin pigment granules, the concentration (or density) of melanosomes in the tissue, and the thickness of the pigmented tissue layer all determined the effective optical zone in which laser-tissue interaction occurred. There were limitations in the ability of the phantom to simulate thermal interactions in the living eye. Practical considerations in the construction of the layered phantom limited its ability to simulate the eye morphology more accurately. For example, the laser-induced heating time course measured in these experiments was considerably slower than the thermal behavior predicted for retina and RPE during laser irradiation.40 41 The slower temporal thermal response of the phantom was likely due to the much greater thickness of its melanin layer compared to the melanin-containing RPE of the physiological eye. Considering that the heat diffusion process will be complicated for a blood-perfused, inhomogeneous organ such as the human eye, MRT provides a noninvasive means for determining in vivo the heating time course as well as the equilibrium temperature, both essential for understanding the biological response of the tissue to thermal stress. The interaction of the 806-nm cw diode laser with melanin is dominated by thermal effects, and depends primarily on photon scattering. An accurate determination of the optical properties is critical for theoretical prediction of temperature rises in irradiated tissues. For example, the relatively high absorption coefficient of melanin produced a high temperature rise in the small volume of the melanin layer, which caused heat to diffuse throughout the phantom. This effect is illustrated in Fig. 4, which shows that the laser radiation was mostly absorbed within the melanin layer, and that heating profiles through the phantom depended on the particular geometry of the absorbing layer in the phantom. Selection of suitable laser parameters for hyperthermia therapy, therefore, will depend on the ability to predict accurately the interaction of the laser beam with the tissue and the resultant heat flows through the treated and adjacent nontreated tissue. Such predictions will require the use of a validated treatment model. The good agreement of the MRT measurements with the predictions of a classical heat diffusion model show that an important use of the method will be to validate theoretical thermal models. The practical effect of this ability is to enable a thermal model to be applied in the clinic to plan therapy and optimize the laser parameters for laser hyperthermia treatment protocols. AcknowledgmentsThis research was supported by the San Antonio Area Foundation, the U.S. Air Force Office of Scientific Research Grant No. F49620-01-1-0211, and by an unrestricted grant from Research to Prevent Blindness, Inc., to the Department of Ophthalmology at the University of Texas Health Science Center. REFERENCES
W. R. Chen
,
H. Liu
,
R. Carubelli
, and
R. E. Nordquist
,
“Synergistic effect of photothermal and photoimmunological reactions in treatment of metastatic tumors,”
J. X-Ray Sci. Technol. , 10 225
–235
(2002). Google Scholar
K. Engin
,
L. Tupchong
,
D. J. Moylan
,
G. A. Alexander
,
F. M. Waterman
,
L. Komarnicky
,
R. E. Nerlinger
, and
D. B. Leeper
,
“Randomized trial of one versus two adjuvant hyperthermia treatments per week in patients with superficial tumours,”
Int. J. Hyperthermia , 9
(3), 327
–340
(1993). Google Scholar
M. W. Dewhirst
,
“Future directions in hyperthermia biology,”
Int. J. Hyperthermia , 10
(3), 339
–345
(1994). Google Scholar
R. L. Page
,
D. E. Thrall
,
M. W. Dewhirst
, and
R. E. Meyer
,
“Whole-body hyperthermia. Rationale and potential use for cancer treatment,”
J. Vet. Intern. Med. , 1
(3), 110
–120
(1987). Google Scholar
M. W. Dewhirst
,
D. A. Sim
,
K. Forsyth
,
K. J. Grochowski
,
S. Wilson
, and
E. Bicknell
,
“Local control and distant metastases in primary canine malignant melanomas treated with hyperthermia and/or radiotherapy,”
Int. J. Hyperthermia , 1
(3), 219
–234
(1985). Google Scholar
F. K. Wacker
,
K. Reither
,
J. P. Ritz
,
A. Roggan
,
C.-T. Germer
, and
K. J. Wolf
,
“MR-guided interstitial laser-induced thermotherapy of hepatic metastasis combined with arterial blood flow reduction: technique and first clinical results in an open MR system,”
J. Magn. Reson. Imaging , 13
(1), 31
–36
(2001). Google Scholar
S. Levy
,
“Biophysical basis and cardiac lesions caused by different techniques of cardiac arrhythmia ablation,”
Arch. Malad. Coeur Vaiss. , 88
(10), 1465
–1469
(1995). Google Scholar
S. Kim
,
“Liposomes as carriers of cancer chemotherapy. Current status and future prospects,”
Drugs , 46
(4), 618
–638
(1993). Google Scholar
J. N. Weinstein
,
R. L. Magin
,
M. B. Yatvin
, and
D. S. Zaharko
,
“Liposomes and local hyperthermia: selective delivery of methotrexate to heated tumors,”
Science , 204
(4389), 188
–191
(1979). Google Scholar
M. A. Mainster
and
E. Reichel
,
“Transpupillary thermotherapy for age-related macular degeneration: long-pulse photocoagulation, apoptosis, and heat shock proteins,”
Ophthalmic Surg. Lasers , 31
(5), 359
–373
(2000). Google Scholar
M. Ip
,
A. Kroll
, and
E. Reichel
,
“Transpupillary thermotherapy,”
Semin. Ophthalmol. , 14
(1), 11
–18
(1999). Google Scholar
E. Reichel
,
A. M. Berrocal
,
M. Ip
,
A. J. Kroll
,
V. Desai
,
J. S. Duker
, and
C. A. Puliafito
,
“Transpupillary thermotherapy of occult subfoveal choroidal neovascularization in patients with age-related macular degeneration,”
Ophthalmology , 106
(10), 1908
–1914
(1999). Google Scholar
J. MacFall
,
D. M. Prescott
,
E. Fullar
, and
T. V. Samulski
,
“Temperature dependence of canine brain tissue diffusion coefficient measured in vivo with magnetic resonance echo-planar imaging,”
Int. J. Hyperthermia , 11
(1), 73
–86
(1995). Google Scholar
Y. Zhang
,
T. V. Samulski
,
W. T. Joines
,
J. Mattiello
,
R. L. Levin
, and
D. LeBihan
,
“On the accuracy of noninvasive thermometry using molecular diffusion magnetic resonance imaging,”
Int. J. Hyperthermia , 8
(2), 263
–274
(1992). Google Scholar
D. Le Bihan
,
J. Delannoy
, and
R. L. Levin
,
“Temperature mapping with MR imaging of molecular diffusion: application to hyperthermia,”
Radiology , 171
(3), 853
–857
(1989). Google Scholar
S. J. Graham
,
G. J. Stanisz
,
A. Kecojevic
,
M. J. Bronskill
, and
R. M. Henkelman
,
“Analysis of changes in MR properties of tissues after heat treatment,”
Magn. Reson. Med. , 42
(6), 1061
–1071
(1999). Google Scholar
A. S. Hall
,
M. V. Prior
,
J. W. Hand
,
I. R. Young
, and
R. J. Dickinson
,
“Observation by MR imaging of in vivo temperature changes induced by radio frequency hyperthermia,”
J. Comput. Assist. Tomogr. , 14
(3), 430
–436
(1990). Google Scholar
A. R. Bleier
,
F. A. Jolesz
,
M. S. Cohen
,
R. M. Weisskoff
,
J. J. Dalcanton
,
N. Higuchi
,
D. A. Feinberg
,
B. R. Rosen
,
R. C. McKinstry
, and
S. G. Hushek
,
“Real-time magnetic resonance imaging of laser heat deposition in tissue,”
Magn. Reson. Med. , 21
(1), 132
–137
(1991). Google Scholar
J. A. de Zwart
,
P. van Gelderen
,
D. J. Kelly
, and
C. T. Moonen
,
“Fast magnetic-resonance temperature imaging,”
J. Magn. Reso. Ser. B , 112
(1), 86
–90
(1996). Google Scholar
Y. C. Chung
,
J. L. Duerk
,
A. Shankaranarayanan
,
M. Hampke
,
E. M. Merkle
, and
J. S. Lewin
,
“Temperature measurement using echo-shifted FLASH at low field for interventional MRI,”
J. Magn. Reson. Imaging , 9
(1), 138
–145
(1999). Google Scholar
R. D. Peters
and
R. M. Henkelman
,
“Proton-resonance frequency shift MR thermometry is affected by changes in the electrical conductivity of tissue,”
Magn. Reson. Med. , 43
(1), 62
–71
(2000). Google Scholar
J. A. Moriarty
,
J. C. Chen
,
C. M. Purcell
,
L. C. Ang
,
R. S. Hinks
,
R. D. Peters
,
R. M. Henkelman
,
D. B. Plewes
,
M. J. Bronskill
, and
W. Kucharczyk
,
“MRI monitoring of interstitial microwave-induced heating and thermal lesions in rabbit brain in vivo,”
J. Magn. Reson. Imaging , 8
(1), 128
–135
(1998). Google Scholar
I. A. Vitkin
,
J. A. Moriarty
,
R. D. Peters
,
M. C. Kolios
,
A. S. Gladman
,
J. C. Chen
,
R. S. Hinks
,
J. W. Hunt
,
B. C. Wilson
,
A. C. Easty
,
M. J. Bronskill
,
W. Kucharczyk
,
M. D. Sherar
, and
R. M. Henkelman
,
“Magnetic resonance imaging of temperature changes during interstitial microwave heating: a phantom study,”
Med. Phys. , 24
(2), 269
–277
(1997). Google Scholar
J. De Poorter
,
C. De Wagter
,
Y. De Deene
,
C. Thomsen
,
F. Stahlberg
, and
E. Achten
,
“Noninvasive MRI thermometry with the proton resonance frequency (PRF) method: in vivo results in human muscle,”
Magn. Reson. Med. , 33
(1), 74
–81
(1995). Google Scholar
B. Quesson
,
J. A. de Zwart
, and
C. T. Moonen
,
“Magnetic resonance temperature imaging for guidance of thermotherapy,”
J. Magn. Reson. Imaging , 12
(4), 525
–533
(2000). Google Scholar
A. E. Dontsov
,
R. D. Glickman
, and
M. A. Ostrovsky
,
“Retinal pigment epithelium pigment granules stimulate the photo-oxidation of unsaturated fatty acids,”
Free Radic Biol. Med. , 26
(11–12), 1436
–1446
(1999). Google Scholar
S. A. Prahl
,
M. J. C. van Gemert
, and
A. J. Welch
,
“Determining the optical properties of turbid media by using the inverse adding-doubling method,”
Appl. Opt. , 32 559
–568
(1993). Google Scholar
D. K. Sardar
,
M. L. Mayo
, and
R. D. Glickman
,
“Optical characterization of melanin,”
J. Biomed. Opt. , 6
(4), 404
–411
(2001). Google Scholar
S. L. Jacques
,
R. D. Glickman
, and
J. A. Schwartz
,
“Internal absorption coefficient and threshold for pulsed laser disruption of melanosomes isolated from retinal pigment epithelium,” in Laser-Tissue Interaction VII, S. L. Jacques, Ed.,”
Proc. SPIE , 2681 468
–477
(1996). Google Scholar
T. Halldorsson
and
J. Langerholc
,
“Thermodynamic analysis of laser irradiation of biological tissue,”
Appl. Opt. , 17 3948
–3958
(1978). Google Scholar
R. D. Peters
,
R. S. Hinks
, and
R. M. Henkelman
,
“Ex vivo tissue-type independence in proton-resonance frequency shift MR thermometry,”
Magn. Reson. Med. , 40
(3), 454
–459
(1998). Google Scholar
J. F. Norfray
,
W. G. Klinger
,
I. A. Menon
,
S. Persad
,
P. A. Berger
, and
M. Ainscough
,
“A paramagnetic agent causing ochronotic arthropathy,”
Invest. Radiol. , 23
(8), 609
–615
(1988). Google Scholar
R. D. Peters
,
R. S. Hinks
, and
R. M. Henkelman
,
“Heat-source orientation and geometry dependence in proton-resonance frequency shift magnetic resonance thermometry,”
Magn. Reson. Med. , 41
(5), 909
–918
(1999). Google Scholar
J. C. Chen
,
J. A. Moriarty
,
J. A. Derbyshire
,
R. D. Peters
,
J. Trachtenberg
,
S. D. Bell
,
J. Doyle
,
R. Arrelano
,
G. A. Wright
,
R. M. Henkelman
,
R. S. Hinks
,
S. Y. Lok
,
A. Toi
, and
W. Kucharczyk
,
“Prostate cancer: MR imaging and thermometry during microwave thermal ablation-initial experience,”
Radiology , 214
(1), 290
–297
(2000). Google Scholar
R. D. Peters
,
E. Chan
,
J. Trachtenberg
,
S. Jothy
,
L. Kapusta
,
W. Kucharczyk
, and
R. M. Henkelman
,
“Magnetic resonance thermometry for predicting thermal damage: an application of interstitial laser coagulation in an in vivo canine prostate model,”
Magn. Reson. Med. , 44
(6), 873
–883
(2000). Google Scholar
T. J. White
,
M. A. Mainster
,
J. H. Tips
, and
P. W. Wilson
,
“Chorioretinal thermal behavior,”
Bull. Math. Biophys. , 32
(3), 315
–322
(1970). Google Scholar
C. R. Thompson
,
B. S. Gerstman
,
S. L. Jacques
, and
M. E. Rogers
,
“Melanin granule model for laser-induced thermal damage in the retina,”
Bull. Math. Biol. , 58 513
–553
(1996). Google Scholar
|


