|
|
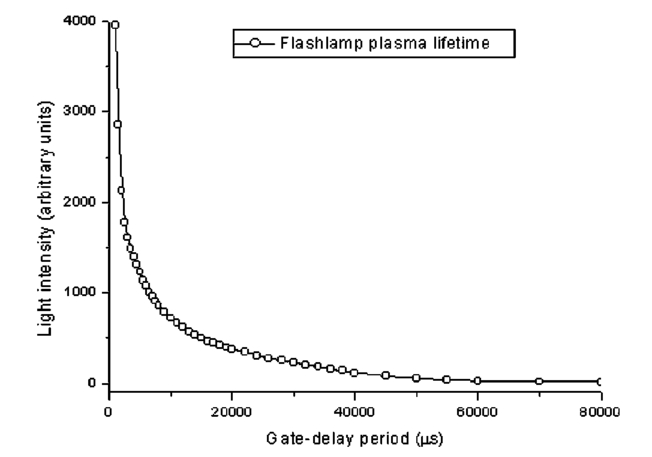
1.IntroductionAnimal, plant, and microbial cells contain significant amounts of aromatic compounds, many of which are fluorescent. The range of fluorescent substances of biological origin described in the biochemical literature is large and includes chlorophyl, hemoglobin, and protein. When these autofluorescing materials have high quantum yields (typically>0.02), they can present a problem of spurious fluorescence against which the fluorescent labels of interest must be detected. As well as autofluorophores, commonly used sample preparation steps may increase levels of unwanted fluorescence. For example, tissue sections fixed with formalin and embedded in paraffin have been reported to be highly autofluorescent.1 The use of fluorescence-based techniques for the analysis of environmental samples (e.g., water concentrates) can be problematic owing to the presence of brightly fluorescing mineral particles, plant debris, algae, and other autofluorescent organisms. The analysis of water concentrates for Cryptosporidium and Giardia relies on immunofluorescent labeling of environmental pathogens followed by enumeration using fluorescence microscopy. The subsequent examination of the concentrate requires a highly skilled microscopist to identify fluorescently labeled pathogens and is often difficult and tedious, owing to a high autofluorescent background.2 3 Most fluorophores, natural and synthetic, have very short fluorescent lifetimes, ranging from 1 to 100 ns.4 The short lifetime of autofluorophores provides the key to an effective method of suppressing autofluorescence using time-resolved (TR) fluorescence techniques. Time-resolved-techniques rely on the use of a highly fluorescent and long-lived fluorophore that can be obtained by coupling a suitable aromatic antenna sensitizer with a chelate moiety to bind a lanthanide ion. The antenna sensitizer must tightly couple to the lanthanide ion (usually Eu 3+ or Tb 3+) to ensure a fast energy transfer process, and the triplet state should be higher in energy than the receiving lanthanide 4f state.5 The forbidden f-f electronic transitions of lanthanides are responsible for the long-lived (∼millisecond lifetime) luminescence and sharp absorption and emission lines that characterize lanthanide fluorescence. The forbidden nature of the f-f transitions is also reflected in low extinction coefficients for the unchelated ion, making direct photoexcitation of lanthanide ions difficult.6 Indirect excitation of the lanthanide ion via the triplet state of the antenna sensitizer, however, can be highly efficient, with quantum yields close to unity.7 Synthetic lanthanide chelates typically have a 10,000-fold longer fluorescence lifetime than autofluorophores, and this feature simplifies the task of suppressing autofluorescence using a time-resolved fluorescence microscope (TRFM). The principle underlying TRFM is illustrated in Fig. 1 with time on the x -axis and light intensity on the y -axis. A TRFM cycle begins with a short pulse of light, idealized here as a square wave, that excites fluorescence from the probe fluorophore and autofluorophore alike. When the excitation source is extinguished, autofluorescence decays within nanoseconds, as shown in the expanded view; however, the fluorescence arising from the lanthanide chelate persists for hundreds of microseconds longer. The time-resolving phase corresponds to the gate-delay period that occurs between the end of the excitation pulse and start of the signal acquisition period. The length of the signal acquisition period depends on the fluorescence lifetime of the chelate, and this varies within different solvent environments. The minimum gate-delay duration, for most TRFM instruments, is controlled by the decay rate of the excitation light pulse. Figure 1TRFM suppresses autofluorescence by delaying signal acquisition until prompt (autofluorescence) has faded. Lanthanide chelate fluorescence persists for more than 300 μs and can be captured free of background.22  Early TRFM instruments were based on commercial epifluorescence microscopes converted for time-resolved applications through the addition of synchronized mechanical shutters.8 Hybrid TRFM systems that used mechanical shutters to pulse the light source and electronic means to synchronize capture of the emission have also been employed.9 Mechanical choppers must run at high speeds for the time regimes used in TRFM and careful design is required to avoid vibration that can degrade image quality at high optical magnification. Electrically pulsed excitation sources and gated image intensifiers avoid the problems associated with mechanical systems and can be synchronized with far greater precision.10 Nitrogen lasers have been used as excitation sources for europium or terbium chelates since the output wavelength of 337 nm is suitable and pulse duration is 2 to 5 ns.11 However, these sources are bulky and expensive compared with flash lamps, and pulse repetition rates are generally lower. Acousto-optic modulators have been employed to produce pulsed excitation sources from lasers (488 nm) for TRFM, but have not been applied for the shorter wavelengths (330 nm) required for lanthanide chelates.12 Flash lamps provide a low-cost pulse source with high UV peak power; furthermore they are compact and easily synchronized with other instruments.13 Their major limitation is the long trailing edge of the excitation pulse that degrades the signal-to-noise ratio (S/R) by forcing extension of the gate-delay period. The use of a highly fluorescent probe with a fluorescence lifetime considerably in excess of the flash lamp decay lifetime can overcome this limitation by extending the signal acquisition period. We synthesized the europium chelate 4,4′-bis-(1″,1″,1″,2″,2″,3″,3″-heptafluoro-4″,6″-hexanedion- 6″-yl)chlorosulfo-o-terphenyl (BHHCT) using the published method.14 In this paper we describe modifications made to a commercial epifluorescence microscope that render the instrument suitable for use as a TRFM. The addition of a high-speed flash lamp and an image-intensified CCD enables the TRFM to suppress autofluorescence to within 1 of the background noise floor and significantly improve S/N ratios. 2.Method2.1.InstrumentationFigure 2 illustrates the connections between the three core components of a TRFM workstation; the epifluorescence microscope, a high-speed flash lamp and a gated image-intensified CCD camera. Time-resolved fluorescence images were captured using the DiCam-Pro (PCO Computer Optics, Kelheim, Germany). Integrated with the camera was a 25-mm Hamamatsu microchannel plate (MCP) image intensifier (12-μm channels) with shutter speeds down to 3 nanoseconds. Resolution of the Peltier-cooled CCD element was 1280×1024 (SVGA) at 12 bits (4096 counts). The sensitivity of the camera depends on a number of variables; with light of 500-nm wavelength, the S20 photocathode has a (practical) 20 quantum efficiency and the MCP an efficiency of about 50, with a multiplication factor of 10,000 times. Phosphor efficiency was approximately 30; the transmission efficiency of the lens-coupling intensifier CCD was 22; and the quantum efficiency of the CCD was 52 at the phosphor’s emission wavelength. The conversion efficiency of the camera was 5 electrons.count −1 and assuming 100 photons hit the photocathode, an output of 686 counts will be generated (or 1 photon generates 7 counts) (T Sorcan, PCO Computer Optics Gmbh, Kelheim, Germany, pers. comm.). A trigger input to the camera permits synchronization of the flash lamp discharge (via the flash lamp controller) and the camera shutter. The camera was packaged with image-processing software and drivers for the capture card. Custom software was written to enable computer control of the flash lamp and to support a wider variety of image formats. Figure 2Schematic of the instrumentation used to convert a standard epifluorescence microscope to a time-resolved fluorescence microscope workstation. An optical fiber is used to connect the high-speed image-intensified camera to the capture card in the host PC (IBM PS/2). A serial data link (9600 baud) connects the host PC to the embedded microcontroller for initiating the flash sequence.22  2.2.Frame Grabber Bit TranslationAlthough the bit resolution of the DicamPro camera was 12 bits (4096 gray scales), the resolution was reduced to 8 bits (256 gray scales) for compatibility with standard bitmap image formats. This step was justified since pixel amplitude variation with intensifier gain settings of 60 and above effectively removed the extra 4 bits of resolution offered in 12-bit mode. The bit transfer algorithm supported both linear and log translation modes and was accessed through a software dialogue in the DicamPro library (dll). For this study, the linear transfer algorithm mapped 12 bits directly to 8 bits by ignoring the lower 4 bits. 2.3.Flash Lamp ControllerA xenon flash lamp with a discharge duration of 1.6 μs full-width half-maximum (FWHM), a flash energy of 160 mJ, and a maximum repetition rate (at the rated power) of 100 Hz was used. The model 68825 flash lamp controller was manufactured by Oriel Inc. and powered an Oriel 6426 guided-arc xenon flash lamp. A trigger input simplifies computer control of the flash lamp and was provided by a solid-state optical relay switched by an embedded microcontroller. The microcontroller was connected to the host computer via a serial interface and was controlled from within the host software to initiate a flash trigger sequence. 2.4.MicroscopeAn epifluorescence microscope (Zeiss Axioskop, Carl Zeiss, Oberkochen, Germany) was fitted with a dual illumination port to enable the attachment of the Oriel flash lamp. The instrument could then use either a standard 50-W Hg vapor lamp for conventional epifluorescence microscopy or switch to the flash lamp for time-resolved studies. The BHHCT chelate was optimally excited at 330 nm and has a narrow (6-nm) spiked emission at 617 nm. The microscope was fitted with conventional epifluorescence (Zeiss) filter sets 487909 and 487902 for use with FITC (fluorescein) and DAPI (4′, 6-diamindino-2-phenylindole) labels, respectively. A bandpass filter set (BFS) consisting of a Zeiss G365 excitation filter, FT560 beamsplitter, and 600-nm longpass emission filter was also constructed. Both the longpass filter set (LFS) used for DAPI and the bandpass filter set for which transmission diagrams are shown in Fig. 3 were used for TRFM image acquisition. Images were captured using a 40× Neophot objective and 10× camera adapter mount to give a final magnification of 400×. 2.5.Image Intensifier SensitivityA large dynamic range in the light intensity was encountered when observing flash discharge phenomena. It was necessary to determine the transfer function for different gain settings of the image intensifier and to check the linearity of the loop count used to integrate a faint signal over a number of capture cycles. The gain transfer curve was determined by setting the gain level at 50 and attenuating input light so that pixel brightness was 50 of maximum. The gain setting was then varied from 0 to 100 and the pixel brightness values recorded at each different gain setting. The linearity of the integrating loop count was similarly tested; the loop count was set at 128 (halfway) and pixel brightness at 50. The loop count was then varied and the resulting brightness value recorded. 2.6.Optical Arrangement Used to Image the Flash Lamp DischargeDuring initial testing of the TRFM, fluorophores with nanosecond fluorescence lifetimes were clearly imaged after tens of microseconds. The flash lamp discharge was monitored at microsecond intervals to determine if this was responsible for the long-lived fluorescence measurements. A 100-μm diameter pinhole in a brass shim served to attenuate flash intensity and to focus light onto the image intensifier. The shim was positioned between the flash lamp and the Dicam-Pro camera so that the pinhole was centered on the optical axis. With the camera and flash lamp butted together, a clear image of the flash arc could be captured. Light intensity from the flash varied greatly over the sampling period, and the camera loop count (integration period) was adjusted to maintain a linear response. 2.7.Determination of Flash Lamp LifetimeA positive intrinsic negative (PIN) photodiode with a response time of 10 ns was connected to a 500-MHz Tektronix oscilloscope to verify timing of the light output pulse from the flash lamp (measured at FWHM). Light from the flash lamp was focused through the microscope objective onto a nonfluorescent diffuse reflector mounted on a slide, and the photodiode was positioned near the reflector (1 cm) for maximum sensitivity. To determine the flash lamp plasma lifetime, the filter cassette on the epifluorescence microscope was removed and a (nonfluorescent) reflector inserted to direct scattered light from the flash lamp into the image-intensified camera. Average pixel brightness values were collected from the same region in each captured frame as the gate-delay period was increased in duration from 0 to 100 μs. The data were then analyzed using Origin 6.0 software (Microcal Software Inc., Northampton, Massachusetts). 2.8.Calculation of Improvement in Signal-to-Noise RatioThe signal corresponds to fluorescence emitted by immunolabeled cysts, and noise is represented by autofluorescence; the peak fluorescence intensity of cysts and autofluorophores was recorded with and without the benefit of TRFM. An improvement in S/N ratio was determined using Eq. (1) where I0 and IN are peak pixel intensities after gate delays of 0 and N μs, respectively. 2.9.Acquisition ParametersThe faint luminescence from the immunoconjugate-lableled cysts was integrated over 250 capture cycles using a flash lamp repetition rate of 40 Hz. The number of capture cycles is referred to as a loop count and the maximum value permitted by the software was 255. Acquisition time for a single image was about 7 s when the maximum loop count was enforced. Although the resolution of the CCD was 1024×1280, binning of pixels in both the vertical and horizontal directions (4 or 16 pixels into 1) produced images that spanned the full dynamic range of the instrument at a moderate image-intensifier gain (60); resolution was thus decreased (640×512 or 320×256) in this mode. Exposure time (integration period) for each capture cycle was 5 ms. For images captured using the LFS, an image-intensifier gain of 60 and 2×2 binning was employed with a maximum gate delay of 50 μs. Image acquisitions using the BFS required an image-intensifier gain of 50 and 4×4 binning, owing to lower light levels. 2.10.Buffers and ReagentsConjugation buffer: Bicarbonate solution (0.1 M, pH 9.0); Phosphate-buffered saline (PBS, 0.02 M, pH 7.4) prepared with 2× Aldrich P-4417 tablets in de-ionized water (200 ml). TRFM buffer: Bicarbonate solution (0.1 M, pH 8.4) with the addition of Triton X (10 μM) and 0.05 sodium dodecyl sulfate (SDS). Polyvinyl alcohol (PVA)/Eu 3+: The viscosity of the europium chloride solution (7.5 mM) was increased by the addition of polyvinyl alcohol (40 mg.ml−1) to slow evaporation and retard movement of cysts during microsocopy. BHHCT: As indicated, 4,4′-bis-(1″,1″,1″,2″,2″,3″,3″-heptafluoro-4″,6″-hexanedion 6″- yl)chlorosulfo-o-terphenyl was prepared by the published method.14 2.11.Water SampleThe 10,000:1 concentrate of environmentally sourced water used for this work was prepared from 10 liters of backwash water samples using the flocculation method.15 The concentrate was a rich source of autofluorescent mineral particles, algae, and plant debris. 2.12.Conjugation of BHHCT to Anti-Giardia AntibodyAnti-Giardia antibody (100 μl; 2.7 mg⋅ml −1; G203; Ausflow, Sydney, Australia) was exchanged for conjugation buffer (100 μl) using Millipore Ultrafree Biomax 50K centrifugal filters. The antibody was reacted with BHHCT (10 μl; 12.6 mg⋅ml −1) in dimethylformamide (DMF) for 1 h at 26 °C, followed by filtration on Millipore Ultrafree (0.2 μm) filter units to remove any precipitate. The filtrate was transferred to a centrifugal filter for removal of unconjugated BHHCT. The filter units were centrifuged until the residual volume was 15 μl or less before fresh PBS buffer was added. Three buffer exchanges were performed and the immunoconjugate was then taken up in 100 μl of PBS and filtered (0.2 μm) to remove any precipitate. BHHCT has an extinction coefficient of 3.41×104 cm −1 M −1 at 320 nm, and the ratio of absorbance at 280 and 320 nm was 0.560 in the presence of protein. The ratio used to determine protein content was verified using chemical methods (BCA protein assay, Pierce; Rockford, Illinois). For this conjugate, the fluorescence to protein ratio (F/P) was determined as 23 based on the absorbance at 320 nm. G203 antibody has negligible absorption at 320 nm, so the observed value was attributed entirely to BHHCT. 2.13.Immunofluorescence Labeling of Giardia CystsAn aliquot (100 μl) of PBS containing approximately 2500 Giardia cysts was filtered on a Millipore Isopore membrane filter (0.8 μm) and washed (3×100 μl PBS). The prepared BHHCT-immunoconjugate was diluted (20:1; 95 μl PBS) to a final concentration of 37 μg⋅ml −1 and applied to the membrane filter. After 30 min of incubation, the membrane was washed (3 times in 100 μl of PBS) and transferred to a microreaction vial containing 30 μl of 0.1 M NaHCO 3 solution at pH 8.5. Water concentrate (100 μl) was filtered (0.8 μm), washed (3 times in 100 μl of PBS), and the membrane similarly transferred to a micro reaction vial containing NaHCO 3 buffer. After vortexing of the vials, a 5-μl aliquot of the Giardia suspension was combined with a 10-μl aliquot of the water concentrate suspension together with 5 μl of TRFM buffer and 5 μl of PVA/Eu 3+ solution. Slides were prepared using a 5-μl aliquot of the spiked water concentrate and examined using both 600-nm bandpass and 420-nm longpass filter sets on the TRFM. 3.Results and Discussion3.1.Image-Intensifier Integration LinearitySoftware supplied with the Dicam-Pro CCD camera provides a dialogue that permits setting the loop count, or number of integration cycles, to a value between 1 and 255. The loop-count feature permits the CCD to integrate charge from a consecutive series of exposures and thus provide increased image brightness. The graph shown in Fig. 4 indicates that pixel brightness responds linearly to the integration loop count with a correlation coefficient of 0.9993. The response of the system can be expressed by the relation: where IL was pixel brightness at loop count L (0<L<255).Figure 4This graph illustrates the linear relationship between loop count (integration period) and image brightness.  Linear scaling of pixel brightness can be achieved through manipulation of the loop count. Images captured with brightness levels that exceeded the dynamic range of the camera were scaled to lower intensities by decreasing the loop count. A valid comparison of brightness levels between images captured with different loop counts could still be made by reference to the linear expression of Eq. (2). 3.2.Image-Intensifier Gain CurveThe relationship between pixel intensity and image-intensifier gain was observed to have a sigmoidal response, illustrated in Fig. 5. High brightness regions move the curve to the left and up whereas low light levels force the curve down and to the left. Figure 5The gain transfer curve plots the combined response of the image intensifier, lens coupler, and the CCD element.  Relating pixel brightness levels between images captured with different gain settings is difficult and prone to error. Instances where image brightness exceeded the dynamic range of the camera were corrected by adjusting the loop count rather than the intensifier gain setting. Gain settings of greater than 75 resulted in a progressive loss of image definition and increased speckle noise. Good image definition was achieved with an intensifier gain of 60, and this setting was found to offer the best compromise between sensitivity and background noise. The major contribution to background in time-resolved mode was noise from the image intensifier rather than integration noise from the cooled CCD. Faint images of weakly fluorescent targets were best captured with a maximum gain setting of 60, 4×4 binning of adjacent pixels (charge on 16 pixels integrated into a single pixel), and a maximum loop count of 255. 3.3.Flash Lamp Plasma DynamicsThe sequence of images shown in Fig. 6 illustrates the relatively long life of the flash lamp plasma. The manufacturer reports a flash duration of 1.6 μs FWHM for the 6426 guided-arc flash lamp used here. The oscilloscope trace (top of Fig. 6) confirms that peak light output occurs over a duration of less than 2 μs. However, with the system configured as described in Sec. 2.6, faintly glowing plasma up to 500 μs after arc formation could be detected. The discharge electrodes are clearly visible in the upper and lower portions of the frames captured at 5- and 10-μs gate-delay periods. The much thinner guide electrodes oriented horizontally ensure repeatable arc paths.16 Figure 6This sequence of images shows the dynamic behavior of flash lamp plasma over a period of 100 μs from initial arc formation. The oscillogram at the top shows the light intensity of the discharge peaks within 2 μs.  For the images shown in Fig. 6, loop counts and gain of the intensifier were not equal; rather, they were adjusted to provide maximum visibility of the charged plasma. Thus direct comparison of plasma brightness was not possible with the sequence shown here. Movement of the plasma from the vertical into the horizontal plane begins at about 20 μs and evolves further to produce two luminous balls clearly visible at gate delays of 70 to 100 μs. These structures fade with longer gate delays (greater than 150 μs) to form a uniform, faintly luminous glow that persists for up to 500 μs. 3.4.Flash lamp Plasma Lifetime (τ)For determination of the plasma lifetime, light output from the flash lamp was averaged by reflection from a (nonfluorescent) diffuse white surface. Gain on the image intensifier was held constant at 60 and the loop count was varied to extend the dynamic range capability of the camera. The dynamics of the flash lamp arc contribute to a complex curve defining the temporal evolution of the plasma fluorescence. There are distinct phases in the process of fluorescence decay that occur with different time constants. Most of the radiant energy was released during the first 5 μs (Fig. 7); however, the exponential tail extends for hundreds of microseconds. The multiexponential nature of the flash lifetime became more apparent when log e of light intensity was plotted against the gate-delay period for various intervals during the flash discharge (data not shown). The 1-μs interval from 1 to 2 μs corresponds to peak light emission and returns a value for τ of 1.6 μs; the period from 3 to 5 μs has a τ of 7.5 μs that lengthens to 13.3 μs for the gate-delay interval 10 μs to 30 μs. Extending the measurement period to gate delays ranging from 30 to 50 μs results in a value of 18.2±0.43 μs for τ; this value remains relatively constant as gate delay is extended farther. 3.5.TRFM Effectiveness in Suppressing Background AutofluorescenceWith gate delays of 0 μs, the autofluorescence levels visible in Figs. 8(a) and 8(b) differ significantly as a result of different levels of spectral selection in the detection channel used for acquisition. The top sequence was acquired using the LFS [Fig. 3(a)] at gate delay periods extending to 50 μs, and the lower sequence was obtained using the BFS [Fig. 3(b)] and a maximum gate delay of 60 μs. The morphology of the autofluorescing components was discernible in the first two frames of the top sequence, and image brightness was significantly greater using the LFS. Although autofluorescence was significantly reduced when the BFS was employed, the fluorescence intensity of the labeled cyst was also reduced. Figure 8Environmental water concentrate spiked with BHHCT-labeled Giardia cysts. The TRFM image sequence illustrates the suppression of autofluorescence as gate delay was increased. (a) Sequence acquired using a longpass filter set. (b) Image sequence acquired using a 600-nm bandpass filter. Pixel values were sampled between points A and B to produce the line profile shown in Fig. 9. The line profiles were acquired at three different gate-delay settings using (a) a bandpass filter set and (b) a longpass filter set.  Figure 9Line profiles of pixel intensities between points A and B (Fig. 8) acquired at three different gate-delay settings using (a) a custom 600-nm bandpass filter set and (b) a longpass filter set. 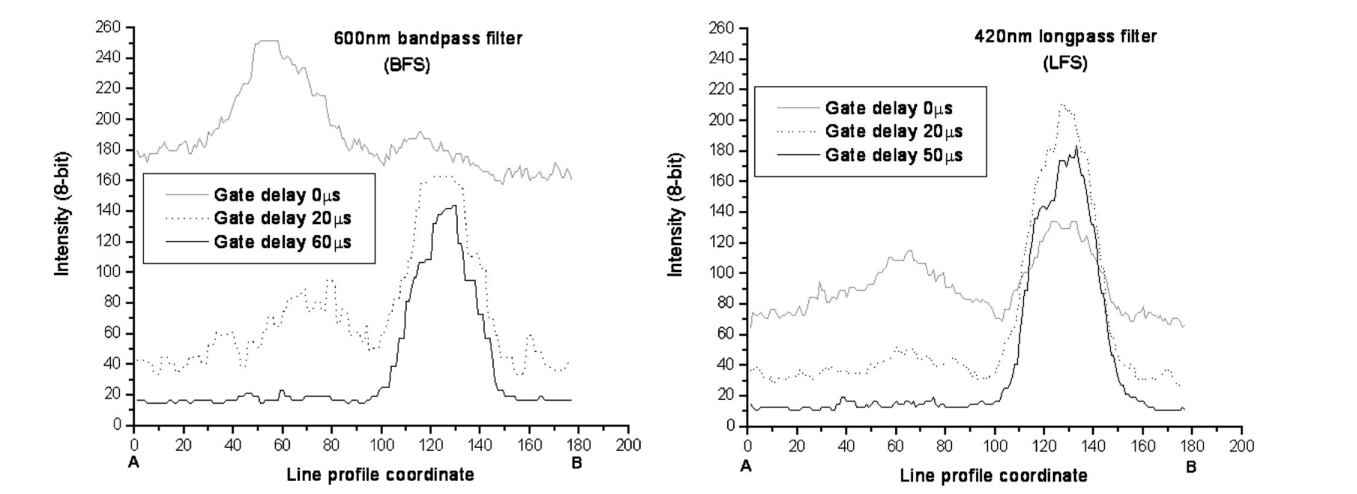 A line profile of pixel intensities between the two points marked A and B was captured from images acquired at different gate-delay settings. These profiles are plotted in Fig. 9 and permit direct comparison of the results obtained from each filter set. Key parameters were extracted from the plot and recorded in Table 1 together with the S/N ratio values [determined using Eq. (1)]. Autofluorescence was suppressed in TRFM mode (using maximum gate delay) by a factor of 13.9 for the LFS and 17.2 for the BFS. The slightly longer gate delay of 60 μs used to acquire the last frame shown in Fig. 8(b) effectively reduced autofluorescence to the same level as nonfluorescing background. Autofluorescence was suppressed to a value (16) only slightly above background with the LFS, and the effective contrast level between the labeled cyst and background was maximal (11.3) using this configuration. The autofluorescence visible at gate delays of 20 μs is due entirely to excitation from the decaying flash lamp plasma and does not indicate the presence of long-lived autofluorophores. Background levels increased in direct response to an image-intensifier gain, and integration noise from the CCD did not significantly contribute to background. Increasing the image-intensifier gain above 60 degraded image quality and raised the noise floor level; the S/N ratio was not effectively improved. Brightly fluorescing and long-lived immunolabels are essential to provide good S/N results. Yuan et al.;14 reported that τ for BHHCT ranged from 325 to 640 μs, depending on the buffer used, and we observed a fluorescence lifetime of 339±14 μs for BHHCT-labeled Giardia cysts (data not shown). Table 1
3.6.Spectral SelectionThe BFS was constructed from optical components that were on hand and was unusual in some respects. Ideally the detection filter set would utilize a bandpass emission filter with a narrow passband (10 nm FWHM) centered on the chelate emission at 617 nm. Such a filter was obtained; however, it was too thick to fit in the filter cassette and a replacement filter with a broad passband ranging from 350 to 650 nm was substituted. The resultant filter set had a bandpass region centered on 600 nm with an FWHM of 70 nm and a dip in response at 605 nm, resulting in 70 transmission at this wavelength, increasing to 90 at 620 nm. Most autofluorescence emission from the water concentrate occurred below 560-nm and was removed by the beamsplitter, simplifying the task of locating immunolabeled cysts. The 600-nm bandpass filter effectively removed much of the distracting autofluorescence present in water concentrates. With reference to the first frames in Figs. 8(a) and 8(b), there is a large reduction in autofluorescence signal when the BFS is used as opposed to the LFS. Although the cyst fluorescence was less intense with the BFS, labeled Giardia cysts were still located with relative ease at 100× magnification by quickly scanning the slide. The autofluorescent region visible directly below the letter “A” in Fig. 8(b) is indistinct in the frame captured with the LFS, yet appears to be more than 1.3 times brighter than the cyst label when viewed with the BFS. A narrow passband filter may have reduced the intensity of autofluorescence but not removed it entirely. 3.7.F/P Ratio of Immunofluorescent LabelMost reports detailing the use of time-resolvable immunofluorescent labels recommend the use of carrier proteins that are heavily labeled with the fluorophore and then bound to the immunoglobulin by various strategies.7 17 18 19 20 21 We have found that BHHCT offers sufficient fluorescence intensity to permit direct attachment to anti-Giardia immunoglobulin to form a useful immunofluorophore. Cysts properly labeled with BHHCT appear an orange-red when excited with UV on an epifluorescence microscope with a brightness comparable to a similarly labeled cyst using fluorescein (FITC). F/P ratios of 20 or more are necessary to achieve highly fluorescent immunoconjugates; however, such heavy labeling destabilizes the protein and results in gradual loss through precipitation. Despite the high F/P ratio, BHHCT-labeled immunoconjugate prepared by this protocol retains much of its native affinity for its epitope and nonspecific binding was not observed. Although not numerous, micron-sized particles of brightly fluorescing precipitate were observed in all slide preparations. Immunolabeled cysts were stable for several weeks and no degradation of the label was observed; the cysts used for this work were labeled with BHHCT immunoconjugate 9 weeks prior to spiking the water concentrate. TRFM buffer is an essential component in realizing the full fluorescence potential of the immunolabel, and when PBS was substituted for TRFM buffer, fluorescence intensity was markedly decreased at low europium concentrations (1 mM). Preparation of the immunoconjugate can be completed within 3 h and fresh reagent produces superior results. 4.ConclusionThe decay of energy from the flash lamp was observed to be multiexponential and most of the discharge cycle was complete within a 3-μs period. The period immediately following the arc discharge was characterized by a rapid decay in light intensity, with a lifetime varying from 1.6 to 13 μs. Subsequent decay of residual plasma after 30 μs occurs, with an approximate lifetime of 18 μs. This value was similar to that reported for other TRFM systems using flash lamps as the excitation source.13 BHHCT-immunoconjugate labels have a fluorescence lifetime of 339 μs in TRFM buffer, and the decay process can be reasonably modeled using single exponential decay kinetics.22 Some indication of the importance of using a long-lived immunolabel with a flash lamp-excited time-resolved microscope can be gained by noting that after 100 μs, the chelate retains 74 of its initial fluorescence intensity, whereas flash intensity was reduced to a level of 0.4 of I18 μs (intensity of the flash discharge after 18 μs). TRFM can greatly reduce autofluorescence signal and deliver images with complex background features removed. Such images are well suited for rapid analysis using automated image analysis software. Moreover, the lanthanide chelate Stokes shift is unusually large, so that spectral selection techniques are advantageously applied in these instances. Autofluorophores are sufficiently abundant and varied to present a problem regardless of the unusual spectral characteristics of BHHCT labels. Porphyrins are ubiquitous in nature and form the backbone of many naturally occurring fluorophores, including phycoerythrin, hemoglobin, and chlorophyll. Their fluorescence emissions range over the visible spectrum, and red autofluorescence is commonly observed.23 Epicocconone is another naturally occurring compound with the potential to produce autofluorescence that is refractory to spectral selection methods. It is produced by the fungus Epicoccum nigrum and combines with proteins and other naturally occurring compounds to form strong autofluorophores excitable at UV wavelengths. It is interesting that this compound has a broad emission that extends into the red end of the spectrum (610 nm) and would not be removed using spectral selection.24 TRFM has maximal utility when such autofluorophores are encountered and emission intrudes into the passband of the immunolabel. We have shown that the readily synthesized europium chelate BHHCT can form highly fluorescent immunoconjugates with retention of epitope affinity. The immunoconjugates have proven effective in greatly suppressing background autofluorescence in TRFM using a flash lamp as the excitation source. Direct labeling of immunoglobulins greatly simplifies the protocol for preparation of immunolabels compared with methods using carrier proteins. Prelabeled cyst-spiked water concentrates were used for this work. However, using similar techniques we have successfully labeled Giardia cysts and Cryptosporidium oocysts in situ with time-resolvable immunofluorophores.25 AcknowledgmentsWe wish to thank the Australian Research Council and Becton Dickinson Corp. (USA) for their financial support. REFERENCES
J. A. McKay
,
G. I. Murray
,
W. N. Keith
, and
H. L. McLeod
,
“Amplification of fluorescent in-situ hybridization signals in formalin fixed paraffin wax embedded sections of colon tumor using biotinylated tyramide,”
Molec. Pathol. , 50
(6), 322
–325
(1997). Google Scholar
B. C. Ferrari
,
G. Vesey
,
K. A. Davis
,
M. Gauci
, and
D. Veal
,
“A novel two-color flow cytometric assay for the detection of Cryptosporidium in environmental water samples,”
Cytometry , 41 216
–222
(2000). Google Scholar
D. A. Veal
,
D. Deere
,
B. Ferrari
,
J. Piper
, and
P. V. Atfield
,
“Fluorescence staining and flow cytometry for monitoring microbial cells,”
J. Immunol. Meth. , 243 191
–210
(2000). Google Scholar
S. I. Klink
,
G. A. Hebbink
,
L. Grave
,
P. G. B. O. Alink
,
F. C. J. M. v. Veggel
, and
M. H. V. Werts
,
“Synergistic complexation of eu
3+
by a polydentate ligand and a bidentate antenna to obtain ternary complexes with high luminescence quantum yields,”
J. Phys. Chem. , 106 3681
–3689
(2002). Google Scholar
J. Yuan
,
G. Wang
,
K. Majima
, and
K. Matsumoto
,
“Synthesis of a terbium fluorescent chelate and its application to time-resolved fluoroimmunoassay,”
Anal. Chem. , 73
(8), 1869
–1876
(2001). Google Scholar
L. Seveus
,
M. Vaisala
,
S. Syrjanen
,
M. Sandberg
,
A. Kuusisto
,
R. Harju
,
J. Salo
,
I. Hemmila
,
H. Kojola
, and
E. Soini
,
“Time-resolved fluorescence imaging of europium chelate label in immunohistochemistry and in-situ hybridization,”
Cytometry , 13
(4), 329
–338
(1992). Google Scholar
N. P. Verwoerd
,
E. J. Hennink
,
J. Bonnet
,
C. R. G. Van der Geest
, and
H. J. Tanke
,
“Use of ferroelectric liquid crystal shutters for time-resolved fluorescence microscopy,”
Cytometry , 16 113
–117
(1994). Google Scholar
A. Periasamy
,
P. Wodnicki
,
X. F. Wang
,
S. Kwon
,
G. W. Gordon
, and
B. Herman
,
“Time-resolved fluorescence lifetime imaging microscopy using a picosecond pulsed tunable dye laser system,”
Rev. Sci. Instrum. , 67
(10), 3722
–3731
(1996). Google Scholar
E. Reichstein
,
Y. Shami
,
M. Ramjeesingh
, and
E. P. Diamandis
,
“Laser-excited time-resolved solid-phase fluoroimmunoassays with the new europium chelate 4,7-bis(chlorosulfophenyl)-1, 10-phenanthroline-2,9-dicarboxylic acid as label,”
Anal. Chem. , 60
(10), 1069
–1074
(1988). Google Scholar
R. J. Hennink
,
R. de Haas
,
N. P. Verwoerd
, and
H. J. Tanke
,
“Evaluation of a time-resolved fluorescence microscope using a phosphorescent Pt-porphine model system,”
Cytometry , 24 312
–320
(1996). Google Scholar
G. Vereb
,
E. Jares-Erijman
,
P. R. Selvin
, and
M. T. Jovin
,
“Temporally and spectrally resolved imaging microscopy of lanthanide chelates,”
Biophys. J. , 74
(May), 2210
–2222
(1998). Google Scholar
J. Yuan
and
K. Matsumoto
,
“A new tetradentate β-diketonate-europium chelate that can be covalently bound to proteins for time-resolved fluoroimmunoassay,”
Anal. Chem. , 70
(3), 596
–601
(1998). Google Scholar
G. Vesey
,
J. S. Slade
,
M. Byrne
,
K. Shepherd
, and
C. Fricker
,
“A new method for the concentration of Cryptosporidium oocysts from water,”
J. Appl. Bacteriol. , 75 82
–86
(1993). Google Scholar
E. P. Diamandis
,
R. C. Morton
,
E. Reichstein
, and
M. J. Khosravi
,
“Multiple fluorescence labeling with europium chelators. Application to time-resolved fluoroimmunoassays,”
Anal. Chem. , 61
(1), 48
–53
(1989). Google Scholar
R. A. Evangelista
,
A. Pollak
,
B. Allore
,
E. F. Templeton
,
R. C. Morton
, and
E. P. Diamandis
,
“A new europium chelate for protein labelling and time-resolved fluorometric applications,”
Clin. Biochem. , 21 173
–178
(1988). Google Scholar
I. Hemmila
,
S. Dakubu
,
V.-M. Mukkala
,
H. Siitari
, and
L. Timo
,
“Europium as a label in time-resolved immunofluorometric assays,”
Anal. Biochem. , 137 335
–343
(1984). Google Scholar
E. Heyduk
and
T. Heyduk
,
“Thiol-reactive, luminescent europium chelates: luminescence probes for resonance energy transfer distance measurements in biomolecules,”
Anal. Biochem. , 248 216
–227
(1997). Google Scholar
J. Yuan
,
G. Wang
,
H. Kimura
, and
K. Matsumoto
,
“Highly sensitive time-resolved fluoroimmunoassay of human immunoglobulin E by using a new europium fluorescent chelate as a label,”
Anal. Biochem. , 254 283
–287
(1997). Google Scholar
R. E. Connally
,
D. A. Veal
, and
J. Piper
,
“High resolution detection of fluorescently labeled microorganisms in environmental samples using time-resolved fluorescence microscopy,”
FEMS Microbiol. Ecol. , 41 239
–245
(2002). Google Scholar
M. Inaguma
and
K. Hashimoto
,
“Porphyrin-like fluorescence in oral cancer: in vivo fluorescence spectral characterization of lesions by use of a near-ultraviolet excited autofluorescence diagnosis system and separation of fluorescent extracts by capillary electrophoresis,”
Cancer (N.Y.) , 86
(11), 2201
–2211
(1999). Google Scholar
P. J. L. Bell
and
P. Karuso
,
“Epicocconone, a novel fluorescent compound from the fungus Epicoccum nigrum,”
J. Am. Chem. Soc. , 125
(31), 9304
–9305
(2003). Google Scholar
R. E. Connally
,
D. A. Veal
, and
J. Piper
,
“Time-resolvable fluorescent conjugates for the detection of pathogens in environmental samples containing autofluorescent material,”
Proc. SPIE , 4967 146
–155
(2003). Google Scholar
|
|||||||||||||||||||||||||||||||||||||||||||||