|
|
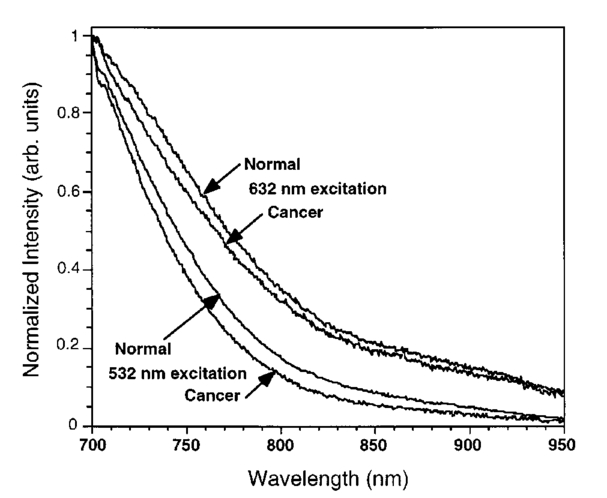
1.IntroductionExcept for skin cancer, all other types of cancer occur internally and are very difficult to detect at early stages. A large percentage of these cancers occur in parts of the body that can be reached and viewed using various types of endoscopes. The rapid development in laser technologies, optical imaging systems, and compact personal computers that took place over the past three decades has opened a window of opportunity to introduce novel photonic methods for the detection and treatment of disease.1 2 Various methods to detect and diagnose cancer in real time are under consideration. These methods are based on the detection of disease-specific optical signatures originating in tissue structures and endogenous or exogenous chromophores. Using such technology, stomach, cervix, uterus, colon, rectum, bronchus, and bladder cancers could be detected at early stages when they are most successfully treated. The advantages from the development of medical modalities that could provide sensitive and accurate real-time diagnosis would be tremendous. Conventional white light endoscopic examination of the bladder does not provide adequate information about the presence of an embedded urotherial cancerous lesion. In response to this problem, a number of approaches for cancer detection and/or imaging in the bladder that are based on emerging photonic technologies have been proposed. Using the application of exogenous factors (such as topical application of 5-aminolevulinic acid), porphyrin concentration in the tumor areas is increased and can be detected using a fluorescence diagnostic method.3 4 5 Diagnosis using light scattering spectroscopy has also shown promise for the detection of cancer.6 7 Normal superficial microstructures of the bladder can be imaged using optical coherence tomography, while loss of normal structure can be associated with disease.8 9 10 The use of tissue autofluorescence has also attracted attention and has shown promising results.11 12 13 14 In a paper by Anidjar et al.; it was reported that the emission intensity of cancer tissue was lower than that of normal tissue under laser excitation wavelengths at 308, 337, and 480 nm.12 Changes in the emission spectral profiles between normal and cancer bladder tissues have also been observed under UV excitation.12 13 14 Koening et al.; have used the ratio of the emission intensity at 385 and 455 nm under 337-nm laser excitation as a diagnostic algorithm.14 The positive results reported in the literature regarding the detection of cancer in the bladder, in combination with easy access to the bladder for in vivo application, has highlighted the potential of photonic technology for in vivo detection and imaging of bladder cancer. The feasibility of developing multimodality surface and near-surface cancer imaging and detection methods in the bladder that are compatible with existing cystoscopes is the focus of this investigation. Two main imaging approaches are explored: near-infrared (NIR) polarized elastic light scattering, and tissue autofluorescence in the NIR spectral region under laser excitation in the green and red spectral regions. These methods are compatible with existing endoscopic imaging modalities, which makes them suitable for in vivo imaging of cancer without the development of new instruments for clinical use. 2.Experimental MethodsThe experiments were carried out using a compact imaging instrument that we have built that was located adjacent to the surgical pathology grossing room of the University of California–Davis Medical Center in Sacramento, California. This allowed us to perform in vitro measurements of bladder tissue specimens obtained by transurethral resection or following cystectomy. Our experiments were performed immediately after surgical removal from the body, followed by fixation of the sample for histopathological examination. Tissue samples were selected by the surgical pathologist for analysis. A detailed description of the experimental system is given elsewhere.15 In brief, the images are captured using a 35-mm camera lens coupled to a liquid nitrogen-cooled CCD camera. Cross-polarized light-scattering images of the samples were recorded under near-infrared polarized illumination at 700, 850, and 1000 nm attained using two polarization elements located in front of the illumination source and the camera lens. The wavelength is selected using 40-nm bandwidth interference filters positioned on a filter wheel located at the output of the fiber bundle that delivers the illumination from a white light source. In addition, we recorded the autofluorescence images of the specimens in the 700 to 1000-nm spectral region using laser excitation at 532 nm with a compact diode-pumped laser and at 632.8 nm using a helium:neon (He:Ne) laser. The wavelength of the light emitted by the tissue is selected using a 700-nm long-pass filter located in front of the CCD camera. The images obtained with this system are then compared with the histopathology map of the specimen. This study discusses measurements of bladder specimens from 25 cancer patients for which pathological examination (performed after the completion of the experiments reported in this work from each patient) showed both normal and cancerous tissue components. Only this set was selected for the study because we wanted to compare normal and cancerous tissue components from the same patient to avoid accumulation of inconsistent results arising from variability in tissue properties among different patients. Most samples were small (5 mm in diameter or less) because they were obtained by transurethral resection. The samples were compressed between glass slides to a uniform thickness of approximately 1 mm. Following the acquisition of optical spectroscopic images as described earlier, all tissue samples were processed for pathological examination using standard procedures. Usually a number of specimens or parts of a specimen were normal. This allowed comparison of the properties of normal and cancer tissue as manifested in the optical images. Samples obtained from cystectomy were larger, typically having lateral dimensions of 3 to 4 cm and a thickness of approximately 5 mm. These samples were obtained from cross-sectioning parts of the bladder containing normal and tumor tissue. 3.Experimental ResultsTypical experimental results from specimens obtained from a patient that had undergone cystectomy are shown in Fig. 1 and Fig. 2. Figure 1(a) shows the cross-polarized light-scattering image of a 3.0×2.7 cm 2, 0.5-cm-thick specimen under 700-nm polarized illumination. Figures 1(b) and 1(c) show the autofluorescence images in the 700 to 1000-nm spectral region under 532-nm and 632.8-nm laser excitation, respectively. The cancer lesion is located in the lower left part of the image and is clearly visible in all cases as a feature with a lower image intensity than the normal tissue. Figure 1Images of a human bladder tissue specimen. (a) Cross-polarized light scattering under 700-nm illumination. (b) NIR fluorescence images under 532-nm and (c) 632.8-nm laser excitation. (d) Ratio of the autofluorescence image under 632.8-nm excitation over that under 532-nm excitation. (e) Interimage ratio of a cross-polarized scattering image recorded under illumination at 700 nm over the fluorescence image under 532-nm excitation. (f) H&E, stained section of the same specimen.  Figure 2Images of a human bladder tissue specimen. The images are displayed in the same order as in Fig. 1. 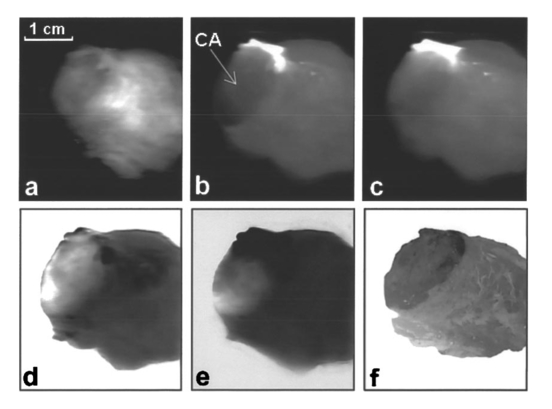 In order to provide a quantitative description of the intensity difference between normal and cancer tissue, we define the relative intensity difference ΔICA as where I NORMAL and I CANCER are the average image intensities from the normal and cancer tissues, respectively. The average intensity was obtained by estimating the average intensity from four different, 36-pixel (1-mm 2) areas in the image for each tissue component that are not close to the edge of the specimen. We find that for the specimen shown in Fig. 1, ΔICA≈(−)0.22 in the 700-nm cross-polarized light-scattering image, indicating a significant difference in intensity between normal and cancer tissue. This difference is further enhanced in the autofluorescence images. More specifically, ΔICA≈(−)0.63 and ≈(−)0.33 in the NIR autofluorescence images obtained under 532 nm and 632.8 nm, respectively.The ratio between images (performed using pixel-by-pixel division between the digitally recorded images) can further enhance the visibility of the cancer lesion and better delineate the tumor’s margins. Figure 1(d) shows the ratio-image obtained from division of the NIR autofluorescence image under 632.8-nm excitation over that under 532-nm excitation. In this case, the digitized intensity from the tumor is higher than that arising from normal tissue, with ΔICA≈(+)0.82. Figure 1(e) shows the ratio image obtained from division of the 700-nm cross-polarized light-scattering image [in Fig. 1(a)] over the NIR autofluorescence image under 532-nm excitation [in Fig. 1(b)]. In this image, the tumor also appears as a feature with higher intensity where ΔICA≈(+)1.1. A contrast-enhanced hematoxylin and eosin (H&E)-stained paraffin section of the same specimen is shown in Fig. 1(f). In the later image, the feature that is darker in intensity represents the cancerous section of the specimen. A comparison of the image of the H&E section with the spectroscopic images shown in Figs. 1(a)–1(e) indicates an exact correlation of the tumor and the tumor’s margins. Figure 2 shows a second example from a 3.1×2.6-cm 2, 0.5-cm-thick section of bladder tissue that was also obtained from cystectomy. The images are arranged in the same order as in Fig. 1. The cancer is located in the left side of the specimen. The bright feature in the fluorescence images is a necrotic section of this tumor. The emission from this section is higher by a factor of ≈5 compared with that of the rest of the tumor. This array of images clearly indicates that the tumor can be visualized and tumor margins can be clearly delineated. In this specimen, ΔICA≈(−)0.25 in the 700-nm cross-polarized light scattering image, while ΔICA≈(−)0.71 and ≈(−)0.45 in the NIR autofluorescence images obtained under 532-nm and 632.8-nm, respectively. The correlation between the histological findings and the optical imaging examination as described earlier has been very consistent. In all cases, the tumor tissues exhibited optical characteristics similar to those illustrated here. However, the absolute changes between normal and cancer tissue were somewhat different among specimens from different patients. This may be due to three different factors. First, it is known that there are differences in fluorescence and scattering properties in tissues from different patients. A second reason is associated with the thickness of our samples which, for practical reasons, could not be the same for all samples. A third important reason is that in some cases the tissue specimens were not uniform and contained both normal and cancer components in close proximity. The consequence of this is that the separation of the optical characteristics of the two tissue components is very difficult. Figure 3 demonstrates the latter case. Figure 3(a) H&E-stained section of bladder tissue with 75 infiltration by tumor. (b) Near-IR autofluorescence image under 632.8-nm excitation. The autofluorescence image was captured using a camera lens, resulting in low spatial resolution. The specimen is not aligned in the same way in the two images and therefore there is not an exact correlation of the observed features. The cancer is darker in both images.  Figure 3(a) shows a ≈3×5-mm 2, 1-mm-thick H&E stained paraffin section of bladder tissue with diffuse infiltration by tumor involving 75 of the section. Figure 3(b) shows the NIR autofluorescence image under 632.8-nm excitation of the same specimen. The specimen is not aligned in the same way in the two images and therefore there is not an exact correlation of the observed features. In the NIR fluorescence image, the cancer appears darker than normal tissue and clearly shows the infiltration of the specimen by the tumor. However, it is difficult in this specimen to measure the absolute values of the intensity from cancer and normal tissue owing to the proximity and overlap of the signal from each tissue component. The characteristic example in Fig. 3 shows the advantage of using imaging methods rather than single-point spectroscopy methods. Past work on spectroscopic detection of bladder cancer using intrinsic contrast mechanisms has been performed using single-point measurements suitable for laser spectroscopy-guided biopsy.6 7 11 12 13 14 In such an arrangement, tissue specimens such as that shown in Fig. 3 could give rise to ambiguous results, and if the cancer infiltration is small, the single-point spectroscopic reading may be negative. Our experimental results on the difference in intensity between normal and cancer tissue components are summarized in Table 1. Table 1
Emission spectra from normal and cancer bladder tissues under 532- and 632.8-nm excitation were obtained using an optical parametric oscillator (OPO) laser system for excitation. Typical spectra are shown in Fig. 4, where the emission intensity is normalized at 700 nm, which is the lower limit of the spectral band used for image acquisition. The spectra from normal tissues are similar to those of cancer and do not show any distinctive features. The native tissue emission under 632.8-nm excitation has an enhanced contribution at longer wavelengths compared with that under 532-nm excitation, especially in the 800 to 950-nm spectral region. This difference in the spectral profiles may explain the different relative intensity difference observed between normal and cancer bladder tissue in the autofluorescence images under 532- and 632.8-nm excitation as discussed earlier. 4.DiscussionAutofluorescence images under long-wavelength excitation can help detect and image cancer that is located in the superficial tissue layers, probably not deeper than 1 to 2 mm from the surface. Previous studies on detection of bladder cancer using the native fluorescence of tissue have concentrated on using shorter excitation wavelengths, mostly in the ultraviolet spectral region.11 12 13 14 Under these excitation conditions, the penetration depth of the excitation light is restricted to a few hundreds of micrometers from the surface, offering a smaller sampling volume than the approach discussed here. In addition, the utilization of the NIR spectrum of the emission minimizes the reabsorption of the emitted light by the tissue or localized blood concentrations. Tissue reabsorption has been reported in previous publications as influencing the experimental results using light-scattering or tissue autofluorescence spectroscopy.7 14 All previous reports using tissue autofluorescence have suggested that the emission from cancer tissue is significantly lower than that of normal bladder tissue.11 12 13 14 This behavior has been observed in our experimental results using longer excitation wavelengths and the NIR component of the emission. We have reported in a recent publication experimental results suggesting that NIR autofluorescence imaging under long-wavelength excitation provides a contrast between normal and cancer tissue. More specifically, the cancer lesion appears with higher intensity than normal tissue for most tissue types, such as breast, liver, and prostate.15 It was hypothesized that changes in the porphyrin content of the tissue arising from changes in the heme biosynthesis in tumoral cells is the reason for the enhanced NIR emission observed in cancer tumors. Our results show that bladder cancer appears with lower intensity than normal tissue. However, the ratio image arising from the division of the NIR autofluorescence images under 632.8-nm excitation over that obtained under 532-nm excitation [see Fig. 1(d) and Fig. 2(d)] show cancer with a higher intensity than normal tissue, suggesting that the NIR spectral component under 632.8-nm excitation is higher in cancer. Assuming that part of the NIR emission is due to porphyrins and that the relative contribution of the porphyrins in the NIR emission under 632.8-nm excitation is enhanced (owing to less efficient excitation of other chromophores), the images shown in Fig. 1(d) and Fig. 2(d) may indicate enhancement in porphyrin content in bladder tumors compared with normal tissue. The reduced intensity of the tumor in the NIR autofluorescence images could be due to tissue chromophores other than porphyrins, a hypothesis that is supported by the fact that 532-nm excitation provides higher contrast. The presence of differences between normal and cancer tissue in the cross-polarized light-scattering images [see Fig. 1(a) and Fig. 2(a)] provides another method to image cancer—probing a different set of intrinsic contrast mechanisms than tissue autofluorescence. Furthermore, the presence of a difference in the cross-polarized light-scattering images under different illumination wavelengths supports the implementation of the subsurface spectral and polarization difference imaging technique (SPDI).16 17 Experimental results using various animal tissue models suggest that the SPDI subsurface optical imaging method can offer imaging depths on the order of 1 cm. The interimage ratio of a cross-polarized light-scattering image recorded under illumination at 1000 and 700 nm exhibited a very small change (less than 3) in the average intensity between the normal and the cancer regions, suggesting that the relative intensity difference remains the same for illumination from 700 to 1000 nm. This indicates that the scattering intensity between normal and cancer tissues remains relatively unchanged as a function of the illumination wavelength, which further supports the implementation of the SPDI method. The flawless correlation between an examination with optical imaging and the histological findings suggests that transferring this technology from the pathology room to the cystoscopic suite and then to the urologist’s office will be a real advance in the management of patients with bladder cancer or suspected of having it. The most common presenting feature of transitional cell carcinoma (TCC) of the bladder is hematuria. The tumor is diagnosed at an outpatient cystoscopic examination. The patient is subsequently scheduled for outpatient surgery that requires anesthesia, cystoscopic examination, and transurethral resection (TUR). At present, 75 of such tumors have not invaded the bladder muscle and are called superficial. Initial therapy consists of a TUR. Tumors undergo histological examination and are given a grade (I, II, III), staged as Ta (confined to mucosa), T1 (into lamina propria but muscle below the tumor is uninvolved), or as carcinoma in situ (CIS), a flat lesion confined to the mucosa, which is virtually always high grade. Fifty percent of this group of superficial tumors will recur following initial therapy.18 The reasons that TCC tumors recur after resection are most likely the following: (1) bladder tumors are multifocal lesions by nature and subsequent tumors arise from areas of CIS that are not yet visible; (2) the area of tumor is not fully resected; (3) the urothelium is injured during the resection process and seeding by TCC cells occurs; and (4) recurrence represents a new tumor development. Given this clinical scenario, it is easy to see the value of a highly sensitive optical detection system in the management of this disease to the patient, doctor, and health-care system. Such an optical detection system would help: (1) define if the tumor was Ta, T1, or T2, (2) indicate if visibly normal mucosa is in fact harboring CIS, and (3) determine if all the tumor had been resected by the close of the surgical procedure. It could also be beneficial by enhancing the follow-up of patients with Ta and T1 tumors. It could increase the accuracy of detecting recurrent tumors. Finally, Ta lesions could be treated in the office rather than the operating room, and discolored areas that can be confused as either CIS or inflammation following intravesical therapy could be accurately analyzed. AcknowledgmentsThis work was performed in part at Lawrence Livermore National Laboratory under the auspices of the U.S. Department of Energy under contract W-7405-Eng-48. This research is supported by the California Cancer Research Program and the Center for Biophotonics, an National Science Foundation Science and Technology Center managed by the University of California, Davis, under cooperative agreement PHY 0120999. REFERENCES
S. K. Gayen
and
R. R. Alfano
,
“Emerging optical biomedical imaging techniques,”
Opt. Photonics News , 7
(3), 17
–22
(1996). Google Scholar
G. A. Wagnieres
,
W. M. Star
, and
B. C. Wilson
,
“In vivo fluorescence spectroscopy and imaging for oncological applications,”
Photochem. Photobiol. , 68
(5), 603
–632
(1998). Google Scholar
L. Baert
,
R. Berg
,
B. Van Damme
,
M. A. D’Hallewin
,
J. Johansson
,
K. Svanberg
, and
S. Svanberg
,
“Clinical fluorescence diagnosis of human bladder carcinoma following low-dose Photofrin injection,”
Urology , 41 322
(1993). Google Scholar
P. Jichlinski
,
M. Forrer
,
J. Mizeret
,
T. Glanzmann
,
D. Braichotte
,
G. Wagnieres
,
G. Zimmer
,
L. Guillou
,
F. Schmidlin
,
P. Graber
,
H. van den Bergh
, and
H.-J. Leisinger
,
“Clinical evaluation of a method for detecting superficial transitional cell carcinoma of the bladder by light-induced fluorescence of protoporphyrin IX following topical application of 5-aminolevulinic acid: preliminary results,”
Lasers Surg. Med. , 20 402
(1997). Google Scholar
M. Kriegmair
,
D. Zaak
,
K.-H. Rothenberger
,
J. Rassweiler
,
D. Jocham
,
F. Eisenberger
,
R. Tauber
,
A. Stenzl
, and
A. Hofstetter
,
“Transurethral resection for bladder cancer using 5-aminolevulinic acid-induced fluorescence endoscopy versus white light endoscopy,”
J. Urol. (Baltimore) , 168 475
(2002). Google Scholar
J. R. Mourant
,
I. J. Bigio
,
J. Boyer
,
R. L. Conn
,
T. Johnson
, and
T. Shimada
,
“Spectroscopic diagnosis of bladder cancer with elastic light scattering,”
Lasers Surg. Med. , 17 350
(1995). Google Scholar
F. Koenig
,
R. Larne
,
H. Enquist
,
F. McGovern
,
K. T. Schomacker
,
N. Kollias
, and
T. F. Deutsch
,
“Spectroscopic measurement of diffuse reflectance for enhanced detection of bladder carcinoma,”
Urology , 51 342
(1997). Google Scholar
C. A. Jesser
,
S. A. Boppart
,
C. Pitris
,
D. L. Stamper
,
G. Petur Nielsen
,
M. E. Brezinski
, and
J. G. Fujimoto
,
“High-resolution imaging of transitional cell carcinoma with optical coherence tomography: feasibility for the evaluation of bladder pathology,”
Br. J. Radiol. , 72 1170
(1999). Google Scholar
T. Q. Xie
,
M. L. Zeidel
, and
Y. T. Pan
,
“Detection of tumorigenesis in urinary bladder with optical coherence tomography: optical characterization of morphological changes,”
Opt. Express , 10 1431
(2002). Google Scholar
E. V. Zagaynova
,
O. S. Streltsova
,
N. D. Gladkova
,
L. B. Snopova
,
G. V. Gelikonov
,
F. I. Feldchtein
, and
A. N. Morozov
,
“In vivo optical coherence tomography feasibility for bladder disease,”
J. Urol. (Baltimore) , 167 1492
(2002). Google Scholar
M. A. D’Hallewin
,
L. Baert
, and
H. Vanherzeele
,
“Fluorescence imaging of bladder cancer,”
Acta Neurol. Belg. , 62 49
(1994). Google Scholar
M. Anidjar
,
D. Ettori
,
O. Cussenot
,
P. Meria
,
F. Desgrandchamps
,
A. Cortesse
,
P. Teillac
,
A. Le Duc
, and
S. Avrillier
,
“Laser-induced autofluorescence diagnosis of bladder tumors: dependence on the excitation wavelength,”
J. Urol. (Baltimore) , 156 1590
(1996). Google Scholar
F. Koenig
,
F. J. McGovern
,
A. F. Althausen
,
T. F. Deutsch
, and
K. T. Schomacker
,
“Laser-induced autofluorescence diagnosis of bladder cancer,”
J. Urol. (Baltimore) , 156 1597
(1996). Google Scholar
F. Koenig
,
F. J. McGovern
,
H. Enquist
,
R. Larne
,
T. F. Deutsch
, and
K. T. Schomacker
,
“Autofluorescence-guided biopsy for the early diagnosis of bladder carcinoma,”
J. Urol. (Baltimore) , 159 1871
(1998). Google Scholar
S. G. Demos
,
R. Gandour-Edwards
,
R. Ramsamooj
, and
R. deVere White
,
“Near-infrared autofluorescence imaging for detection of cancer ,”
J. Biomed. Opt. , 9
(3), 587
–592
(2004). Google Scholar
S. G. Demos
,
M. Staggs
, and
H. B. Radousky
,
“Endoscopic method for large-depth optical imaging of interior body organs,”
Electron. Lett. , 38 155
–157
(2002). Google Scholar
S. G. Demos
,
H. B. Radousky
, and
R. R. Alfano
,
“Deep subsurface imaging in tissues using spectral and polarization filtering,”
Opt. Express , 7 23
–28
(2000). Google Scholar
L. A. L. M. Kiemeney
,
J. A. Witjes
,
R. P. Heijbroek
,
F. M. J. Debruyne
, and
A. L. M. Verbeek
,
“Dysplasia in normal-looking urothelium increases the risk of tumour progression in primary superficial bladder cancer,”
Eur. J. Cancer , 30A 1621
(1994). Google Scholar
|
||||||||||||||