
|
|
1.IntroductionAutofluorescence spectroscopy is a noninvasive tool for the detection of alterations in the structural and chemical composition of cells, which may indicate the presence of pathologic tissue.1 2 3 4 Autofluorescence of tissues is produced by several endogenous fluorophores. These include fluorophores from tissue matrix molecules and intracellular molecules like collagen, elastin, keratin, and NADH. The presence of disease changes the concentration of these fluorophores as well as the light scattering and absorption properties of the tissue, due to changes in a.o. blood concentration, nuclear size distribution, epithelial thickness, and collagen content. It is therefore expected that the presence of disease will be identifiably reflected in autofluorescence spectral shape and intensity. Early detection of premalignant lesions and malignant tumors may reduce patient morbidity and mortality because treatment at a less invasive stage is more successful, and therefore is of great clinical importance.5 6 Unfortunately, (pre-)malignant lesions of the oral mucosa often go by unnoticed. In high-risk groups, premalignant and malignant lesions are often diagnosed in an advanced stage. Once the patient or dentist does observe a lesion, it is generally unclear whether the lesion is benign or (pre-)malignant. Current clinical diagnosis procedure therefore includes a biopsy. However, determining the optimal, i.e., most dysplastic, location for biopsy is difficult. This leads to repeated biopsies and to the risk of underdiagnosis, which delays the necessary treatment. Autofluorescence spectroscopy can be a useful tool for guiding the clinician to the most dysplastic location for biopsy. Autofluorescence spectroscopy is capable of distinguishing (pre-)malignant lesions from healthy mucosa in the oral cavity.7 8 9 10 11 12 In a previous pilot study for the staging of oral leukoplakia performed by our group we obtained a sensitivity of 86 and a specificity of 100 for distinguishing abnormal from normal tissue. However, the distinction between lesions in general and healthy oral mucosa is not relevant for the clinical question of staging visible lesions and finding the optimal location for biopsy, since the presence of a lesion is already established by its being noticed. Therefore, in this study we investigated the potential of autofluorescence spectroscopy for staging oral lesions in a large patient population. Our primary goal was to separate between benign lesions on the one hand and dysplastic and malignant lesions on the other hand, since this is one of the most relevant clinical questions. For this classification, we applied four different normalization approaches, including normalization by the spectrum recorded from the contralateral position of a lesion in the same patient. This normalization was aimed at correcting for interindividual variations in spectral properties of the mucosa that are irrelevant for our purpose. However, we cannot be certain that contralateral tissue in patients is normal. The influence of carcinogens like tobacco and alcohol can cause long-term damage of the oral mucosa (“condemned mucosa”), which can lead to “field cancerization.” 13 14 15 16 Furthermore, our pilot study showed that spectroscopic changes occur not only at the center and border of lesions, but also in the surroundings, where no abnormalities are visible.17 Also, Fryen et al.;18 found keratinization of the borders of tumors, enabling imaging detection of even small tumors. These findings suggest that the distinction between healthy and pathologic tissue within a patient is not always well defined.17 Therefore, we also applied three normalization methods that did not use the contralateral position spectrum. Other studies concerning in vivo autofluorescence spectroscopy in the oral cavity have predominantly been aimed at distinguishing cancerous lesions from healthy tissue, or distinguishing lesions of any type from healthy tissue.2 8 10 11 19 20 To enable a comparison of the results obtained using our methods with those achieved in the literature, we therefore addressed these questions as well. Besides for lesion classification, autofluorescence of oral mucosa is also potentially useful for the detection of still invisible tissue alterations. However, it is not possible to measure spectra of invisible lesions to test this hypothesis, since we clearly cannot know where these lesions are present. To scan the complete oral cavity using point spectroscopy is, for practical reasons, not feasible. Therefore, we used another approach to establish any spectroscopic evidence of lesion development. For this purpose, we assume that the process of lesion transformation can extend to the mucosa at other locations than the visible lesion. This assumption is again supported by our pilot study, in which we observed alterations in the autofluorescence characteristics of tissue surrounding lesions, even though the tissue looked healthy to the eye at the position of measurement.17 We compared autofluorescence spectra of mucosa surrounding or contralateral to a lesion with healthy oral mucosa spectra to test for any significant differences between different data subsets. 2.Materials and Methods2.1.Volunteer and Patient PopulationAutofluorescence spectra were collected from 96 healthy volunteers with no clinically observable lesions of the oral mucosa as described in our previous study, and from 155 patients with oral lesions after they had given their informed consent. The population included volunteers from the Department of Oral and Maxillofacial Surgery of the University Hospital of Groningen, as well as patients who had been referred to the same department because of an oral lesion. This study was approved by the Institutional Review Board of the University Hospital of Groningen. 2.2.ExperimentsBefore recording the spectra, volunteers were asked to complete a questionnaire concerning their smoking and drinking habits, most recently consumed food and beverage, and the use of any medication. This was done to track the causes of possible outliers during data analysis. A visual inspection of the oral cavity was performed by an experienced dental hygienist. In the volunteer group, this was done to ensure that no oral lesions were present at the time of measurement. In the patient group, the dental hygienist located and described the lesions to be measured. If present, the volunteers and patients were asked to remove their dentures. All patients and volunteers rinsed their mouth for 1 min with a 0.9 saline solution to minimize the influence of consumed food and beverages. The measurement setup (Fig. 1), as described in detail in our previous paper, consisted of a Xe lamp with monochromator for illumination, a spectrograph and a custom-made set of 460-nm long-pass and short-pass filters.21 Tissue excitation wavelengths were 365, 385, 405, 420, 435, and 450 nm (bandwidth⩽15 nm full width at half maximum). Using different filter sets for different excitation wavelengths would have extended the emission range, but unfortunately for practical reasons this was not possible. However, since the emission spectra of the important tissue fluorophores are very broad, we expected to collect at least part of the relevant information.2 22 The measurement probe was disinfected using 2 chlorhexidine digluconate in ethanol and covered with plastic film. The probe was placed in contact with the oral mucosa. The measurements were performed in a completely darkened room to prevent stray light from entering the spectrograph. In our patient group, we measured four positions for each lesion: the center of the lesion, the border, the surrounding tissue, and the supposedly healthy tissue at the contralateral position. The dental hygienist performed the measurements. For each measured location and excitation wavelength, three sequential measurements of 1-s integration time were recorded. This enabled us to remove occasional spectra containing extremely high values for discrete pixels due to electronic noise. On each measurement day, a set of calibration measurements was performed. In our previous study, in which we investigated the autofluorescence properties of 13 anatomical locations in the oral cavity, we concluded that oral mucosa can be divided into three categories with different spectroscopic characteristics.21 These comprise (1) the dorsal side of the tongue, (2) the vermilion border of the lip, and (3) a group of all other anatomical locations, which are interchangeable with regard to their autofluorescence characteristics. In this study, we performed all our data analysis within these three location groups separately. 2.3.Data ProcessingData preprocessing was performed as described in our previous study.21 Preprocessed spectra consisted of 199 data points, covering the 467- to 867-nm range. For our first approach, autofluorescence spectra measured at the center of lesions were divided by spectra recorded from the contralateral position. Since the high-wavelength region of spectra shows very low fluorescence intensity, dividing this part results in extremely noisy data. For this reason, only the 467- to 801-nm part of the divided spectra (=160 data points) was considered. 2.4.Principal Components Scores MulticomparisonPrincipal components analysis was applied to spectra recorded from the center and border positions of lesions, separately as well as combined. We compared the values of the first four principal component (PC) scores for spectra of lesions, divided into benign, dysplastic, and malignant lesions. This was done to get an impression of the spectral differences between different lesion types. We performed the nonparametric Kruskal-Wallis procedure for each excitation wavelength separately and for four different normalization types. These comprised normalization by the peak intensity, by the area under the spectrum, by the spectrum recorded from the contralateral position in the same patient, and nonnormalization. The Kruskal-Wallis procedure was chosen because of its reduced sensitivity to outliers and unbalanced data (=data with unequal sample sizes for the different groups). This reduced sensitivity occurs because the procedure performs an analysis of variance (ANOVA) on the ranks of the PC scores, rather than on their numeric values, as in a standard ANOVA. We performed a multicomparison on the Kruskal-Wallis results to test for any significant differences of mean PC scores between different pairs of lesion types (benign, dysplastic, malignant). If the mean PC scores are not significantly different for different lesion types, classification by means of the information contained in the PC scores is impossible. Note, however, that the existence of statistically significant differences alone does not imply separability of the data classes, since separability also requires small standard deviations in comparison to the difference between the mean values. 2.5.Classification of (Pre-)Malignant versus Benign LesionsFor the purpose of classification of benign versus (pre-)malignant lesions, we compared autofluorescence spectra recorded from the center of (pre-)malignant lesions on the one hand, with center measurements of benign lesions on the other hand. This was done without normalization, with normalization by the peak intensity, by the area under the spectrum, and by the spectrum recorded at the contralateral position in the same patient. For each normalization method, classification was attempted with principal components analysis (PCA), artificial neural networks (ANNs), and emission wavelength ratio’s as have been applied in the literature.4 8 9 12 19 23 24 25 26 27 28 29 All methods were performed on the basis of leave-one-out classification, to ensure that no overly positive results were obtained. We investigated all six excitation wavelengths. PCA classification was applied both with the first 10 and the first four PCs. We used the combination of PCA and linear classifier, which for traditional reasons we call the Karhunen-Loeve linear classifier (KLLC). This classifier is also known as the regularized linear classifier assuming normal distributions. Before applying other classifiers, first the PCA was performed. Then we applied the quadratic classifier assuming normal distributions (QNC) to the retrieved first 4 or 10 PCs. An ANN was applied using one hidden layer consisting of 10 neurons. For the red/green ratio techniques, we searched for ratios in the literature that could be applied to our emission wavelength range. We compared 635/(467 to 489), 640/500, 680/600, and 630/560 nm ratios.9 25 27 28 To make the methods more robust, we integrated spectral areas of approximately 4 nm width around the selected emission wavelengths. We calculated receiver operator characteristics (ROC) curve areas using leave-one-out (LOO) classification for all methods. In these curves, sensitivities for detection of lesions are plotted against corresponding values of 1 minus the specificity. The more accurately a method separates the data classes, the closer the corresponding ROC-AUC (ROC-area under the curve) approximates 1. We compared the areas under different ROC curves. This enabled us to make a fair judgment of the effectiveness of different methods without being constricted to single values of sensitivity and specificity, which largely depend on the threshold value chosen.30 Some of the calculations were repeated for the combined set of center and border measurements to investigate whether this affected the results. 2.6.Distinguishing Lesions from Healthy MucosaWe calculated ROC-curves to distinguish (1) cancerous lesions or (2) the complete set of lesions on the one hand from healthy tissue on the other hand. We used the four red/green ratio techniques as described above and the KLLC on the first 10 PC scores. We compared the center measurements of all lesions to the healthy oral mucosa data set, leaving out spectra recorded from the vermilion border of the lip and the dorsal side of the tongue for both groups. We evaluated areas under the ROC curve using LOO procedures for all excitation wavelengths. We repeated the calculations for border measurements and for the combined center and border measurements of lesions to see whether extending the dataset could improve the results. 2.7.Detection of Invisible Tissue AlterationsFor assessing the possibility of early lesion detection, we performed a multicomparison on the PC scores of spectra recorded from three groups of mucosa: healthy oral mucosa, tissue surrounding a lesion, and tissue contralateral to a lesion. Spectra were normalized by the area under the spectrum. We compared the means of the first four PC scores for each of the six excitation wavelength separately to test for any statistically significant differences (24 comparisons). This was done for six different data subsets. Again, we used the nonparametric Kruskal-Wallis procedure and performed multicomparisons on the outcomes. Based on the outcomes of these tests, we also calculated ROC-AUCs for classification using the KLLC on the first 10 PC scores. 3.Results3.1.General Description of the DataOur volunteer population was already described in our previous paper and consisted of 97 healthy volunteers21 (mean age 50, range 18 to 85, standard deviation 16 years). Our patient population consisted of 155 persons (mean age 57, range 20 to 91, standard deviation 13 years). Some patients suffered from multiple lesions, so that a total of 172 unique lesions could be measured. Several lesions were measured two or three times at different occasions for comparison, leading to a total of 199 lesion measurements sessions. Lesion characteristics are described in Table 1. Table 1
Of the 199 measurement sessions on lesions, 23 were left out of the analysis because they could not be staged satisfyingly, could not be located clinically, or had already been receiving therapy. These sessions were saved as additional test data. In 13 of the remaining 176 measurement sessions, the contralateral tissue of the lesions could not be measured for various reasons. For example, the lesion was present bilaterally, the lesion was large and centrally located, or the patient had abnormalities at the contralateral position that did not allow classification of the tissue as healthy. For our staging algorithm development approach using divided spectra, we substituted the spectra measured at the surrounding tissue for these cases if possible. For 2 of the 176 valid measurement sessions, the ratio spectra were not calculated at all because surrounding and contralateral tissue spectra both could not be measured, leaving 176 sessions for approach A and 174 sessions for approach B. The clinical staging of the lesions was based on clinical appearance in the case of obviously benign and therefore unbiopsied lesions, and on histology reports in the case of suspicious lesions. Of the 176 measurement sessions that were included in the data analysis, 20 were classified as squamous cell carcinomas, 1 turned out to be an adenocarcinoma, and 21 were dysplastic lesions (17 leukoplakia, 2 erythroplakia, 1 erosive leukoplakia, and 1 actinic keratosis). The remaining 134 lesions were classified as benign lesions. We performed our analysis in location group 3 only (=all anatomical locations besides the dorsal side of the tongue and the vermilion border of the lip), because the amount of dysplastic and malignant lesions in the other categories was too low to enable a reliable analysis. The measurement sessions of lesions at the vermilion border of the lip and the dorsal side of the tongue were saved as additional test data for the algorithms. 3.2.Autofluorescence Spectra CharacteristicsThe median fluorescence spectra for center and border measurements at healthy tissue, benign lesions, dysplastic lesions, and malignant tumors at excitation wavelength 405 nm are shown in Fig. 2. We chose to plot median instead of average spectra, since averaged spectra are more sensitive to outliers and can therefore be biased. It is clear from Fig. 2(a) that lesions produce less autofluorescence than healthy tissue. However, note that the spectra recorded from dysplastic lesions are in between those recorded from benign lesions and from healthy tissue. The normalized plot [Fig. 2(b)] shows that lesions and especially malignant tumors have relatively more fluorescence in the red spectral range. Again, note the mixing of benign and dysplastic lesions. Figure 2(a) Median autofluorescence spectra of lesions of the oral mucosa of different types, excitation wavelength 405 nm and (b) normalized spectra.  Figure 3 shows the 405-nm excitation median fluorescence spectra of center and border measurements of benign, dysplastic, and malignant lesions, normalized by spectra measured at the contralateral position in the same patients. Dysplastic and benign lesions again show similar median spectra. In Fig. 4, we have plotted example spectra recorded from a benign, a dysplastic, and a malignant lesion to illustrate that there is no general trend of fluorescence characteristics in relation to lesion type. All lesion types can show porphyrin-like peaks, not only malignant or dysplastic lesions. This peak is of the same shape as the one frequently observed in our healthy volunteer study, especially at the dorsal side of the tongue.21 For all three lesion types, in most cases, the center of a lesion shows less fluorescence intensity than the contralateral tissue recorded in the same patient. However, the percentage of cases in which the center of a lesion produces less total intensity than the contralateral tissue is only 67 for benign, 55 for dysplastic, and 72 for cancerous lesions, showing that this criterion is not useful for classification. Figure 3Median autofluorescence spectra of different lesion types in the oral cavity, excitation wavelength 405 nm, divided by spectra recorded from the contralateral position in the same patient. 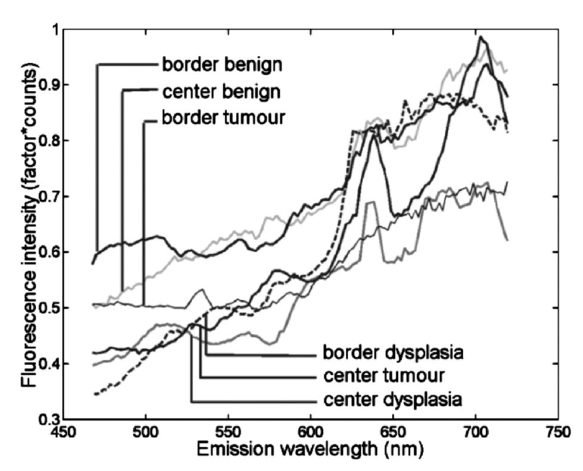 Figure 4Spectra of different lesion types in different patients at an excitation wavelength of 405 nm of (a) leukoplakia of the retromolar trigone (benign), (b) leukoplakia at the transition of tongue to floor of mouth (dysplastic), and (c) planocellular carcinoma of the mandibular fold (malignant).  3.3.Statistical Results3.3.1.Principal components scores multicomparisonPlots of the first four PCs for all center and border of lesions spectra after normalization by the area under the spectra are shown in Fig. 5 (405-nm excitation). Note that PC1 appears to correspond to the bulk autofluorescence, PC2 contains the porphyrin-like peak around 638 nm, while PC3 and PC4 contain a mixture of blood absorption and porphyrin-like fluorescence. The first four PCs accounted for >99 of the variance in the data. Figure 5First four PC loadings of spectra of center and border measurements of lesions that were included in the analysis with an excitation wavelength of 405 nm. Loadings are normalized to the area under the curve and centered around zero.  We observed that the differences between tumors and benign lesions, as well as between tumors and dysplastic lesions, were more prominent than those between dysplastic and benign lesions (i.e., a higher percentage of the 24 PC scores comparisons yielded significant differences, Table 2). The results look similar for all excitation wavelengths considered, however, 365-nm excitation tends to yield somewhat more differences between lesion groups. The normalization method that exposed the most differences was normalization by the area under the curve. Table 2
The diversity in the group of benign lesions can possibly reduce the amount of significant differences that are found between benign and (pre-)malignant lesions by creating more spectral variation. We therefore selected only those benign lesions that were clinically suspicious for dysplasia and/or malignancy (leukoplakia, lichen planus, candida, ulcus, erythroplakia, and actinic keratosis) and applied PCA for the classification of dysplastic and malignant versus benign lesions again. This approach did not improve the results. The results must be interpreted carefully, because reduction of the data set on itself makes the appearance of statistically significant difference less probable. 3.3.2.Classification of (pre-)malignant versus benign lesionsIn general, an area under the ROC curve close to 0.5 indicates that the method used has failed and is as effective as random classification. An area >0.9 indicates excellent classification, corresponding to excellent separability of the two classes. The results for ANN, PCA, KLLC, and QNC for distinguishing (pre-)malignant from benign lesions all turned out to be bad (area<0.65). Including the spectra recorded at the borders of lesions did not improve the results, nor did the use of border spectra exclusively. Selecting only those benign lesions that were clinically suspicious for dysplasia or SCC, as described before, still gave areas under the ROC<0.65. Distinguishing between benign and dysplastic lesions was not successful either (areas<0.65). We applied the KLLC classifier on the first 10 PCs for spectra that had been divided by spectra recorded from the contralateral position. This resulted in ROC curve areas of approximately 0.5 for all excitation wavelengths, meaning that classification of dysplastic versus benign lesions failed. For the distinction between benign and malignant lesions, i.e., excluding dysplastic lesions from the analysis, areas were higher (0.59 to 0.75). This implies, in agreement with the PC scores multicomparison results, that the difficulties are caused by the problems in distinguishing dysplastic from benign lesions and not so much by distinguishing benign from cancerous lesions. In fact, the distinction between dysplastic and malignant lesions could more successfully be made than that between benign and dysplastic lesions (areas under the ROC curve 0.67 to 0.82 for KLLC on the first 10 PCs, depending on the excitation wavelength). 3.3.3.Distinguishing lesions from healthy tissueThe results for distinguishing all lesions or cancerous lesions only from healthy oral tissue are shown in Table 3. Classification was most successful for distinguishing cancerous from healthy tissue (ROC-AUC: mean 0.93±0.03 for all excitation wavelengths and methods, except ANN). The maximum value of ROC-AUC was 0.97, occurring for ratios 1 and 2 and the combined ratios for several excitation wavelengths between 405 and 435 nm. The ROC-AUC for the separation of combined lesions (suspicious benign, dysplastic, and malignant) from healthy oral mucosa was lower than for the separation of cancerous lesions from healthy mucosa, but still was high (mean value+standard deviation ROC-AUC: 0.81±0.03 for all excitation wavelengths and methods, except ANN). The maximum ROC-AUC was 0.88 at 365 nm excitation using KLLC on PC scores. The addition of measurements recorded from the border of the lesion did not improve the results, nor did the use of border spectra exclusively. This suggests that autofluorescence characteristics recorded from the center of lesions contain the most information about tissue type. This contradicts the results of our pilot study, in which the border of lesions seemed to contain the most information. However, this study is based on a larger patient population and therefore more reliable. Table 3
3.3.4.Detection of invisible tissue alterationsMulticomparison of the first four PC scores for the surroundings and contralateral sites of benign, dysplastic, and malignant lesions showed some significant differences in mean values for different PC scores. These results are not shown in a table. For benign versus malignant lesions, 54 of the 24 PC scores (six excitation wavelengths, four PCs) were significantly different. For dysplastic versus malignant lesions, this number was reduced to 25, and for benign versus dysplastic lesions only 4 of PC scores were significantly different. A multicomparison of spectra with randomly attached labels of benign, dysplastic, and malignant returned no statistically significant differences at all. This makes us confident that the calculated significant differences for PC scores between different lesion types are not a statistical artifact but truly are the consequence of different spectroscopic properties. However, the causes of these differences remain speculative because biopsy-proven histologic data were not available from these apparently healthy locations. To further investigate the differences, we repeated the calculations for spectra recorded either at the surroundings of lesions or at the contralateral position, separately. For surrounding positions, no differences for the three lesion types were observed at all. For the contralateral measurements, we found 46 differences between benign and malignant and 29 between dysplastic and malignant lesions. This suggests that, to our surprise, contralateral tissue is more influenced by lesion type than surrounding tissue is. Possibly, the observed differences in PC scores are caused by field cancerization or tobacco smoking habits, which are correlated to lesion type. The tissue surrounding lesions might demonstrate some lesion-related effects, like slight inflammation, that overshadow the effects of field cancerization and smoking habits. This might explain why benign and (pre-)malignant lesions show more differences within the contralateral than within the surrounding data subset. A PC scores multicomparison between surroundings and contralateral spectra of lesions (all types grouped or separately), showed no significant differences between these locations. However, this still does not rule out the possibility of lesion-related effects overshadowing the differences caused by field cancerization. The standard deviations of PC scores within lesion type groups can be larger than a possible difference between surroundings and contralateral tissues. For our sample size, this would make it improbable to detect significant differences even if they exist in the general population. To further investigate the underlying causes for the observed significant differences, we expanded the PC scores analysis data set with spectra from the healthy volunteer reference database. Spectra recorded from the dorsal side of tongue and at the vermilion border of the lip again were excluded. Note that the expansion of the data set leads to the extraction of different principal components loadings. These are now mainly determined by the—much larger—set of healthy mucosa spectra. The results are summarized in Table 4. The combination of healthy reference database spectra with spectra recorded from the surroundings and contralateral position of lesions, yields more significant differences in PC scores between the subsets. This is probably caused by the larger amount of data available, which makes the appearance of any differences that exist in the general population more probable. Again, differences are more prominent in the subset containing contralateral measurements than in the subset with spectra recorded from the surroundings of lesions. This might be explained by the spectral effects of field cancerization or smoking habits, as explained before. Table 4
After obtaining these results, we were curious about the possibility to classify lesions by means of autofluorescence spectra recorded at the surroundings and contralateral position. We therefore applied the linear classifier using 10 PCs to separate (pre-)malignant from benign lesions. Areas under the ROC curves were between 0.50 and 0.72 for the combined set, meaning that classification was useless. Distinguishing malignant from benign lesions gave comparable results. The distinction between malignant and dysplastic lesions could more successfully be made (surroundings, 0.52 to 0.67; contralateral, 0.67 to 0.85; combined, 0.65 to 0.75). Again, the contralateral data set performed best. We added the healthy oral mucosa reference database and attempted classification of benign and healthy oral mucosa versus dysplastic and malignant mucosa. ROC-AUCs were 0.62 to 0.82, best results were obtained for the contralateral dataset. Distinguishing all lesions from healthy mucosa by means of their surrounding and/or contralaterally recorded spectra resulted in ROC-AUCs of 0.59 to 0.73. We can conclude that classification of lesion type by means of surrounding and contralateral tissue spectra was not possible. However, the results imply that some information on tissue type is contained at the clinically healthy contralateral tissue. 4.DiscussionWe were well able to distinguish lesions in general from healthy tissue (maximum ROC-AUC=0.88 using KLLC and PCA) and achieved excellent results in distinguishing cancerous tumors from healthy tissue (maximum ROC-AUC=0.97 using ratios). The results were not influenced noticeably by the choice of excitation wavelength. Concatenation of spectra recorded at different excitation wavelengths, as has been suggested in the literature, did not improve the results.10 The best results were obtained when spectra were normalized by the AUC. Center measurements contained the most relevant information. Normalization by the spectrum recorded at the contralateral position revealed the fewest significant differences between lesion types. To our surprise, this contradicts the results found in our pilot study by Van Staveren et al.;17 Our results for distinguishing lesions from healthy oral mucosa, as well as for distinguishing cancer from healthy mucosa, were comparable with results found in the literature. Majumder et al.;11 achieved 86 sensitivity, 63 specificity for distinguishing oral cancer from healthy mucosa, while Wang et al.;12 achieved a sensitivity of 81 and a specificity of 94 for the same problem. Gillenwater et al.;9 established a 94 sensitivity, 100 specificity for distinguishing abnormal from normal oral mucosa, while Mu¨ller et al.;20 found a 96 sensitivity, 96 specificity for the same question when using a combination of autofluorescence and diffuse reflectance measurements. Contrary to our success in distinguishing all lesions or cancerous lesions from healthy oral mucosa, the relevant clinical question could not be answered. We were not able to separate benign from (pre-)malignant lesions using our methods (area under the ROC curve <0.65 for all methods). In our opinion, this is due largely to the fact that the oral cavity is more complex than other organs, in which autofluorescence spectroscopy for the staging of lesions has been applied more successfully using comparable excitation wavelengths.2 25 31 32 33 34 The reasons for this complexity can be as follows. In general, tumors as well as benign and dysplastic lesions can be of various degrees of keratinization, hyperplasia, and blood content. All these factors influence the shape and intensity of autofluorescence spectra, and since they show large variance within each lesion category, a mixing of categories by means of autofluorescence spectroscopy classification can easily result. In the oral cavity, there could be more difficulties than in other organs, because the different oral tissue types may show different reactions to disease. However, we would need large numbers of lesions for each anatomical location to test this hypothesis. The mixing of different lesion types for our dataset can be observed in Fig. 2, in which median spectra from benign and dysplastic lesions are intertwined for normalized as well as for nonnormalized autofluorescence spectra. In contrast with our findings, Wang et al.; established a sensitivity of 81 and a specificity of 96 for distinguishing “premalignant and malignant” lesions from “benign” lesions in the oral cavity by means of autofluorescence spectroscopy.35 Spectra were recorded under 330-nm excitation and classified using a partial least-squares and artificial neural network (PLS-ANN) classification algorithm. The divergence of our mutual results can potentially be explained by the choice of excitation wavelength, since a lower excitation wavelength may lead to excitation of different fluorophores. However, we expect to collect at least part of the fluorescence from the important tissue fluorophores as well, since they show broad absorption and emission spectra. The use of different multivariate analytic methods is probably not the cause for the divergence in results either, since we applied many different methods, which did not improve the results. Also, the methods used are quite similar in concept. We therefore think that the discrepancy in results is probably caused by the different patient populations. All lesions measured by Wang et al.; were located at the oral buccal mucosa, and all were induced by areca quid chewing and smoking habits. Their lesion set thus was much more homogeneous, which may facilitate the classification. In contrast with our results as well, Heintzelman et al.; achieved 90 sensitivity and 88 specificity for distinguishing dysplastic and cancerous tissue from benign and healthy oral mucosa in a training set, and 100 sensitivity with 98 specificity in their validation set using three excitation wavelengths.10 These results cannot be compared to ours because a different classification was performed. If the number of benign lesions is relatively low, effectively the more successful lesion/healthy classification has been made. The results for the training set for this question are comparable to ours. Sensitivity and specificity for the validation set are higher than we found, which might be explained by the data distribution (277 normal sites, 2 dysplastic, and 2 cancerous sites) or the combination of excitation wavelengths used. Diagnostic algorithms based on the presence of a porphyrin-like peak around the 638-nm emission wavelength have been applied successfully in the literature.9 36 It seems generally accepted that this peak is caused by endogenous porphyrin production. This may be either by cells of the body, or by microorganisms. In our previous study, we have shown that rubbing the tongue could diminish the height of the porphyrin-like peak by 30 to 40, suggesting that at least part of the porphyrins are located outside of the tissue. We have not tried to diminish porphyrin-like peaks by rubbing lesions because of practical drawbacks. In our study we saw porphyrin-like peaks appearing in benign lesions (32), dysplastic lesions (19), malignant lesions (73), and even occasionally in healthy oral mucosa.21 Therefore, ratio 2 [=635/(455 to 490) nm] was not successful in distinguishing benign lesions from dysplastic and malignant lesions in our patient population. The high occurrence rate of 638-nm fluorescence of tumors in combination with the reduced total fluorescence intensity explain why the less relevant distinction between malignant and healthy tissue could successfully be made using ratio 2. We observed statistically significant differences between PC scores of surrounding and contralateral mucosa of benign lesions, on the one hand, and of dysplastic and malignant lesions, on the other hand. This is surprising, because the differences between center and border measurements of lesions of both groups were not even pronounced enough to allow for a reliable classification. However, we must remember that statistically significant differences between means of groups do not imply separability of the classes. Furthermore, it is possible that the differences found for surrounding and contralateral tissues are not a result of an invisible effect of the lesion itself, but merely a symptom of field cancerization. In fact, this is very probable when considering the fact that contralateral tissue showed more significant differences between benign, dysplastic, and malignant lesions than surrounding tissue did. However, all conclusions remain speculative because biopsy-proven histologic data of the surroundings and contralateral positions were not available. Applying autofluorescence imaging may expand our knowledge of this subject, and may be useful—if not for lesion staging, then still for lesion detection. This is especially helpful for follow-up inspection in patients at high risk for developing oral cancer. To potentially improve our diagnostic accuracy for lesion staging, we will include diffuse reflectance spectra in our future analysis. These spectra are sensitive to scattering and absorption properties of the tissue, and therefore indirectly to the degree of keratinization and the amount of blood, respectively. Incorporating reflectance spectra into the classification algorithms may reduce the influence of variations in blood content and keratinization and thus the amount of information that is nonspecific for malignant transformation. Performance can possibly be improved by including other optical diagnostical methods. AcknowledgmentsThis work was supported by the Dutch Cancer Society (“Nederlandse Kanker Bestrijding”) Grant No. RUG-99-1869, and the Dutch Technology Foundation (“STW”) Grant No. RRN 5316. We are grateful to all volunteers and patients for their valuable contribution and to Mirjam Wouda, Ire`nke de Jong-Orosz, and Ada Schokkenbroek for performing the many measurements. REFERENCES
M. A. D’Hallewin
,
L. Baert
, and
H. Vanherzeele
,
“In vivo fluorescence detection of human bladder carcinoma without sensitizing agents,”
J. Am. Paraplegia Soc. , 17 161
–164
(1994). Google Scholar
I. Georgakoudi
,
E. E. Sheets
,
M. G. Muller
,
V. Backman
,
C. P. Crum
,
K. Badizadegan
,
R. R. Dasari
, and
M. S. Feld
,
“Trimodal spectroscopy for the detection and characterization of cervical precancers in vivo,”
Am. J. Obstet. Gynecol. , 186 374
–382
(2002). Google Scholar
A. Gillenwater
,
R. Jacob
, and
R. Richards-Kortum
,
“Fluorescence spectroscopy: a technique with potential to improve the early detection of aerodigestive tract neoplasia,”
Head Neck , 20 556
–562
(1998). Google Scholar
M. Zellweger
,
P. Grosjean
,
D. Goujon
,
P. Monnier
,
B. H. van den
, and
G. Wagnieres
,
“In vivo autofluorescence spectroscopy of human bronchial tissue to optimize the detection and imaging of early cancers,”
J. Biomed. Opt. , 6 41
–51
(2001). Google Scholar
N. Hyde
and
C. Hopper
,
“Oral cancer: the importance of early referral,”
Practitioner , 243
(753), 756
–761
(1999). Google Scholar
S. Silverman
,
“Early diagnosis of oral cancer,”
Cancer , 62 1796
–1799
(1988). Google Scholar
C. S. Betz
,
M. Mehlmann
,
K. Rick
,
H. Stepp
,
G. Grevers
,
R. Baumgartner
, and
A. Leunig
,
“Autofluorescence imaging and spectroscopy of normal and malignant mucosa in patients with head and neck cancer,”
Lasers Surg. Med. , 25 323
–334
(1999). Google Scholar
C. T. Chen
,
C. Y. Wang
,
Y. S. Kuo
,
H. H. Chiang
,
S. N. Chow
,
I. Y. Hsiao
, and
C. P. Chiang
,
“Light-induced fluorescence spectroscopy: a potential diagnostic tool for oral neoplasia,”
Proc. Natl. Sci. Counc Repub China B , 20 123
–130
(1996). Google Scholar
A. Gillenwater
,
R. Jacob
,
R. Ganeshappa
,
B. Kemp
,
A. K. El Naggar
,
J. L. Palmer
,
G. Clayman
,
M. F. Mitchell
, and
R. Richards-Kortum
,
“Noninvasive diagnosis of oral neoplasia based on fluorescence spectroscopy and native tissue autofluorescence,”
Arch. Otolaryngol. Head Neck Surg. , 124 1251
–1258
(1998). Google Scholar
D. L. Heintzelman
,
U. Utzinger
,
H. Fuchs
,
A. Zuluaga
,
K. Gossage
,
A. M. Gillenwater
,
R. Jacob
,
B. Kemp
, and
R. R. Richards-Kortum
,
“Optimal excitation wavelengths for in vivo detection of oral neoplasia using fluorescence spectroscopy,”
Photochem. Photobiol. , 72 103
–113
(2000). Google Scholar
S. K. Majumder
,
S. K. Mohanty
,
N. Ghosh
,
P. K. Gupta
,
D. K. Jain
, and
F. Khan
,
“A pilot study on the use of autofluorescence spectroscopy for diagnosis of the cancer of human oral cavity,”
Curr. Sci. , 79 1089
–1094
(2000). Google Scholar
C. Y. Wang
,
H. K. Chiang
,
C. T. Chen
,
C. P. Chiang
,
Y. S. Kuo
, and
S. N. Chow
,
“Diagnosis of oral cancer by light-induced autofluorescence spectroscopy using double excitation wavelengths,”
Oral Oncol. , 35 144
–150
(1999). Google Scholar
W. N. Hittelman
,
N. Voravud
,
D. M. Shin
,
J. S. Lee
,
J. Y. Ro
, and
W. K. Hong
,
“Early genetic changes during upper aerodigestive tract tumorigenesis,”
J. Cell. Biochem. , 17 233
–236
(1993). Google Scholar
V. M. Kotelnikov
,
J. S. Coon
,
S. Taylor
,
J. Hutchinson
,
W. Panje
,
D. D. Caldareill
,
S. LaFollette
, and
H. D. Preisler
,
“Proliferation of epithelia of noninvolved mucosa in patients with head and neck cancer,”
Head Neck , 18 522
–528
(1996). Google Scholar
M. S. Strong
,
J. Incze
, and
C. W. Vaughan
,
“Field cancerization in the aerodigestive tract—its etiology, manifestation, and significance,”
J. Otolaryngol. , 13 1
–6
(1984). Google Scholar
P. J. Thomson
,
“Field change and oral cancer: new evidence for widespread carcinogenesis?,”
Int. J. Oral Maxillofac Surg. , 31 262
–266
(2002). Google Scholar
H. J. van Staveren
,
R. L. van Veen
,
O. C. Speelman
,
M. J. Witjes
,
W. M. Star
, and
J. L. Roodenburg
,
“Classification of clinical autofluorescence spectra of oral leukoplakia using an artificial neural network: a pilot study,”
Oral Oncol. , 36 286
–293
(2000). Google Scholar
A. Fryen
,
H. Glanz
,
W. Lohmann
,
T. Dreyer
, and
R. M. Bohle
,
“Significance of autofluorescence for the optical demarcation of field cancerisation in the upper aerodigestive tract,”
Acta Otolaryngol. Stockh. , 117 316
–319
(1997). Google Scholar
V. R. Kolli
,
H. E. Savage
,
T. J. Yao
, and
S. P. Schantz
,
“Native cellular fluorescence of neoplastic upper aerodigestive mucosa,”
Arch. Otolaryngol. Head Neck Surg. , 121 1287
–1292
(1995). Google Scholar
M. G. Muller
,
T. A. Valdez
,
I. Georgakoudi
,
V. Backman
,
C. Fuentes
,
S. Kabani
,
N. Laver
,
Z. Wang
,
C. W. Boone
,
R. R. Dasari
,
S. M. Shapshay
, and
M. S. Feld
,
“Spectroscopic detection and evaluation of morphologic and biochemical changes in early human oral carcinoma,”
Cancer , 97 1681
–1692
(2003). Google Scholar
D. C. De Veld
,
M. Skurichina
,
M. J. Witjes
,
R. P. Duin
,
D. J. Sterenborg
,
W. M. Star
, and
J. L. Roodenburg
,
“Autofluorescence characteristics of healthy oral mucosa at different anatomical sites,”
Lasers Surg. Med. , 32 367
–376
(2003). Google Scholar
R. Drezek
,
K. Sokolov
,
U. Utzinger
,
I. Boiko
,
A. Malpica
,
M. Follen
, and
R. Richards-Kortum
,
“Understanding the contributions of NADH and collagen to cervical tissue fluorescence spectra: Modeling, measurements, and implications,”
J. Biomed. Opt. , 6 385
–396
(2001). Google Scholar
M. Anidjar
,
D. Ettori
,
O. Cussenot
,
P. Meria
,
F. Desgrandchamps
,
A. Cortesse
,
P. Teillac
,
A. Le Duc
, and
S. Avrillier
,
“Laser induced autofluorescence diagnosis of bladder tumors: dependence on the excitation wavelength,”
J. Urol. (Baltimore) , 156 1590
–1596
(1996). Google Scholar
M. Brewer
,
U. Utzinger
,
E. Silva
,
D. Gershenson
,
R. C. Bast, Jr.
,
M. Follen
, and
R. Richards-Kortum
,
“Fluorescence spectroscopy for in vivo characterization of ovarian tissue,”
Lasers Surg. Med. , 29 128
–135
(2001). Google Scholar
R. M. Cothren
,
M. V. Sivak, Jr.
,
J. Van Dam
,
R. E. Petras
,
M. Fitzmaurice
,
J. M. Crawford
,
J. Wu
,
J. F. Brennan
,
R. P. Rava
,
R. Manoharan
, and
M. S. Feld
,
“Detection of dysplasia at colonoscopy using laser-induced fluorescence: a blinded study,”
Gastrointest Endosc , 44 168
–176
(1996). Google Scholar
F. Koenig
,
F. J. McGovern
,
H. Enquist
,
R. Larne
,
T. F. Deutsch
, and
K. T. Schomacker
,
“Autofluorescence guided biopsy for the early diagnosis of bladder carcinoma,”
J. Urol. (Baltimore) , 159 1871
–1875
(1998). Google Scholar
I. Pathak
,
N. L. Davis
,
Y. N. Hsiang
,
N. F. Quenville
, and
B. Palcic
,
“Detection of squamous neoplasia by fluorescence imaging comparing porfimer sodium fluorescence to tissue autofluorescence in the hamster cheek-pouch model,”
Am. J. Surg. , 170 423
–426
(1995). Google Scholar
J. Y. Qu
,
P. Wing
,
Z. Huang
,
D. Kwong
,
J. Sham
,
S. L. Lee
,
W. K. Ho
, and
W. I. Wei
,
“Preliminary study of in vivo autofluorescence of nasopharyngeal carcinoma and normal tissue,”
Lasers Surg. Med. , 26 432
–440
(2000). Google Scholar
H. E. Savage
,
V. Kolli
,
J. Ansley
,
R. Y. Chandawarkar
,
R. R. Alfano
, and
S. P. Schantz
,
“Innate tissue fluorescence of the oral mucosa of controls and head and neck cancer patients,” in Advances in Laser and Light Spectroscopy to Diagnose Cancer and Other Diseases II, R. R. Alfano, Ed.,”
Proc. SPIE , 2387 2
–14
(1995). Google Scholar
C. E. Metz
,
“Basic principles of ROC analysis,”
Semin Nucl. Med. , 8 283
–298
(1978). Google Scholar
B. Mayinger
,
M. Jordan
,
P. Horner
,
C. Gerlach
,
S. Muehldorfer
,
B. R. Bittorf
,
K. E. Matzel
,
W. Hohenberger
,
E. G. Hahn
, and
K. Guenther
,
“Endoscopic light-induced autofluorescence spectroscopy for the diagnosis of colorectal cancer and adenoma,”
J. Photochem. Photobiol., B , 70 13
–20
(2003). Google Scholar
R. J. Nordstrom
,
L. Burke
,
J. M. Niloff
, and
J. F. Myrtle
,
“Identification of cervical intraepithelial neoplasia (CIN) using UV-excited fluorescence and diffuse-reflectance tissue spectroscopy,”
Lasers Surg. Med. , 29 118
–127
(2001). Google Scholar
M. Panjehpour
,
B. F. Overholt
,
T. Vo-Dinh
,
R. C. Haggitt
,
D. H. Edwards
, and
F. P. Buckley III
,
“Endoscopic fluorescence detection of high-grade dysplasia in Barrett’s esophagus,”
Gastroenterology , 111 93
–101
(1996). Google Scholar
N. Ramanujam
,
M. F. Mitchell
,
A. Mahadevan
,
S. Thomsen
,
A. Malpica
,
T. Wright
,
N. Atkinson
, and
R. Richards-Kortum
,
“Spectroscopic diagnosis of cervical intraepithelial neoplasia (CIN) in vivo using laser-induced fluorescence spectra at multiple excitation wavelengths,”
Lasers Surg. Med. , 19 63
–74
(1996). Google Scholar
C. Y. Wang
,
T. Tsai
,
H. M. Chen
,
C. T. Chen
, and
C. P. Chiang
,
“PLS-ANN based classification model for oral submucous fibrosis and oral carcinogenesis,”
Lasers Surg. Med. , 32 318
–326
(2003). Google Scholar
D. R. Ingrams
,
J. K. Dhingra
,
K. Roy
,
D. F. Perrault, Jr.
,
I. D. Bottrill
,
S. Kabani
,
E. E. Rebeiz
,
M. M. Pankratov
,
S. M. Shapshay
,
R. Manoharan
,
I. Itzkan
, and
M. S. Feld
,
“Autofluorescence characteristics of oral mucosa,”
Head Neck , 19 27
–32
(1997). Google Scholar
NotesAddress all correspondence to Henricus J. C. M. Sterenborg. University Hospital Rotterdam, Department of Radiation Oncology, Photodynamic Therapy & Optical Spectroscopy Program, P.O. Box 2040, 3000 CA Rotterdam, The Netherlands. Tel: 31 10 4632100; Fax: 31 10 4632141; E-mail: h.j.c.m.sterenborg@erasmusmc.hl |
|||||||||||||||||||||||||||||||||||||||||||||||||||||||||||||||||||||||||||||||||||||||||||||||||||||||||||||||||||||||||||||||||||||||||||||||||||||||||||||||||||||||||||||||||||||||||||||||||||||||||||||||||||||||||||||||||||||||||||||||||||||||||||||||||||||||||||||||||||||||||||||||||||||||||||||||||||||||||||||||||||||||||||||||||||||||||||||||||||


