|
|
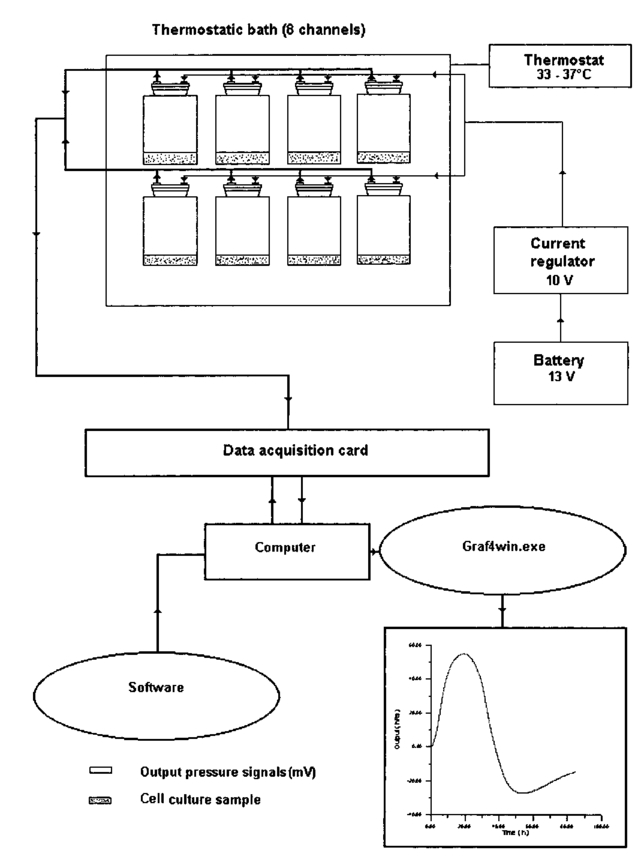
1.IntroductionA pressure monitoring system, based on differential pressure sensors, was designed to detect contaminant effects on the metabolic activity of cell cultures (thus moving in the field of environmental toxicology), as well as the possible effects of an electromagnetic field1 2 3 4 5 6 7 8 9 10 11 12 13 14 15 (that have long been the object of scientific debate). It is an evolution of Hayduck’s low-scale manometers and satisfies the necessity of a fast and noninvasive metabolism monitoring technique.16 Cell number reductions or metabolic alterations that derive from contaminants of a chemical or physical nature can be traced by variations in cell cultures capability to produce CO 2. Moreover, this technique can be easily complemented by other effective diagnostic techniques such as mass spectrometry for the vessel atmosphere and Fourier transform IR (FTIR) spectroscopy both for atmosphere (gas phase) and cell suspending medium (liquid phase). Our investigation method gives the overall picture of behavior of a cellular culture by measuring pressure variations in a test tube; the pressure changes because cells produce CO 2 by glucose consumption. The experimental setup is shown in Fig. 1. Measures are obtained strictly by differential pressure sensors connected to closed sample tubes; pressure data are acquired by an acquisition board connected to a computer and give a standard curve (pressure variation versus time), typical of the cellular line, connected to cellular metabolism. The curve is characterized by different phases: an initial growth up to a maximum, followed by a decrement that leads to a typical “depression.” This is a novel result that was presented and discussed in detail in Refs. 17 and 18. Experiments are carried out with test tubes in thermostatic baths so that samples temperature is maintained constant and in presence of suspension medium control vessels to give constant monitoring of pressure baseline. The differential pressure monitoring technique was been performed on different cell types: Saccharomyces cerevisiae, lymphocytes, and AHH1 culture samples. We used S. cerevisiae both because this unicellular eucariote is a good and cheap model for complex biological problems and because yeast is the most important microbial group scientifically and commercially used. Lymphocytes are a common cellular model because they are well-characterized cells as far as culture conditions and growth factor requirements are concerned. They are relatively easy to obtain in an amount sufficient to run complex experiments and can easily undergo purification. A lymphocyte is usually obtained as a resting cell from peripheral blood, but it can be induced to enter the cell cycle, thus mimicking a naturally occurring activation process. Moreover the lymphocyte is suitable to study receptor-ligand interactions and ion fluxes across the cellular membrane: phenomena affected by (electromagnetic field) (EMF) effects. AHH1 cells, B-lymphocytes immortalized by Epstein Barr virus, were used to detect EMF effects on virus activity. Saccharomyces cerevisiae cell samples were used both to test pressure monitoring technique and detect the effect of physical (UV, blue light, magnetic fields) or chemicals (Amuchina®, trieline) contaminants, while lymphocytes and AHH1 samples were used to analyze both the growth and the metabolic responses under 50-Hz, 60-μT magnetic field exposure. The pressure monitoring technique can be completed with nuclear magnetic resonance (NMR) and near-IR analyses, which are useful to detect variation in culture medium composition. Possible effects of EMF interactions, and in particular human exposition effects to extremely low frequency magnetic fields (ELF-EMFs), generated by electricity distribution and use, is a subject of public interest. Many studies, both in vivo and in vitro, have been conducted to detect possible effects of EMF exposure on human health,1 2 3 4 5 6 7 8 9 10 11 12 13 14 even though the results obtained have often shown contradictions, difficulties of interpretation, and low reproducibility.15 2.Materials and Methods2.1.Saccharomyces Cerevisiae2.1.1.UV radiationWe resuspended 80 mg of dehydrated S. cerevisiae yeast cells (Aboca) in 40 ml of deionized water. To minimize the formation of cell clusters, the cell suspension was aspirated with insulin needles into sterile syringe for 10 times 2 ml of 0.2 S. cerevisiae cell suspension have been transferred in a Petri dish: cells, disposed in a monolayer, were irradiated with an UV light lamp for 2 to 12 min. Samples were placed at a distance of 55 cm from the center of the lamp. During irradiation, the experimental environment is characterized by absolute darkness. Yeast cells were then resuspended in 2 α D glucose solution obtaining 4 ml of 0.1 yeast culture that has been used for metabolic tests. The S. cerevisiae control samples were transferred in Petri dishes and resuspended in 4 ml 2 α D glucose solution as irradiated samples, but were kept in darkness for the same time used to irradiate samples. 2.1.2.Blue lightSaccharomyces cerevisiae samples were irradiated following the same method used for UV irradiation. 2.1.3.Magnetic fieldThe 0.2 S. cerevisiae yeast cell suspension was divided in two subcultures: the former has been exposed to a magnetic field (50 Hz, 60 μT, in which coils were divided by a distance equal to their diameter) for 72 h, while the latter, the control culture, was not irradiated. After irradiation, 4 ml of each culture, collected in vessels and resuspended in 2 α D glucose minimum medium, were used for metabolic measurements in sealed bottles connected to a differential pressure digital sensor system. 2.2.LymphocytesWe obtained 12 ml of peripheral blood from healthy volunteers and collected it in heparinated tubes. Mononuclear cells were isolated by Histopaque-1077 (Sigma Diagnostic, Milan, Italy) and resuspended in 2 tissue culture flasks (irradiated and control) using 10 ml of RPMI 1640 medium with 15 fetal bovine serum (HyClone, Logan, Utah, USA), glutammine 1 and penicillin 1. An aliquot of 400 μl for each flask was counted, using both a Burker camera and a Coulter STKS, and cell numbers per microliter was recorded. Then both suspensions was incubated in a 5 CO 2 incubator at 37 °C and the irradiated culture was exposed to EMF. The irradiation system was maintained in the incubator. After 72 h, both control and irradiated cell cultures were counted as previously described. We used 4 ml of cell suspensions (irradiated and control), with replicas, for metabolic measurements in sealed bottles connected to a differential pressure sensor digital system. Cell number per microliter in the control and irradiated samples was determined at the end of metabolic test to check for culture growth. Control and irradiated lymphocyte growth, during both irradiation and metabolic test, were compared to data obtained in previous experiments16 17 18 in which control and irradiated samples had been cultured in a PHA medium (0.6 ml). 2.3.AHH1 Cellular LineAHH1 cells, B-lymphocytes immortalized by Epstein Barr virus, have been described as linfoblastoid and characterized by a large cytoplasm necessary to sustain an intense trascriptional activity.19 20 21 22 23 AHH1 cells are characterized by a cell division cycle of 20 to 30 h and, in culture, make clusters, but do not stick to the flask’s plastic walls. The virus genome, formed by a great number of episomes (up to some hundreds), remain in a latent form. Magnetic field exposures of Epstein Barr immortalized cell lines have been studied to detect a possible increase of the litic form as consequence of irradiation effects.24 Possible cells number reduction can be detected both by differences in control and irradiated AHH1 samples growth percentages and with metabolic tests. AHH1 cultures have been prepared starting from frozen samples containing 5×10⁶ cells in a culture medium made of RPMI 1640, fetal bovine serum 10, glutammine 1, and DMSO 10. Defrosted AHH1 cells were used to prepare maintenance cell cultures with a cellular concentration of 300 cells/μl kept into a 5 CO 2 incubator at 37 °C. The exhausted culture medium was replaced every 48 h. A cell culture sample was transferred in a new flask containing 5 ml of fresh culture medium (made of RPMI 10, fetal bovine serum 10, glutammine 1) maintaining a cell concentration of 300 cells/μl. AHH1 culture samples, coming from the same maintenance culture, were used to prepare two subcultures (200 cells/μl): the former was exposed to a magnetic field (2r, 50 Hz, 60 μT) for 72 h, while the latter, the control culture, was not irradiated. After 72 h, an aliquot of 400 μl for each flask was counted, using both a Burker camera and a Coulter STKS, and cell numbers per microleter was registered. We used 4 ml of cell suspensions (irradiated and control) for metabolic tests. 2.3.1.Magnetic field sourcesThe exposure system consists in a pair of coils of about 140-mm diameter, in axial disposition, placed in two different configurations: in the first one with coils are separated by a distance equal to their diameter (2r field) and in the second one coils are placed in Helmoltz configuration: the distance is equal to their radius ( r field). In both configurations, the exposure system generates a linearly polarized, 50-Hz, 60-μT magnetic field: magnetic induction (peak value) ranges from 60 μT at the center to 58 μT at radial position corresponding to the outer edge of the flasks. In averaged irradiation, fields can be therefore considered reasonably constant in all the area occupied by cell cultures. Magnetic field measurement was performed using a calibrated ELF magnetic field detector for frequencies25 lower than 100 Hz. Saccharomyces and AHH1 samples were irradiated with a 2r, 50 Hz, 60 μT, while lymphocytes samples were irradiated with the magnetic field in both configurations. Using an inductive exposure system (coils), the primary component is the magnetic field. If such a field is static, no electric field will be present, however, if magnetic field varies with time, an induced electric field is produced according to Faraday’s law of induction. Another important physical issue is the control of thermal effects due to presence of electromagnetic field. Extremely low frequency electromagnetic fields (ELF-EMF) at the intensity used in most experiments, do not produce any appreciable thermal effect on the biological system as a result of the Joule effect.26 27 28 2.3.2.UV and blue light sourcesUV irradiation. Cells, disposed in a monolayer, were irradiated with an UV light lamp (λ=253 nm) for 2 to 12 min. Samples were placed at a distance of 55 cm from the center of the lamp. Blue light irradiation. Yeast cells were irradiated with a 75-W Fotolight Krugg lamp, with a maximum wavelength emission at 480 nm, for 20 to 120 s at a distance of 4 cm from the lamp metal point. 2.4.Metabolic MeasurementsIrradiated and control samples were introduced in sealed bottles and the increase of pressure in the sealed vessel, due to CO 2 production, was measured by differential pressure sensors (Miteco AM5305DV and Motorola MPX2010GP), recording pressure differences as voltage changes: 1 mV=2.024 mbar (Miteco) and 1 mV=2.182 mbar (Motorola). A thermostatic bath maintains a uniform temperature during data acquisition: 33 °C for S. cerevisiae samples and 37 °C for both lymphocytes and AHH1 culture samples. Pressure data were saved on a computer by means of an acquisition board and then plotted by suitable software.16 17 18 Both yeast, lymphocytes and AHH1 samples yield differential pressure curves (Figs. 2 3 4 5). The spikes shown in Figs. 4 and 5 are artefacts due to sudden changes in laboratory atmosphere that are differently recorded by the set of sensors. Different cell cultures do not show the same differential pressure curve. Figure 2Differential pressure curve average of 12 samples of 0.2 S. cerevisiae in α D glucose 2 minimum medium. 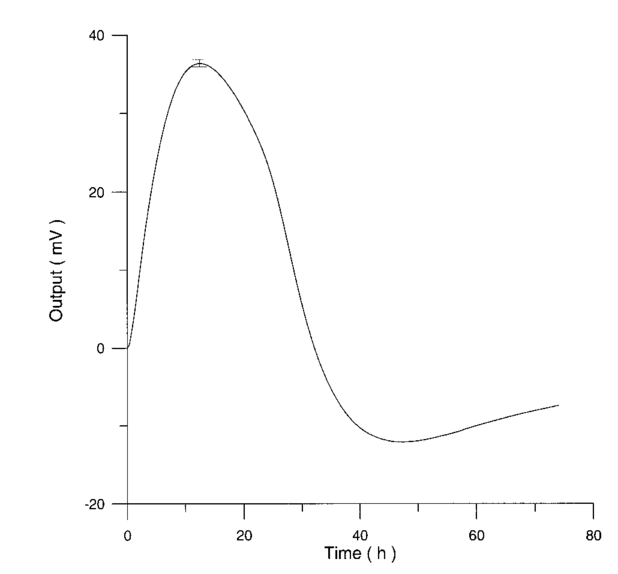 Figure 3Different metabolic phases in the differential pressure curve S. cerevisiae samples growth on minimum medium (α D glucose 2) as reported in Fig. 2. 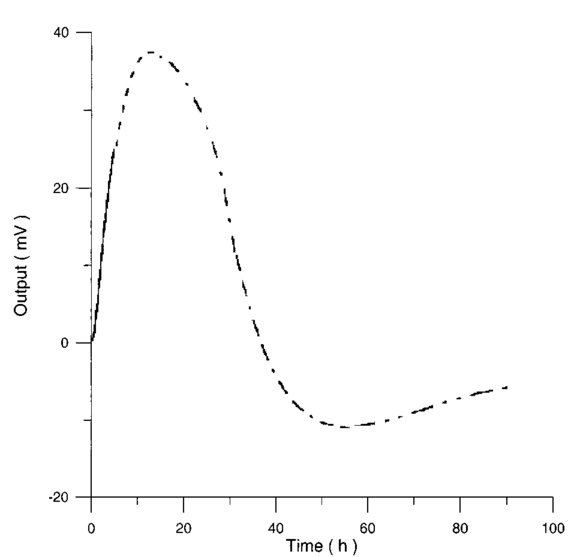 Figure 2 shows the differential pressure curve for an average of 12 samples of 0.2 S. cerevisiae grown in a α D glucose 2 minimum medium, whose shape, starting slope, and maximum are used to detect physical and chemical contamination. A biochemical interpretation of differential pressure curve was used to identify five phases (Fig. 3):
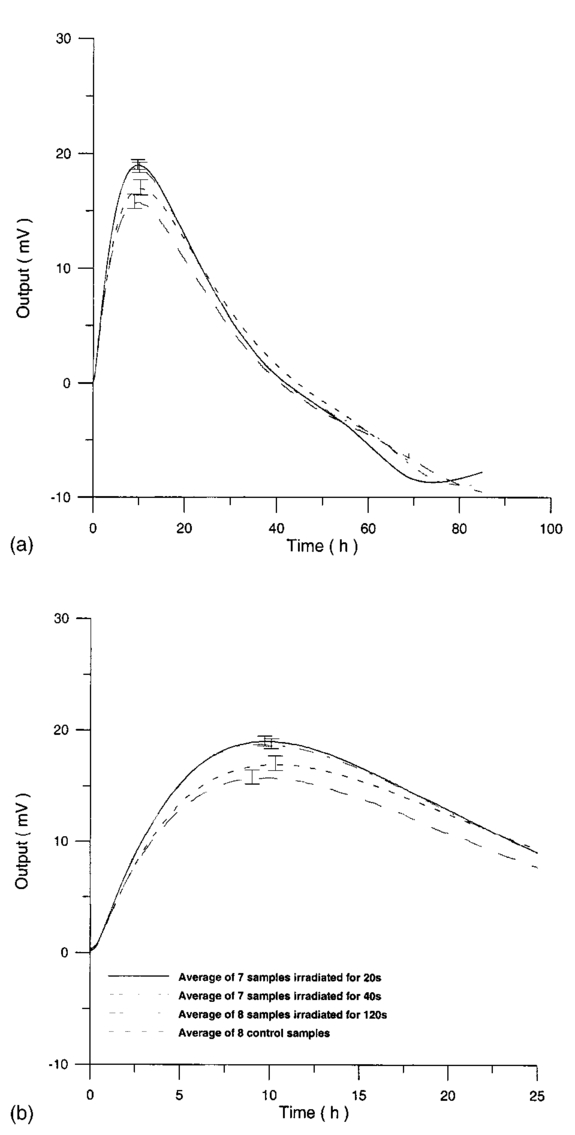
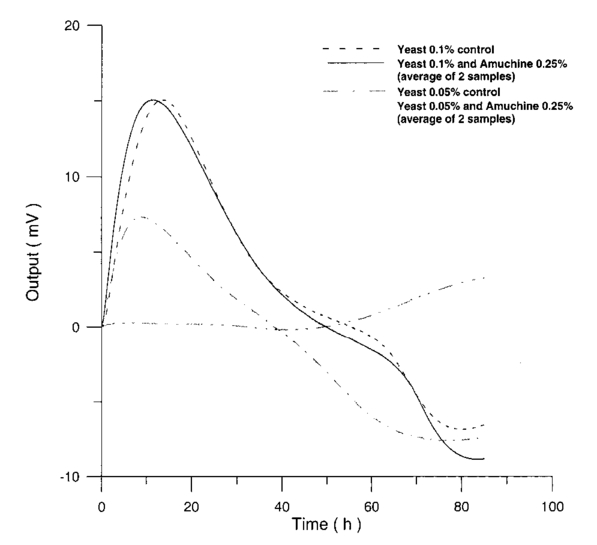
Usually when α D glucose is given to cell suspension, after 80 h they follow the same metabolic curve: a slight reduction in starting slope and the curve maximum can be ascribed to variations both in cell vitality. A control test on cell number dynamics shows that no relevant alteration in cell number is present. Contaminants of chemical or physical nature can affect the different phases of α D glucose metabolism, inducing alteration both in shape, starting slope, and curve maximum. 3.Results3.1.Saccharomyces Cerevisiae3.1.1.UV radiationFigures 6 and 7 show the differential pressure curves yielded by 0.1 S. cerevisiae samples, growth in a α D glucose 2 minimum medium, after a progressively increasing irradiation time. 3.1.2.Blue lightFigure 8 shows the differential pressure curves yielded by 0.1 S. cerevisiae samples, growth in a α D glucose 2 minimum medium, after a progressively increasing exposition to blue light (20-40-120 s). 3.1.3.Magnetic fieldThe differential pressure curve (Fig. 2) can be used as a pattern in the study of magnetic field effects. Figure 9 shows a differential pressure curve for an average of six samples yielded by 0.2 S. cerevisiae samples irradiated for 72 h with a 2r, 50-Hz, 60-μT magnetic field. 3.1.4.AmuchineTable 1 reports differential pressure curve maximums for both control samples and experimental samples containing growing percentages of Amuchine. Table 1
Data reported in Table 1 are related to four different cellular concentrations: when cell numbers per microliter decreases, differences in differential pressure curves morphology, caused by the low concentration of the pollution factor, can be observed. The same differences are not seen using higher cellular concentrations. Figure 10 shows the variations of differential pressure curve maximums when different cellular concentrations are used with the same Amuchine concentration. Differential pressure technique can be used to identify CO 2 production, and indirectly metabolic activity, of small culture samples. In Fig. 11 the differential pressure curves are related to a sample of only 1000 cells. In such cases, large culture volumes must be used (100 ml). 3.2.Lymphocyte CellsMany authors29 30 31 report that the exposure of cultured lymphocytes to an EMF does not modify the spontaneous proliferation rate ([3 H] thymidine incorporation). When mitogens, usually phytohemoagglutinin (PHA), are added, lymphocytes enter cell cycle and proliferate. One major reproducible finding from our laboratories is that the exposure to pulsed EMF (PEMF) is able to increase the number of proliferating cells. Table 2 reports cell number per microliter values for both irradiated and control cultures at the beginning and after 72 h irradiation with an r, 50-Hz, 60-μT magnetic field. Both cultures, grown in a culture medium without PHA, show negative values of growth percent. Table 2
Figure 12 shows the differential pressure curves yielded by two control and two irradiated lymphocytes samples, coming from the same donor, grown in a culture medium without PHA. Metabolic pressure curves were obtained by subtracting the culture’s pressure data due to CO 2 production for both experimental environment’s atmospheric pressure variations and pressure variations due to culture medium. Figure 13 shows the average of control and irradiated differential pressure curves yielded by lymphocyte samples resuspended in a culture medium without PHA after 72 h irradiation with a 50-Hz, 60-μT magnetic field in the Helmoltz configuration. The cell count values of control and irradiated lymphocytes samples when exposure system is used in a 2r configuration and culture medium is without PHA are reported in Table 3. Figure 12Differential pressure curves produced by control samples (dashed curve) and irradiated samples (solid curve) in case 3 of Table 2. Medium without PHA, r configuration.  Figure 13Average of 12 control samples grown in a culture medium that does not contain PHA (solid curve) and average of 12 irradiated samples (dashed curve) for a medium without PHA in the r configuration.  Table 3
Control and irradiated differential pressure curves yielded by lymphocyte samples resuspended in culture medium without PHA, when magnetic field is used in a 2r configuration are shown in Figs. 14 and 15. Figure 14Differential pressure curves produced by control samples (dashed curve) and irradiated samples (solid curve) in case 2 of Table 3. Both samples are grown in a culture medium without PHA in the 2r configuration.  Figure 15Average of four control samples grown in a culture medium without PHA (solid curve) and average of four irradiated samples grown in a culture medium without PHA (dashed curve) with the 2r configuration.  Fluctuations in cell number per microliter in control and irradiated samples during metabolic test can be seen in Table 4. The averages of the differences between irradiated and control lymphocyte samples growth percentage (I1-C1, I2-C2, etc.) in both configurations are shown. Table 4
3.3.AHH1 Cellular LineFigure 16 shows the differential pressure curves yielded by the AHH1 control and irradiated samples and Fig. 17 shows the averages of the differential pressure curves yielded by 3 control and 3 irradiated AHH1 samples. Table 5 reports cell number per microliter values of both irradiated and control AHH1 cellular line cultures after 72 h irradiation with a 2r, 50-Hz, 60-μT magnetic field. Both cultures at time 0 h have 200 cells/μl. Figure 16Differential pressure curves yielded by an AHH1 control sample (dashed curve) and by an AHH1 irradiated sample (solid curve). 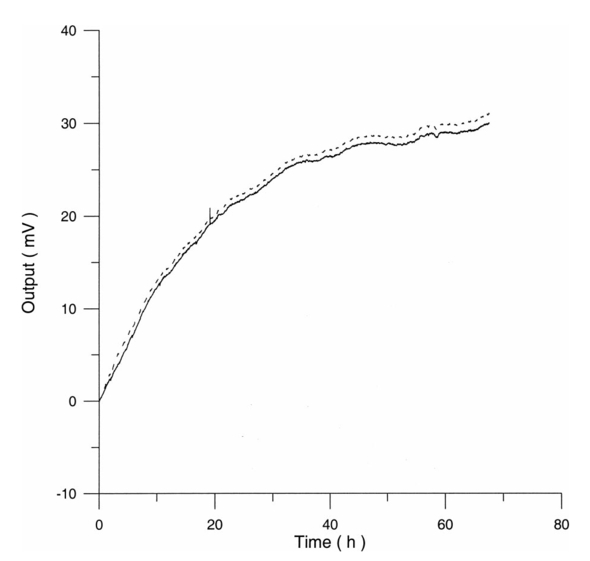 Figure 17Differential pressure curve average of 3 AHH1 control samples (solid curve) and 3 AHH1 irradiated samples (dashed curve). 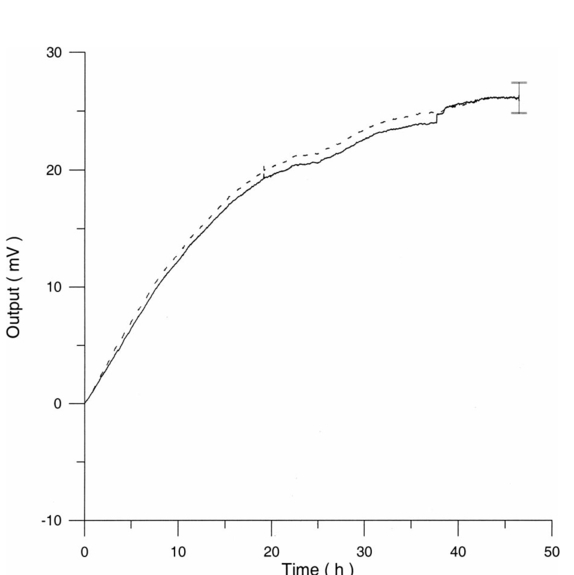 Table 5
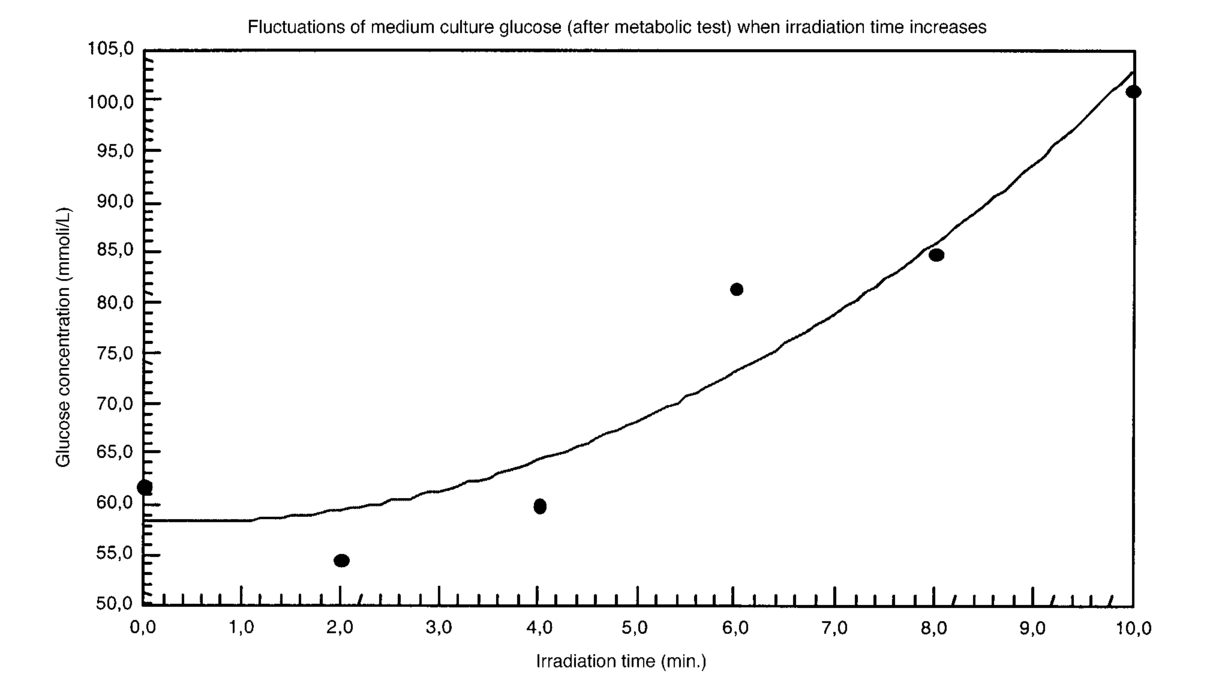
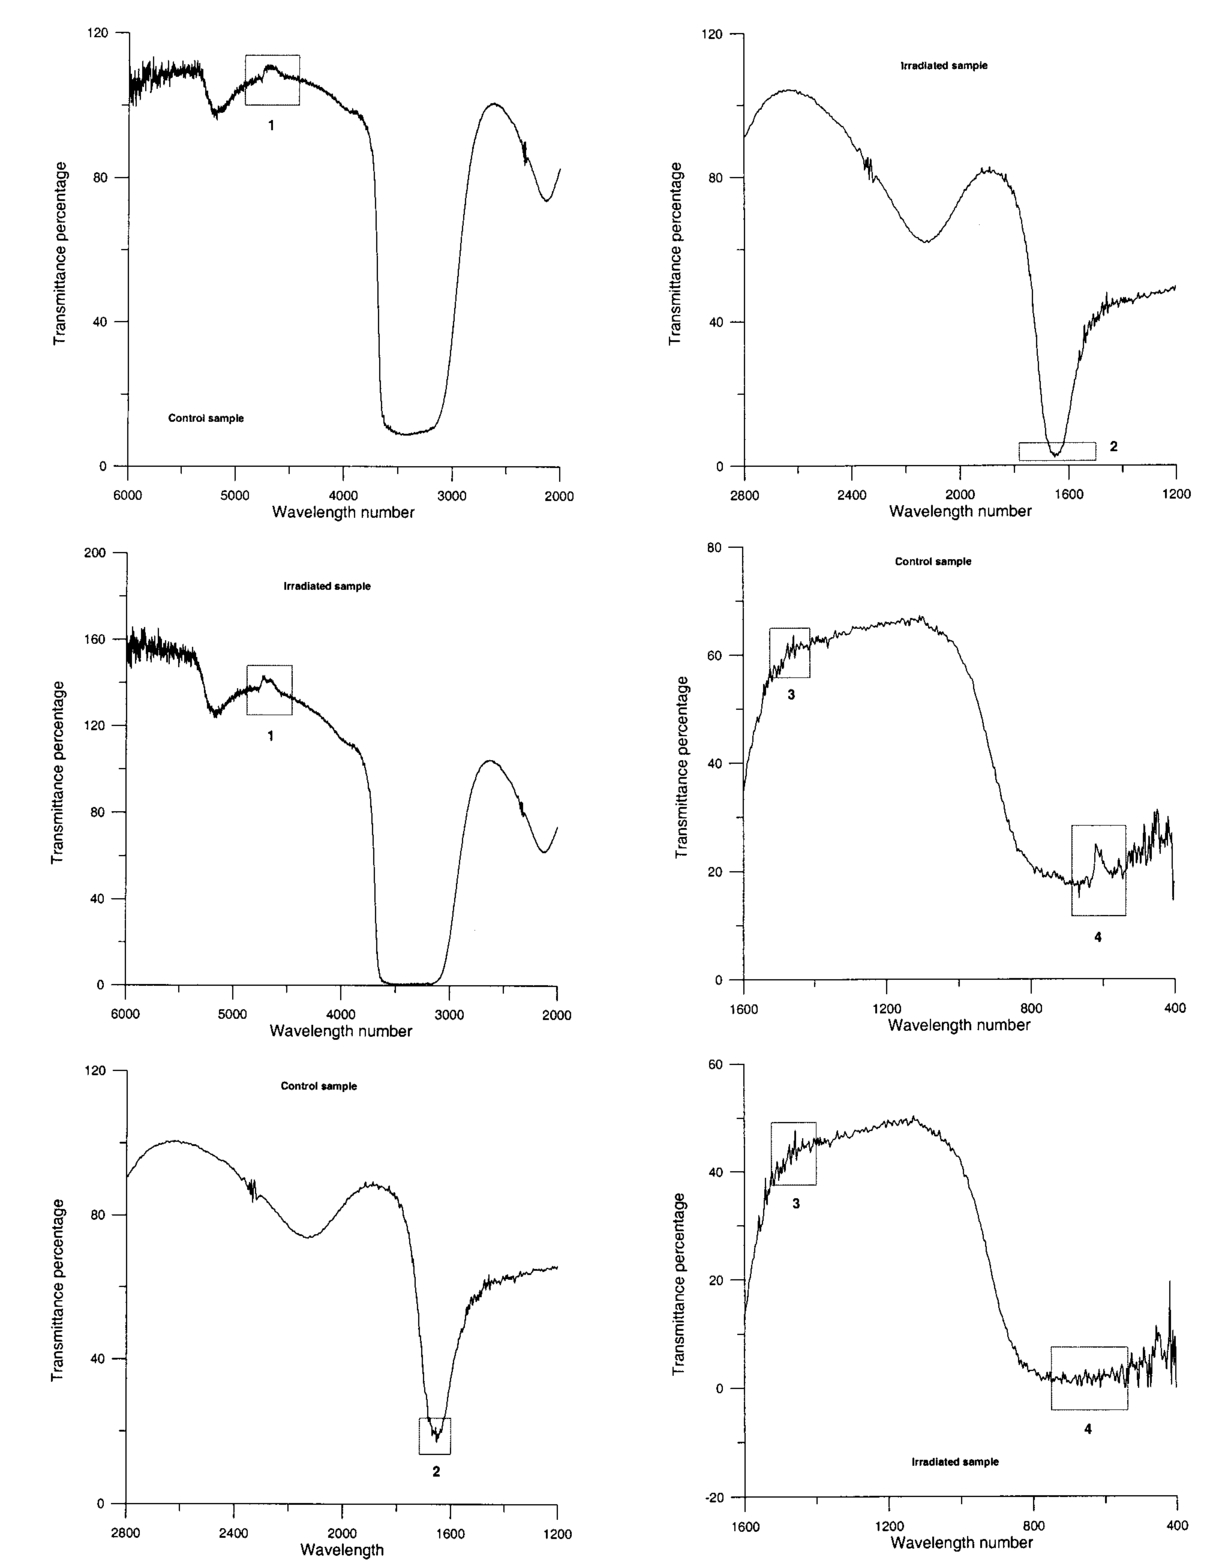
The appendix shows an IR qualitative analysis of control and irradiated culture mediums. 4.Discussion4.1.Saccharomyces CerevisiaeEffects of electromagnetic fields on microorganisms have bond been noted.28 29 30 31 32 33 34 Since then, a number of studies with a variety of different devices for generating magnetic fields have indicated the effects on growth of bacteria, yeasts, and protozoa either stimulatory or inhibitory.35 36 37 38 4.1.1.UV radiationFigures 6 and 7 show a progressive reduction of both differential pressure curves starting slope and curve maximum when irradiation time increases. The same behavior, both of curve maximum and of the starting slope, has been observed in differential pressure curves yielded by S. cerevisiae samples with progressively decreasing cellular concentrations. A reduction of differential pressure curve starting slopes, observed in irradiated samples when compared with control ones, can be explained by a smaller number of metabolically active cells. Figure 18, obtained from maximum curve values, shows curve maximum reductions when UV irradiation time increases. Although maximum reductions seem follow a curve, this is a linear function (coefficient of linear correlation r=−0.97 with P>99.5 being part of a straight line). A further indication of progressive decrease of metabolic activity when UV irradiation time increases is given by α D glucose concentration analysis in culture medium of irradiated samples when the metabolic test stops (Fig. 19). The α D glucose concentration in culture medium increases when irradiation time increases: when cell numbers decrease, the culture’s ability to use glucose is reduced. 4.1.2.Blue lightDifferential pressure curves shown in Fig. 8 are characterized by the same starting slope and, excluding the curve maximum, by a similar behavior during the metabolic test. There is no liner correlation between irradiation time and curve maximum. Error bars shown in Fig. 8 are not statistically significant, but the low number of samples (seven or eight) cannot exclude that increasing the number of irradiated samples for both the irradiated and control differential pressure curves laid one upon the others. If really present, cell damage as a consequence of culture exposure to blue light are light. 4.1.3.Magnetic fieldA 2r, 50-Hz, 60-μT magnetic field exposure does not yield macroscopic variations in α D glucose catabolism (Fig. 9). Both fermentative, oxidative processes, and ethanol consumption are unchanged. 4.1.4.AmuchineDifferential pressure curves maximum fluctuation reported in Table 1, due to Amuchine percentage concentration increase, were used to create plots correlating maximum fluctuations with pollution factor increase. Different cellular concentrations show different curves (Fig. 20). As the figure shows, when the Amuchine concentration is increased, the curve maximum decrease is not a linear function. The curve’s morphology, representing maximum fluctuation as a function of Amuchine percentage concentration, changes when S. cerevisiae cell concentration decreases. When cell number per microliter decreases, differences in differential pressure curve morphology, caused by low concentrations of the pollution factor, can be observed. The same differences are not seen using high cellular concentrations. According to Amuchine technical sheet,39 a concentration of 0.005 Amuchine (50 ppm Amuchine/l water) can sterilize water highly contaminated with 10.2 cells/ml bacteria. Note that 100 ml of S. cerevisiae culture containing 1000 yeast cells (10.2 cells/ml), α D glucose 2, and 0.005 Amuchine yielded a differential pressure curve, which does not show significant differences from the control curve. At this concentration, Amuchine does not sterilize a S. cerevisiae culture (Fig. 11). 4.2.Lymphocyte CellsThe exposure to EMFs in industrial countries has created great concern. A number of sources of EMFs to which hu-mans are exposed, for occupational reasons or because of electromagnetic pollution, is very high. Several epidemiological studies indicate that EMF exposure may increase cancer incidence.40 41 42 These data are far from clear, as contradictory results have been reported. In addition, PEMF have been introduced recently into chemical practice for therapeutic purposes and very high magnetic fields are being used for diagnostic imaging. For these reasons, a careful investigation of possible genotoxic effects of EMFs is of fundamental importance. Tables 2 and 3 show that during irradiation, with an r or 2r 50-Hz, 60-μT magnetic field, both control and irradiated cultures decrease when PHA is absent from the culture medium. Both cultures behave in the same manner: the average of the differences between irradiated and control lymphocytes samples growth percentage is 2±2 when the EMF is used in Helmoltz configuration and −2±1 when used in the 2r configuration. The same results can be observed during metabolic tests: in both configurations (r or 2r), when PHA is absent from the culture medium, control and irradiated samples decrease and the average of the differences between control and irradiated sample growth percentages is centered on zero (Table 4). A variation of the magnetic field’s configuration (r to 2r) does not seem to influence the behavior of lymphocyte samples grown in absence of PHA. Control and irradiated differential pressure curves overlap. There are no significant differences between the average of the differential pressure curves yielded by irradiated samples when exposed to EMF in both configurations (Fig. 21). Independently of magnetic field configuration, the irradiated samples yield the same metabolic answer. Figure 21Differential pressure curves (solid curve) average of 12 samples irradiated with a r, 50-Hz, 60-μT magnetic field and (dashed curve) average of 8 irradiated samples with a 2r, 50-Hz, 60-μT magnetic field. 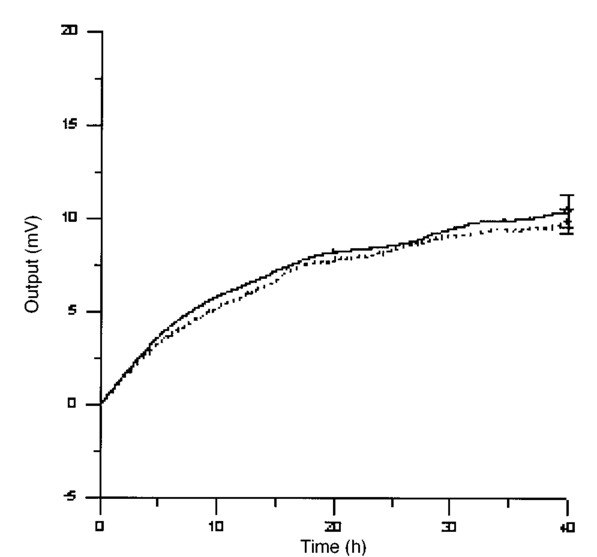 On the contrary, independent of exposure system configuration (r or 2r), the absence of significant differences between the averages of control and irradiated differential pressure curves, the presence of negative values of growth percentage during irradiation and positive values during metabolic tests suggest a greater metabolic activity in irradiated samples if compared with control samples when PHA is present in the culture medium. Tables 6 and 7 show the averages of control and irradiated lymphocytes samples growth percentage both during irradiation and during metabolic tests when samples are irradiated with an r, 50-Hz, 60-μT magnetic field (Table 6) and with a 2r, 50-Hz, 60-μT magnetic field (Table 7). Independently from magnetic field configuration (r or 2r) during irradiation the growth percentage of both control and irradiated samples, cultured in a PHA medium, decrease more than that of samples grown in absence of PHA. During the metabolic test the situation reverses: the control and irradiated samples, grown in a PHA medium, show a growth percentage greater than that of lymphocytes samples grown in absence of PHA. The growth percentage shown by control and irradiated samples, both cultured in the presence and in the absence of a PHA, shows similar values independent of exposure system configuration (Tables 6 and 7). Data reported confirm the increase in proliferating cells number seen by Cadossi et al.;43 as increase in [3 H] thymidine incorporation in lymphocytes stimulated by PHA and irradiated with a pulsed elctromagnetic field. EMF radiation exerts a modulatory effect on lymphocyte activation even if it is unable to trigger lymphocyte entry into the cell cycle per se. Table 6
Table 7
4.3.AHH1 Cellular LineControl and irradiated AHH1 samples show the same behavior (see Fig. 22). The average of the differences between irradiated and control AHH1 samples growth percentage is centered on zero. The average of cell number per microliter in the control samples is 2471±525 cells/μl and in irradiated samples 2469±488 cells/μl. A χ2 test confirmed the normal distribution of both control and irradiated AHH1 cellular populations (control samples: χ2=0.89, P=37; irradiated samples: χ2=2.5, P=11). Figure 22Normal distribution of control and irradiated AHH1 samples for (solid curve) control samples (in cell number per microliter) and (dashed curve) irradiated samples (cell number per microliter).  The averages of the differential pressure curves yielded by control and irradiated samples do not show significant differences (Fig. 17). Irradiated samples originate pressure data equal to control samples starting from the same cellular population. Both differential pressure curves and differences in growth percentage seem to show the absence of differences in cell number per microliter between control and irradiated AHH1 samples caused by an increase in the expression of the litic form of Epstein Barr virus.24 Small differences in the composition of the growing medium of control and irradiated samples, after 72 h irradiation with a 2r, 50-Hz, 60-μT magnetic field, can be observed with IR analyses, but the meaning is unknown (see Fig. 23). 5.Conclusions and PerspectivesThe metabolic curves of S. cerevisiae cells provide a fast and accurate probe for the detection of pollution factors of both chemical and physical nature. Summarizing the obtained results: S. cerevisiae cultures show both a curve maximum and staring slope decrease when exposed to UV light and to Amuchine. Nothing can be said after an exposure to blue light. Magnetic field exposure of S. cerevisiae cells does not yield macroscopic variations in α D glucose catabolism. Irradiated lymphocytes samples, cultured in a PHA medium, grow less than control ones, but exhibit a greater metabolic activity: changes in the exposure system configuration influence neither sample growth differences nor metabolic response variations between control and irradiated samples. Control and irradiated lymphocyte samples, without PHA in the culture medium, show the same behavior during both irradiation and metabolic tests. Control and irradiated AHH1 samples show no difference in both growth percentage during irradiation and metabolic test. The proposed technique and experimental setup provide good statistics for all the performed tests. The same cell culture exhibits completely different responses to different investigation objectives as different chemical and physical consequences on living systems. Magnetic field exposition effects depend on both culture conditions (culture medium, temperature) and cellular type used. The pressure monitoring technique is fast, for a low time scale, is relatively noninvasive, and of low cost. It can be used for on site detection of chemical pollution and nuclear radiation mapping. The proposed simple model points to the following conclusions:
REFERENCES
M. E. Frazier
,
J. A. Reese
,
J. E. Morris
,
R. F. Joster
, and
D. L. Miller
,
“Exposure of mammalian cells to 60-Hz magnetic or electric fields: analysis of DNA repair of induced single-strand breaks,”
Bioelectromagnetics (N.Y.) , 11
(3), 229
(1990). Google Scholar
M. R. Scarfi
,
M. B. Lioi
,
O. Zeni
,
G. Franceschetti
,
C. Franceschi
, and
F. Bersani
,
“Lack of chromosomal aberration and micronucleus induction in human lymphocytes exposed to pulsed magnetic fields,”
Mutat Res. , 306
(2), 129
(1994). Google Scholar
J. McCann
,
F. Dietrich
, and
C. Rafferty
,
“The genotoxic potential of electric and magnetic fields: an update,”
Mutat Res. , 411
(1), 45
(1998). Google Scholar
M. R. Scarfi
,
M. B. Lioi
,
O. Zeni
,
M. Della Noce
,
C. Franceschi
, and
F. Bersani
,
“Micronucleus frequency and cell proliferation in human lymphocytes exposed to 50 Hz sinusoidal magnetic fields,”
Health Phys. , 76
(3), 244
(1999). Google Scholar
M. M. Cohen
,
A. Kunska
,
J. A. Astemborski
,
D. McCulloch
, and
D. A. Paskewitz
,
“Effects of low-level, 60 Hz electromagnetic fields on human lymphoid cells: I. Mitotic rate and chromosome breakage in human peripheral lymphocytes,”
Bioelectromagnetics (N.Y.) , 7 415
(1986). Google Scholar
M. M. Cohen
,
A. Kunska
,
J. A. Astemborski
, and
D. McCulloch
,
“The effects of low-level electromagnetic fields on human lymphoid cells: II. Sister chromatid exchanges in peripheral lymphocytes and lymphoblastoid cell lines,”
Mutat Res. , 172 177
(1986). Google Scholar
I. N. Bordiushkov
,
I. A. Goroshinskaia
,
E. M. Frantsiiants
,
G. N. Tkacheva
,
E. I. Gorlo
, and
I. V. Neskubina
,
“Structural-functional changes in lymphocytes and erytrocyte membranes after exposure to alternating magnetic field,”
Vopr. Med. Khim. , 46
(1), 72
(2000). Google Scholar
A. Antonopoulos
,
B. Yang
,
A. Stamm
,
W. D. Heller
, and
G. Obe
,
“Cytological effects of 50 Hz electromagnetic fields on human lymphocytes in vitro,”
Mutat Res. , 346
(3), 151
(1995). Google Scholar
E. Lindstrom
,
P. Lindstrom
,
A. Berglund
,
K. H. Mild
, and
E. Lundgren
,
“Intracellular calcium oscillations induced in a T-cell line by a weak 50 Hz magnetic field,”
J. Cell Physiol. , 156
(2), 395
(1993). Google Scholar
A. Jandova
,
J. Hurych
,
M. Nedbalova
,
S. Trojan
,
A. Dohnalova
,
A. Cocek
,
J. Pokorny
, and
V. Trkal
,
“Effects of sinusoidal magnetic field on adherence inhibition of leucocytes: preliminary results,”
Bioelectrochem. Bioenerg. , 48
(2), 317
(1999). Google Scholar
A. W. Preece
,
K. A. Wesnes
, and
G. R. Iwi
,
“The effect of a 50 Hz magnetic field on cognitive function in humans,”
Int. J. Radiat. Biol. , 74
(4), 463
(1998). Google Scholar
L. Korpinen
,
J. Partanen
, and
A. Uusitalo
,
“Influence of 50 Hz electric and magnetic fields on the human heart,”
Bioelectromagnetics (N.Y.) , 14 329
(1993). Google Scholar
C. Graham
,
M. R. Cook
,
H. D. Cohen
, and
M. M. Gerkovich
,
“Dose response study of human exposure to 60-Hz electric and magnetic fields,”
Bioelectromagnetics (N.Y.) , 15 447
(1994). Google Scholar
M. Milani
,
M. Ballerini
,
G. Baroni
,
L. Ferraro
,
F. Salsi
,
M. Zabeo
,
E. Davioli
,
I. C. E. Turcu
,
S. Cozzi
,
S. Hughes
, and
F. Squadrini
,
“Mass spectrometry technique for the analysis of metabolic changes in soft x-ray irradiated cells,” in Advanced Techniques in Analytical Cytology V, D. L. Farkas and R. C. Leif, Eds.,”
Proc. SPIE , 4260 198
–209
(2001). Google Scholar
M. Milani
,
M. Ballerini
,
G. Baroni
,
L. Ferraro
,
M. Barberis
,
M. Cannone
, and
M. Faleri
,
“Magnetic field effects on human lymphocytes: methodological assessments and experimental evidences,” in In Vitro Diagnostic Instrumentation, G. E. Cohn, Ed.,”
Proc. SPIE , 3913 64
–78
(2000). Google Scholar
M. Milani
,
M. Ballerini
,
G. Baroni
,
L. Ferraro
,
M. Zabeo
,
M. Barberis
,
M. Cannone
, and
M. Faleri
,
“Magnetic field effects on human lymphocytes,”
Electro- Magnetobiol. , 20
(1), 81
–106
(2001). Google Scholar
M. Milani
,
M. Ballerini
,
L. Ferraro
,
E. Marelli
,
F. Mazza
, and
M. Zabeo
,
“Yeast and mammalian metabolism continuous monitoring by pressure recording as an assessment technique for xenobiotic agent effects,” in Clinical Diagnostic Systems: Technologies and Instrumentation, G. E. Cohn, Ed.,”
Proc. SPIE , 4625 44
–55
(2002). Google Scholar
M. Milani
,
M. Ballerini
,
L. Ferraro
,
M. Zabeo
,
M. Barberis
,
M. Cannone
, and
V. Faraone
,
“Contaminant effect on cellular metabolic differential pressure curve: a quantitative analysis,” in Clinical Diagnostic Systems: Technologies and Instrumentation, G. E. Cohn, Ed.,”
Proc. SPIE , 4625 56
–69
(2002). Google Scholar
D. T. Rowe
,
“Epstein-Barr virus immortalization and latency,”
Front. Biosci. , 4 d346
(1999). Google Scholar
L. L. Decker
,
L. D. Klaman
, and
D. A. Thorley-Lawson
,
“Detection of the latent form of Epstein-Barr virus in the peripheral blood of healthy individuals,”
J. Virol. , 70
(5), 3286
(1996). Google Scholar
K. D. Robertson
and
R. F. Ambinder
,
“Methilation of the Epstein-Barr virus genome in normal lymphocytes,”
Blood , 90
(11), 4480
(1997). Google Scholar
M. G. Doyle
,
D. Catovsky
, and
D. H. Crawford
,
“Infection of leukaemic B lymphocytes by Epstein-Barr virus,”
Leukemia , 7
(11), 1858
(1993). Google Scholar
G. Miller
,
“Immortalization of human lymphocytes by Epstein-Barr virus,”
Yale J. Biol. Med. , 55
(3–4), 305
(1982). Google Scholar
S. Grimaldi
,
E. Pasquali
,
L. Barbatano
,
A. Lisi
,
N. Santoro
,
A. Serafino
, and
D. Pozzi
,
“Exposure to a 50 Hz electromagnetic field induces activation of the Epstein-Barr virus genome latently infected human lymphoid cells,”
J. Environ. Pathol. Toxicol. Oncol. , 16
(2–3), 205
(1997). Google Scholar
S. Ivancsits
,
E. Diem
,
O. Jahn
, and
H. W. Rudiger
,
“Intermittent extremely low frequency electromagnetic fields cause DNA damage in a dose-dependent way,”
Int. Arch. Occup. Environ. Health , 12 431
–436
(2003). Google Scholar
V. N. Binhi
and
R. J. Goldman
,
“Ion-protein dissociation predicts ‘windows’ in electric field-induced wound-cell proliferation,”
Biochim. Biophys. Acta , 1474
(2), 147
–156
(2000). Google Scholar
A. Fedorowski
and
A. Steciwko
,
“Biological effects of non-ionizing electromagnetic radiation,”
Med. Pr. , 49
(1), 93
–105
(1998). Google Scholar
N. A. Mooney
,
R. E. Smith
, and
B. W. Watson
,
“Effect of extremely low frequency pulsed magnetic fields on the mitogenic response of peripheral blood mononuclear cells,”
Bioelectromagnetics (N.Y.) , 7 387
–394
(1986). Google Scholar
R. Polidori
,
F. Vaglini
,
M. Petrini
,
F. Ambrogi
,
P. Zaniol
, and
G. Ronca
,
“Activity of electromagnetic fields on some leucocyte functions,”
Med. Sci. Res. , 16 1117
–1118
(1988). Google Scholar
J. D. Saffer
and
J. L. Phillips
,
“Evaluating the biological aspects of in vitro studies in bioelectromagnetics,”
Bioelectrochem. Bioenerg. , 40 1
–7
(1996). Google Scholar
A. Zrimec
,
I. Jerman
, and
G. Lahajnar
,
“Alternating electric fields stimulate ATP synthesis in Escherichia coli,”
Cell. Mol. Biol. Lett. , 7
(1), 172
–174
(2002). Google Scholar
B. Del Re
,
F. Garoia
,
P. Mesirca
,
C. Agostini
,
F. Bersani
, and
G. Giorgi
,
“Extremely low frequency magnetic fields affect transposition activity in Escherichia coli.,”
Radiat. Environ. Biophys. , 42 113
–118
(2003). Google Scholar
S. Hadjiloucas
,
M. S. Chahal
, and
J. W. Bowen
,
“Preliminary results on the non-thermal effects of 200–350 GHz radiation on the growth rate of S. cerevisiae cells in microcolonies,”
Phys. Med. Biol. , 47
(21), 3831
–3839
(2002). Google Scholar
P. Gos
,
B. Eicher
,
J. Kohli
, and
W. D. Heyer
,
“Extremely high frequency electromagnetic fields at low power density do not affect the division of exponential phase Saccharomyces cerevisiae cells,”
Bioelectromagnetics (N.Y.) , 18
(2), 142
–155
(1997). Google Scholar
R. S. Stepanian
,
A. A. Barsegian
,
Z. R. Alaverdian
,
G. G. Oganesian
,
L. S. Markosian
, and
S. N. Airapetian
,
“The effect of magnetic fields on the growth and division of the Ion mutant of Escherichia coli K-12,”
Radiats. Biol. Radioecol. , 40
(3), 319
–322
(2002). Google Scholar
L. E. Dihel
,
J. Smith-Sonneborn
, and
C. R. Middaugh
,
“Effects of an extremely low frequency electromagnetic field on the cell division rate and plasma membrane of Paramecium tetraurelia,”
Bioelectromagnetics (N.Y.) , 6
(1), 61
–71
(1985). Google Scholar
S. Lagorio
and
A. Salvan
,
“Infantile leukemia and exposure to 50/60 Hz magnetic fields: review of epidemiologic evidence in 2000,”
Ann. Ist. Super. Sanita. , 37
(2), 213
–224
(2001). Google Scholar
L. E. Charles
,
D. Loomis
,
C. M. Shy
,
B. Newman
,
R. Millikan
,
L. A. Nylander-French
, and
D. Couper
,
“Electromagnetic fields, polychlorinated biphenyls, and prostate cancer mortality in electric utility workers,”
Am. J. Epidemiol. , 157
(8), 683
–691
(2003). Google Scholar
C. Y. Li
and
F. C. Sung
,
“Association between occupational exposure to power frequency electromagnetic fields and amyotrophic lateral sclerosis: a review,”
Am. J. Ind. Med. , 43
(2), 212
–220
(2003). Google Scholar
R. Cadossi
,
F. Bersani
,
A. Cossarizza
,
P. Zucchini
,
G. Emilia
,
G. Torelli
, and
C. Franceschi
,
“Lymphocytes and low-frequency electromagnetic fields,”
FASEB J , 6 2667
–2674
(1992). Google Scholar
L. Vodovnir
and
D. Miklavcˇicˇ
,
“A theoretical approach to perturbation of biological systems by electrical currents,”
Electro. Magnet. Biol. , 14 51
–62
(1995). Google Scholar
|
|||||||||||||||||||||||||||||||||||||||||||||||||||||||||||||||||||||||||||||||||||||||||||||||||||||||||||||||||||||||||||||||||||||||||||||||||||||||||||||||||||||||||||||||||||||||||||||||||||||||||||||||||||||||||||||||||||||||||||||||||||||||||||||||||||||||||||||||||||||||||||||||||||||||||||||||||||||||||||||||||||||||||||||||||||||||||||||||||||||||||||||||||||||||||||||||||||||||||||||||||||||||||||||||||||||||||||||||||||||||||||||||||||||||||||||||||||||||||||||||||||||||||||||||||||||||||||||||||||||||||||||||||||||||||||||||||||