
|
|
1.IntroductionMelanin is one of the most ubiquitous and biologically important natural pigments,1 and is largely responsible for the color of skin, hair, and eyes. Functionally, melanin can act as a sunscreen, scavenge active chemical species, and produce active radicals that can damage DNA.2 Melanin can be divided into two main classes: 1. eumelanin, a black-to-dark-brown insoluble material found in black hair and in the retina of the eye, and 2. pheomelanin, a yellow-to-reddish-brown alkali-soluble material found in red hair and red feathers.3 Because of its biological importance, particularly its role in skin, melanin has been extensively studied using a wide variety of techniques including mass spectrometry, x-ray diffraction, nuclear magnetic resonance, and scanning tunneling microscopy.4 5 6 7 Although eumelanin is currently believed to be a heteropolymer consisting of varying o-dihydroxyindolic and phenolic units, its chemical structure and biological functions are still subject to debate.3 8 9 10 11 Since melanin’s interaction with light is one of its characteristic physical and functional properties, optical measurements are a standard tool for its in vivo detection and measurement. At the present time, in vivo optical measurements of melanin are largely based on its absorption properties.8 12 13 14 15 16 Specifically, the relative absence (negative signal) of remitted or transmitted light from a tissue sample is usually inferred as indicating the presence of melanin. However, melanin has no distinctive absorption peaks to distinguish itself from other cutaneous chromophores. Instead, melanin absorption decreases monotonically with increasing wavelengths from 300 to 1100 nm. This makes it very difficult to quantify melanin in vivo on the background of other cutaneous chromophores such as oxy- and deoxy-hemoglobin. A positive method, which probes signals from a melanin-containing sample, would be in general much less ambiguous and more appropriate for quantitative evaluation. Raman spectroscopy, which probes molecular vibrations, constitutes such a positive method. However, the extremely low quantum efficiency of Raman excitation necessitates high illumination power density and long data acquisition times using conventional instrumentation. Experimentation under these conditions will likely damage the melanins under investigation. Although preliminary Raman studies on synthetic melanin and persulfate oxidized tyrosine (POT) were carried out by Panina and Cooper et al.;,17 18 in vivo Raman measurement of melanin has not yet been reported to date. A previous study of Raman spectroscopy of human hair did not report any Raman signals from black hair,19 the melanin of which consists of 99 eumelanin.20 We report the successful in vivo Raman measurement of melanin in human skin. Using low incident laser power and a rapid spectral acquisition technique, we have observed two intense Raman bands from in vivo skin and hair as well as from synthetic and natural eumelanins. These two bands can serve as a spectral signature for eumelanin and can potentially be used for clinical noninvasive in situ analysis and diagnosis. 2.Materials and Methods2.1.Melanin Samples and Human SkinNatural melanin isolated from cuttlefish ink sacs of Sepia officinalis (M-2649) and synthetic dihydroxyphenylalanine (DOPA) melanin (M-8631) were obtained from the Sigma-Aldrich Chemical Corporation (St. Louis, Missouri). These two forms of eumelanins did not undergo any further processing prior to spectroscopic analysis at four excitation wavelengths: 457.9, 514.5, 632.8, and 785 nm. To examine Raman scattering of in situ melanins, human skin (i.e., normal dark skin from an African volunteer, benign melanocytic compound nevus, and malignant melanoma) as well as human and feline black hair were measured under 632.8- and 785-nm excitation. This study was approved by the Clinical Research Ethics Board of the University of British Columbia. 2.2.Raman Spectroscopy MeasurementsThe Raman spectra of the melanin samples and human skin and hair were obtained using a rapid acquisition dispersive-type near-infrared (NIR) Raman spectrometer with a 785-nm diode laser. This spectrometer was developed for real time in vivo biomedical applications and provided optimal optical throughput and high charge-coupled device (CCD) detector sensitivity.21 The spectral resolution of the system is 8 cm−1. The power density of the excitation light was 1.56 W/cm2 (150 mW over a 3.5-mm-diam spot), and data acquisition was completed within 1 s to ensure high-quality Raman spectra without damaging the melanin samples or tissues. For the in vitro melanin samples only, Raman spectra were also obtained under different excitation wavelengths using two other Raman systems: an 80-cm conventional triple Raman spectrograph with an argon ion laser, and a confocal MicroRaman system with a helium-neon (He-Ne) laser (J.Y. Horiba). The spectral resolution of the triple Raman spectrograph is 5 cm−1, while the MicroRaman system has a spectral resolution of 2 cm−1. Since these two latter systems require much longer data acquisition times (as long as 20 min), great care was taken to make sure that the melanin samples were not damaged by the laser irradiation during measurements. The excitation power density was controlled not to exceed 1 W/cm3. Under these conditions, the measured spectra are similar to those obtained with the rapid acquisition in vivo Raman system. In aggregate, four laser lines were used to excite Raman scattering: 457.9 nm (Ar +), 514.5 nm (Ar +), 632.8 nm (He-Ne), and 785 nm (diode). All measured melanin spectra were corrected according to the spectral responses of the respective Raman systems. Polynomial functions were used to fit the autofluorescence backgrounds.22 A second-order polynomial was found to be optimal in this study for fitting the melanin autofluorescence background in the spectral range of 800 to 1800 cm−1, and this polynomial was therefore subtracted from the raw spectrum to yield the melanin Raman spectrum alone. Each of the melanin Raman spectra was then normalized to the integrated area under the curve from 800 to 1800 cm−1 to enable comparisons of the shapes and relative peak intensities among different spectra. 3.Results and DiscussionUnder 785-nm diode laser excitation, the rapid acquisition NIR Raman spectrometer measurements demonstrated two broad spectral peaks for natural melanin isolated from Sepia officinalis around 880 and 895 nm on the basic raw emission spectrum, which presumably included both autofluorescence and Raman signals (Fig. 1). To more clearly delineate the physical basis for these two spectral peaks, we measured the spectra of the same natural melanin sample under three additional separate excitation wavelengths. At all four excitation wavelengths evaluated (457.9, 514.5, 632.8, and 785 nm), two spectral peaks were regularly present on all the melanin spectra (Fig. 2), with their wavelength positions differing according to excitation wavelengths (Table 1). The wavelength dependence for these signals suggested an origin from Raman scattering rather than fluorescence emission. When the spectra were replotted in frequency units on a relative wavenumber (cm−1) scale according to: Figure 1The emission spectrum of natural melanin isolated from Sepia officinalis excited by 785-nm laser light. 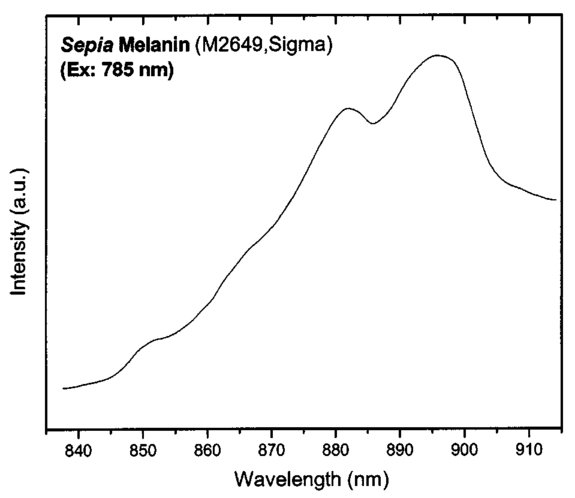 Figure 2Emission spectra of Sepia melanin excited by laser light at 457.9, 514.5, 632.8, and 785 nm, respectively. The spectra are measured with three different systems. The intensities are in arbitrary units (a.u.) and are not comparable between different curves.  Table 1
where λ0 is the excitation laser wavelength, λ is the measurement wavelength, and ν is the Raman shift in terms of relative wavenumbers, the two peak positions appeared to be independent of the excitation wavelengths (Fig. 3 and Table 1). This confirms that the two spectral peaks observed were indeed Raman signals rather than fluorescence emission. Figure 3Spectra of Sepia melanin (Fig. 2) excited by 457.9-, 514.5-, 632.8-, and 785-nm laser light, respectively, were displayed in units of wavenumbers (cm−1). The y axis of each curve has been shifted up or down for better comparison of the spectral shapes and peak positions.  To yield the Raman signals alone, autofluorescence background emissions were subtracted from the raw melanin spectra using second-order polynomials. Figure 4 shows the background-subtracted Raman spectra of synthetic DOPA melanin and natural melanin isolated from Sepia officinalis using laser excitation wavelengths of 457.9, 514.5, 632.8, and 785 nm, respectively. Both synthetic and natural melanins exhibited two characteristic broad spectral peaks near 1385, and 1585 cm−1 at all excitation wavelengths, confirming again their origin from Raman scattering rather than fluorescence. As to the broadband background autofluorescence emission properties of melanin, a more detailed study is currently being carried out by our group and will be reported in a separate work. Figure 4Raman spectra of synthetic DOPA melanin and natural melanin isolated from Sepia officinalis: (a) and (e) are excited by a 457.9-nm laser, (b) and (f) by a 514.5-nm laser, (c) and (g) by a 632.8-nm laser, and (d) and (h) by a 785-nm laser. Autofluorescence background has been subtracted from the measured melanin spectra using second-order polynomial functions.  Human and feline black hair appeared to be similarly dominated by the two constant strong bands at about 1375 and 1580 cm−1 (Fig. 5). There was an approximately linear relationship between Raman signal intensity and excitation light irradiance (Fig. 6), thus eliminating the possibility that other two-step mechanisms (e.g., phosphorescence) accounted for the observed melanin signals. These measurements from a variety of melanin sources using multiple wavelengths confirm that the two prominent peaks we observed in melanins are due to inelastic Raman scattering rather than fluorescence or other nonlinear processes. Figure 5Raman spectra of human and feline black hair: (a) and (c) are excited by a 632.8-nm laser, (b) and (d) by a 785-nm laser. 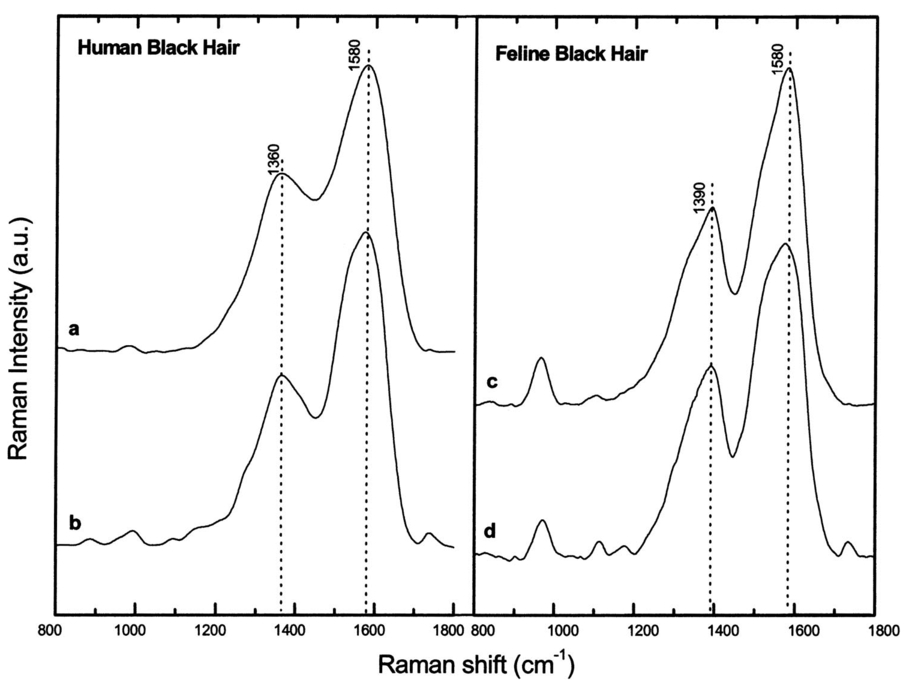 Figure 6Plots of log Raman peak intensity of Sepia melanin versus log irradiance of laser light at 785 nm, giving linear lines with slopes of 0.92 and 0.88 for Raman peaks at 1580 and 1400 cm−1, respectively.  To evaluate Raman signals from in vivo cutaneous melanin, we have also measured human volunteers with other dark skin or pigmented skin lesions using the rapid Raman system. Figure 7 shows the in vivo Raman spectra from normal skin of a dark-completed volunteer of African descent (Fig. 7(a)), a benign compound melanocytic nevus, and (Fig. 7(b)), and a malignant melanoma (Fig. 7(c)) when excited by the 785-nm laser. For comparison, Fig. 7(d) also gives the Raman spectrum of normally pigmented skin adjacent to the malignant melanoma from Fig. 7(c). The corresponding clinical appearance of the dark-completed normal skin, the benign compound pigmented nevus, the malignant melanoma, as well as its adjacent normal skin for in vivo Raman measurements is also shown in Fig. 7. It can be observed that the spectra of cutaneous melanin mainly comprise two intense and broad bands peaking near 1368 and 1572 cm−1 that are very similar to the Raman patterns observed in eumelanin samples and black hair (Figs. 4 and 5). In addition, the in vivo skin Raman spectra showed vibrational bands for proteins and lipids that were different in skin that appeared dark due to melanin.19 21 For instance, the weaker vibrational mode at 1742 cm−1 assigned to C=O stretching of the lipid head group19 was present in highly pigmented skin lesions, while other bands were significantly reduced: e.g., the ν (C=O) amide I band at 1654 cm−1, the δ (CH 3) and δ (CH 2) at scissoring mode at 1445 cm−1, the CH 2 deformation at 1301 cm−1, and the ν (CN) and δ (NH) amide III bands at 1269 cm−1. One may note that the 1445-cm−1 peak disappeared in the malignant melanoma spectrum but was observed in the benign compound nevus spectrum, whereas the converse was true for the 1269-cm−1 peak. These differences as well as the peak positions and bandwidths of the two melanin Raman bands (see Table 2) may be potentially useful for noninvasive melanoma detection if they are confirmed in our future clinical Raman studies with a large patient population. Figure 7In vivo Raman spectra of cutaneous melanin obtained under 785-nm laser excitation from: (a) volar forearm skin of a volunteer of African descent, (b) benign compound pigmented nevus, (c) malignant melanoma, and (d) normal skin site adjacent to the malignant melanoma. Also shown at the right side are clinical images of the corresponding skin sites for in vivo Raman measurements.  Table 2
Melanin Raman spectra were also measured using polarized (I∥) and depolarized (I⊥) scattering geometry23 to determine the depolarization ratio (ρ=I⊥/I∥) for melanin Raman spectra (example shown in Fig. 8), and showed no significant differences except that the depolarized spectrum was weaker than the polarized spectrum [Fig. 8(a)]. The depolarization ratio (ρ) is nearly constant at about 0.42 over a wide spectral range from 100 to 4000 cm−1 [Fig. 8(b)]. Constant depolarization ratios are commonly observed in amorphous materials,24 and are presumably due to structural geometric randomness in the case of melanin.15 25 26 Furthermore, the two melanin Raman bands are quite broad with a full width at half maximum greater than 100 cm−1 (see Table 2), which is about five-fold broader than Raman bands observed in human skin or white hair.19 21 The wide bandwidths may be related to irregular arrangement in the molecular structure of melanins,26 particularly in terms of irregular polymeric connections among different monomers and functional groups that alter bond strengths and vibrational frequencies. Thus each broadband in the melanin spectrum may represent a group of related vibrational modes. Figure 8(a) Polarized and depolarized Raman spectra of synthetic melanin measured using the 457.9-nm line of an argon-ion polarized laser. (b) The depolarization ratio (ρ=I⊥/I∥) of the melanin spectra obtained by dividing the polarized spectrum (I∥) by the depolarized spectrum (I⊥).  The observed melanin Raman spectrum shown in Fig. 8(a) apparently is very similar to the Raman spectrum of disordered graphite. In particular, the bands at about 1380 and 1580 cm−1 are very similar to the well-known D band and G band observed in the Raman spectra of disordered graphite,27 28 and the broad feature near 3000 cm−1 can be interpreted as the overtone of these two bands via second-order Raman effects.29 The G band of graphite, which is at about 1580 cm−1, arises from stretching the hexagonal carbon rings. The D band, which occurs at about 1380 cm−1 in disordered graphite, arises from linearly stretching three of the six C-C bonds.27 Since both melanin and disordered graphite are dark-colored carbon-rich materials and contain irregularly connected hexagonal carbon rings, the similarity between the spectra of these materials suggests similar interpretations of the observed Raman bands. On the other hand, melanin also contains other structures, including methyl and methylene groups, which should also have contributions to the Raman spectrum. In fact, a band at 1380 cm−1 was observed in IR absorption spectra of synthetic melanins and black hair, and was assigned to the CH 3 and CH 2 bending modes of methyl and methylene groups.15 30 In addition, a weak band at 1585 cm−1 appeared in the IR spectra of melanins complexed with Cu 2+ or Fe 3+ ions,30 which could be due to phenyl skeletal and methyl asymmetric vibrations.15 30 31 32 However, since we did not observed any C-H vibrational modes at other frequencies in the Raman spectrum of melanin, the contributions from the methyl and methylene groups might be small. Therefore, it is reasonable to interpret the two prominent Raman bands, observed in synthetic melanin and natural melanins from Sepia, black hair, and human skin, as originating from the in-plane stretching of the aromatic rings (near 1580 cm−1) and the linear stretching of the C-C bonds within the rings (near 1380 cm−1), with some contributions from the C-H vibrations in the methyl and methylene groups. Gaussian fit to the experimental data. The variation of melanin Raman spectra according to excitation wavelengths are shown in Figs. 4 and 5. The two broad Raman bands consistently appeared at 1360 to 1400 and 1580 to 1590 cm−1, regardless of the excitation wavelengths, suggesting that the observed spectra were a superimposition of two underlying signals (i.e., two groups of related vibrational modes of molecular components). A simple two-component model was therefore used to deconvolute the melanin spectra of Figs. 4, 5, and 7. To facilitate a computer fit to the data, the component Raman spectral intensity I(x) was assumed to be Gaussian function,33 where Hi is the height of the respective Gaussian spectra; and Ai is the total area under the curve from the baseline. Wi represents the center of the peak at which the Raman intensities reach maximum values for the two component spectra, and ΔWi is approximately 0.849 times of the width of the peak at half height.A program was written to fit Eq. (2) to all of the spectra shown in Figs. 4, 5, and 7. For instance, a reasonably good fit to the Raman spectrum of synthetic melanin at 785-nm excitation is shown in Fig. 9. Similar results were also obtained for other experimental data with the parametric values of the Gaussian base spectra listed in Table 2. Note that the sum of the areas under the two Gaussian component spectra equals 1 for all spectra. Figure 9Comparison of the experimental Raman spectrum of synthetic melanin (black solid line) with Gaussian component spectra (red dotted and solid lines). Parametric values used for the Gaussian spectra were given in Table 2.  There are slight differences between the Raman spectra of natural melanin isolated from Sepia officinalis and synthetic DOPA melanin (Fig. 4). For the 1400-cm−1 peak, the Sepia melanin spectral maximum is approximately 20 cm−1 higher than that of DOPA melanin, whereas at the 1580-cm−1 peak, the Sepia melanin spectral maximum is closer to that of DOPA melanin (Table 2). The 1400-cm−1 peak bandwidth of Sepia melanin is about 20 cm−1 narrower than that of DOPA melanin, while the 1580-cm−1 peak bandwidths of Sepia melanin and DOPA melanin are about the same. Differences also exist in the peak positions and bandwidths between human skin and black hair melanin (Figs. 5 and 7). For the 1400-cm−1 peak, the human black hair spectral maximum is located about 30 cm−1 lower than that of feline black hair, while for the 1580-cm−1 peak, the corresponding difference is negligible. The 1400-cm−1 peak bandwidth of human black hair is about 20 cm−1 broader than that of feline black hair, while the 1580-cm−1 peak bandwidths of human black hair and feline black hair are about the same. Comparing Raman features between dark normal skin, benign nevus, and malignant melanoma, the first Raman band position (1370 cm−1) is similar for all three, while the bandwidth of normal dark skin is about 10 to 30 cm−1 less than that of the benign compound nevus and malignant melanoma. The details for these variations can be found in Table 2. The results show that there are differences in the spectral features (e.g., peak position, strength, bandwidth) of these two prominent Raman bands between different forms of eumelanins, indicating that melanin Raman signals are particularly sensitive to varying chemical and biological environments. The observation that eumelanins possess characteristic Raman features may facilitate better understanding of the structures and biological functions of melanins in different biochemical systems. 4.Concluding RemarksWe have discovered that eumelanins exhibit specific Raman scattering properties that are measurable in situ, thereby providing a novel, nondestructive means for characterizing melanins according to their occurrence in different biological environments. The confirmation that melanin from a variety of sources possesses two characteristic Raman bands at around 1360 to 1400 cm−1, and 1570 to 1590 cm−1 constitutes the direct evidence that Raman spectroscopy can be used to identify molecular groups and bonds within melanin. The broad bandwidth (>100 cm−1) of the two Raman peaks and the constant depolarization ratio from polarized Raman experiments support that melanins are amorphous-like biopolymers. We also observe variations in the peak position and bandwidth of these two Raman bands due to different pathologic conditions in skin, as well as different biological environments in samples from different sources. The discovery of these unique positive Raman signals in in vivo skin has opened the prospect of direct noninvasive in situ optical measurement and characterization of melanin in heavily pigmented tissues, which can have important applications in biology and medicine. AcknowledgmentsWe would like to thank Eileen Tan and Jerry Shapiro, and Michelle Zeng for their assistance with the experiments. This work was supported by the National Cancer Institute of Canada with funds from the Canadian Cancer Society, by the Natural Science and Engineering Research Council of Canada, and by the Canadian Dermatology Foundation. REFERENCES
H. Z. Hill
,
“The function of melanin or six blind people examine an elephant,”
BioEssays , 14 49
–56
(1992). Google Scholar
A. Pezzella
,
A. Napolitano
,
M. d’Ischia
,
G. Prota
,
R. Seraglia
, and
P. Traldi
,
“Identification of partially degraded oligomers of 5,6-dihydroxyindole-2-carboxylic acid in Sepia melanin by matrix-assisted laser desorption/ionization mass spectrometry,”
Rapid Commun. Mass Spectrom. , 11 368
–372
(1997). Google Scholar
J. Cheng
,
S. C. Moss
,
M. Eisner
, and
P. Zschack
,
“X-ray characterization of melanins-I,”
Pigment Cell Res. , 7 255
–262
(1994). Google Scholar
A. R. Katritzky
,
N. G. Akhmedov
,
S. N. Denisenko
, and
O. V. Denisko
, Pigment Cell Res. , 15 93
–97
(2002). Google Scholar
J. M. Gallas
,
G. W. Zajac
,
T. Sarna
, and
P. L. Stotter
,
“Structural differences in unbleached and mildly-bleached synthetic tyrosine-derived melanins identified by scanning probe microscopies,”
Pigment Cell Res. , 13 99
–108
(2000). Google Scholar
J. B. Nofsinger
,
S. E. Forest
, and
J. D. Simon
,
“Explanation for the disparity among absorption and action spectra of eumelanin,”
J. Phys. Chem. B , 103 11428
–11432
(1999). Google Scholar
K. Wakamatsu
and
S. Ito
,
“Advanced chemical methods in melanin determination,”
Pigment Cell Res. , 15 174
–183
(2002). Google Scholar
M. A. Rosei
,
L. Mosca
, and
C. D. Marco
,
“Spectroscopic features of native and bleached opio-melanins,”
Biochim. Biophys. Acta , 1243 71
–77
(1995). Google Scholar
I. A. Menon
,
S. Persad
,
H. F. Haberman
, and
C. J. Kurian
,
“A comparative study of physical and chemical properties of melanins isolated from human black and red hair,”
J. Invest. Dermatol. , 80 202
–206
(1983). Google Scholar
N. Kollias
and
A. Baqer
,
“Spectroscopic characteristics of human melanin in vivo,”
J. Invest. Dermatol. , 85 38
–42
(1985). Google Scholar
B. Bilinska
,
“Progress of infrared investigations of melanin structures,”
Spectrochim. Acta, Part A , 52 1157
–1162
(1996). Google Scholar
M. G. Bridelli
,
D. Tampellini
, and
L. Zecca
,
“The structure of neuromelanin and its iron binding site studied by infrared spectroscopy,”
FEBS Lett. , 457 18
–22
(1999). Google Scholar
S. Paim
,
L. F. Linhares
,
A. S. Magrich
, and
J. P. Martin
,
“Characterization of fungal melanins and soil humic acids by chemical and infrared spectroscopy,”
Biol. Fertil. Soils, 10 72
–76
(1990). Google Scholar
L. K. Panina
,
N. F. Kartenko
,
Y. A. Kumzerov
, and
M. F. Limonov
,
“Comparative study of the spatial organization of biological carbon nanostructures and fullerene-related carbon,”
Mol. Mater. , 11 117
–120
(1998). Google Scholar
T. M. Cooper
,
D. L. Bolton
,
S. T. Schuschereba
, and
E. T. Schmeisser
,
“Luminescence and raman spectroscopic characterization of tyrosine oxidized by persulfate,”
Appl. Spectrosc. , 41 661
–667
(1987). Google Scholar
W. Akhtar
,
H. G. Edwards
,
D. W. Farwell
, and
M. Nutbrown
,
“Fourier-transform Raman spectroscopic study of human hair,”
Spectrochim. Acta, Part A , 53A 1021
–1031
(1997). Google Scholar
C. R. Borges
,
J. C. Roberts
,
D. G. Wilkins
, and
D. E. Rollis
,
“Relationship of melanin degradation products to actual melanin content: application to human hair,”
Anal. Biochem. , 290 116
–125
(2001). Google Scholar
Z. Huang
,
H. Zeng
,
I. Hamzavi
,
D. I. McLean
, and
H. Lui
,
“Rapid near-infrared Raman spectroscopy system for real-time in vivo skin measurements,”
Opt. Lett. , 26 1782
–1784
(2001). Google Scholar
A. Mahadevan-Jansen
and
R. Richards-Kortum
,
“Raman spectroscopy for the detection of cancers and precancers,”
J. Biomed. Opt. , 1 31
–70
(1996). Google Scholar
N. J. Tao
,
G. Li
,
X. K. Chen
, and
H. Z. Cummins
,
“Low-frequency Raman scattering study of the liquid-glass transition in aqueous lithium chloride solutions,”
Phys. Rev. A , 44 6665
–6676
(1991). Google Scholar
G. Prota
,
“Progress in the chemistry of melanins and related metabolites,”
Med. Res. Rev. , 8 525
–556
(1998). Google Scholar
F. Tuinstra
and
J. L. Koenig
,
“Raman spectrum of graphite,”
J. Chem. Phys. , 53 1126
–1130
(1970). Google Scholar
M. Yoshikawa
,
N. Nagai
,
M. Matsuki
,
H. Fukuda
,
G. Katagiri
,
H. Ishida
, and
A. Ishitani
,
“Raman scattering from
sp2
carbon clusters,”
Phys. Rev. B , 46 7169
–7174
(1992). Google Scholar
R. J. Nemanich
and
S. A. Solin
,
“First- and second-order Raman scattering from finite-size crystals of graphite,”
Phys. Rev. B , 20 392
–401
(1979). Google Scholar
B. Bilinska
,
“On the structure of human hair melanins from an infrared spectroscopy analysis of their interactions with
Cu2+
ions,”
Spectrochim. Acta, Part A , 57 2525
–2533
(2001). Google Scholar
J. A. Pierce
and
D. M. Rast
,
“A comparison of native and synthetic mushroom melanins by FTIR spectroscopy,”
Phytochemistry , 39 49
–55
(1995). Google Scholar
E. Harki
,
T. Talou
, and
R. Dargent
,
“Purification, characterization and analysis of melanin extracted from Tuber melanosporum Vitt,”
Food Chem. , 58 69
–73
(1997). Google Scholar
M. Kitajima
,
“Defects in crystals studied by Raman scattering,”
Crit. Rev. Solid State Mater. Sci. , 22 275
–349
(1997). Google Scholar
|
|||||||||||||||||||||||||||||||||||||||||||||||||||||||||||||||||||||||||||||||||||||||||||||||||||||||||||||||||||||||||||||||||||||||||||||||||||||||||||||||||||||||||||||||||||||||||||||||||||||||||||||||||||||||||||||||||||||


