|
|
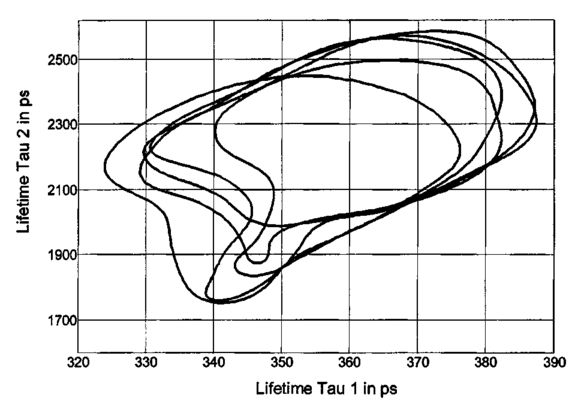
1.IntroductionMeasurements of the autofluorescence are introduced for detection of early alterations at the fundus, e.g., in age-related macular degeneration.1 2 3 4 5 These investigations are concentrated on the accumulation and spatial distribution of lipofuscin, which is assumed as an end product of the phagocytosis of receptor outer segments.6 7 A good correspondence exists in fluorescence spectra between in vivo measurements8 and measurements on isolated human lipofuscin granula.9 Besides the most intense fluorescence of lipofuscin in the pigment epithelium,10 an additional weak fluorescence was found in investigations of the fundus.8 Using different excitation and emission ranges (464 nm<λ excitation <474 nm, λ emission >505 nm and 495 nm<λ excitation <525 nm, λ emission >540 nm) additional fluorescence maxima and a shoulder were identified at 540, 580, and 600 nm in addition to the maximum of lipofuscin fluorescence at 630 nm.11 As each fluorescence maximum or shoulder points to a fluorophore, the excitation of different fluorophores is possible at the fundus. Overviews about intrinsic fluorophores are given in the literature.12 13 14 15 16 In principle, different fluorophores can be distinguished according to excitation properties, emission spectra, or by lifetime of fluorescence after short time excitation. Caused by transmission of the ocular media (cornea, lens, anterior chamber, and vitreous),17 practically, no excitation of fundus fluorophores is possible for wavelengths shorter than 400 nm. The excitation spectra of fluorophores located behind the ocular media are transformed by multiplication with the spectral characteristic of the ocular transmission.18 By this way, e.g., the excitation spectra of component VIII of lipofuscin10 and of flavinadenindinucleotide (FAD)16 are quite similar between 450 and 470 nm, making difficult a diskrimination of both fluorophores according to the excitation spectra. The determination of single fluorophores based on sum fluorescence spectra of all excited fluorophores is possible by calculating the ratio of fluorescence, detected in certain spectral ranges.19 Another way is the fit of the sum fluorescence spectrum by a model function, containing the weighted emission spectra of single fluorophores. Beside the ocular transmission, the absorption spectra of fundus substances like xanthophyll or blood change the spectral characteristic of the detected fluorescence. These influences have also to be considered in a model function for an approximation of sum spectra. All these methods require a high number of detected fluorescence photons. The most important limitation in fluorescence measurements at the human fundus is the maximal permissible exposure.20 As the quantum efficiency of the fundus fluorophores is very low,21 a long integration time or fluorescence detection from a relatively large field is required. For that reason, a two-dimensional discrimination of fluorophores, especially the determination of a weak emitting together with a strong emitting fluorophore, is practically impossible with a sufficient spatial resolution in fundus images, if fluorescence spectra are analyzed. In contrast to the detection of fluorescence spectra, lifetime measurements are independent of the fluorescence intensity. In the ophthalmic application of the layered eye fundus, the spectral absorption of a substance in front of a fluorescent layer does not change the fluorescence lifetime. The fluorescence emission from the lowest vibrational state of S1 to the electronic ground state occurs within about 10−8 s. As the properties of the embedding matrix influence the measured lifetime, changes in local viscosity or pH value can be determined. The detection of coenzymes is of special interest. Alterations in the fluorescence of nicotinamid-adenindinucleotide (NAD) and FAD indicate the oxygen requirements for energy-linked functions of mitochondria.22 Both coenzymes are electron carriers in oxidation of glucose and fatty acids.23 Very low alterations in the contribution of solved oxygen between 10−8 and about 10−7 M lead already to a transformation between reduced and oxidized pyridine nucleotide.22 The reduced form NADH is fluorescent whereas the oxidized form exhibits a weak fluorescence only. In contrast, the oxidized form of flavins is fluorescent whereas the reduced form shows very weak fluorescence.24 An excitation of reduced pyridine nucleotide is possible between 320 and 400 nm with a maximum at 366 nm. The corresponding emission spectrum is between 400 and 500 nm with maximum at 460 nm. This means, fluorescence of NADH should only weakly be excited and metabolic changes might more easily be detectable by fluorescence of flavins. The contrary behavior of fluorescence of reduced pyridine nucleotide and of oxidized flavins can be used for characterization of tissue metabolism. These signals are covered at the fundus by several other autofluorescences, e.g., of lipofuscin8 11 melanin,9 as well as of collagen or elastin in connective tissue.13 The detection of fluorescence lifetimes as fingerprint of fluorophores is a new, promising technique for fluorescence measurements on living tissue.25 The first detection of lifetime images of the autofluorescence of the living human eye fundus was also described.26 Using this technique, a very weak fluorophore can be discriminated from an intensive emitting fluorophore if their lifetimes are sufficiently different. In this article it is demonstrated that changes in the fluorescence lifetime after metabolic provocation tests point to the detection of coenzymes at the eye fundus. Furthermore, the lifetime of autofluorescence in a 20-deg macular field of healthy subjects are compared with measurements on patients, suffering from age-related macular degeneration and with isolated lipofuscin. 2.Material and Method2.1.Theoretical ConsiderationsThe expected extremely weak fluorescence signal from the fundus can be detected by applying time-correlated single-photon counting (TCSPC) in the time domain.26 27 The principle of this technique is that only one fluorescence photon is detected at a certain delay after short pulse excitation. Under the condition of detection of only 1 photon during 10 to 100 excitation cycles, which means there is a low probability for simultaneous detection of more than 1 photon, the measured function is proportional to the probability density function of the investigated process, representing the dynamic fluorescence signal.16 If more than 1 photon will be detected per excitation pulse, the lifetime will be determined systematically too short.16 So, the fluorescence intensity is detected as a function of time. All lifetimes of fluorophores in the tissue influence the detected signal and can be determined by the model approximation of the normalized fluorescence intensity: where I(t) is the measured fluorescence intensity as function of time t, Io is the fluorescence intensity at maximum, αi is the pre-exponential factor (amplitude), τi is the lifetime, and b is the background.The unknowns αi, τi, and b can be calculated by a nonlinear fit of the measurement. The goodness of a fit can be evaluated by the reduced χR 2: 16 In this equation, the squared differences between the measured values N(tk) and the expected values Nc(tk) in each time channel k are divided by N(tk) and summed over the number n of time channels. This value is reduced by the number of degrees of freedom n−p where p is the number of free parameters in the model function. Comparing this calculated reduced χR 2 with table values,28 the probability can be determined that the fit is free of systematic errors. The lower the χR 2 the higher is the probability that deviations between measured values and model function are due to random errors. In case of contribution of systematic errors, a higher value of χR 2 will be calculated and the number of lifetimes should be increased.The relative contribution qi,rel of a substance can be calculated at each fundus site according to Eq. (3): 2.2.Experimental SetupThe improved setup for lifetime mapping of autofluorescence of the eye fundus, which is approved for investigation of probands by permission number 1058-03/03 of the ethics commission of the University of Jena, has already been described.29 In short, the scheme of the experimental setup for the detection of time-resolved autofluorescence of the living fundus is shown in Fig. 1. The optomechanical basic unit is a confocal laser scanner ophthalmoscope (cLSO, Carl Zeiss, Germany). The light source is a laser diode LDH 440 (Picoquant, Berlin, Germany), emitting pulses at 446 nm of 100 ps full width at half maximum (FWHM) and in a repetition rate of 40 MHz. The laser radiation is focused by a collimator in a 10 μm fiber and led in the cLSO head. During the continuous scanning process, each fundus site is excited by series of pulses. The time-resolved autofluorescence is detected in TCSPC (SPC 730, Becker&Hickl, Berlin, Germany). The maximal count rate of this board is 3 MHz. Figure 1Setup of confocal laser scanner ophthalmoscope (cLSO) for detection of time-resolved autofluorescence in time-correlated single photon counting technique. BF-blocking filter, MCP-multichannel plate photomultiplier, PMT-photomultiplier, TCSPC-time-correlated single photon counting. 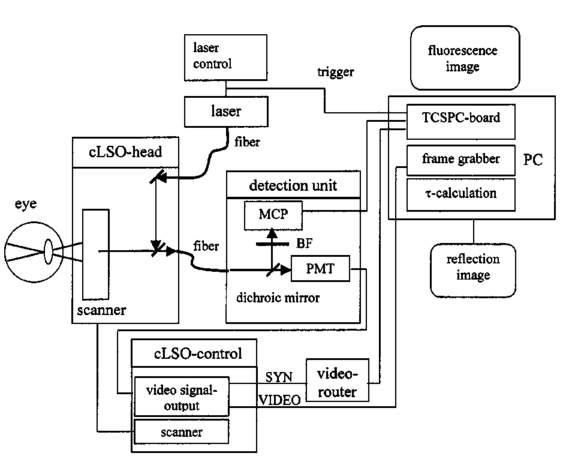 The corresponding time of 333 ns is required before a new analog-digital conversion can start. During the A/D conversion, the smallest step between time channels is 25 ps. The synchronization signal for the TCSPC is delivered by the laser diode control unit. The spatial correspondence between a scanning process and time-dependent detected fluorescence photons is accomplished by a video-router (VRT-1, Becker&Hickl, Berlin, Germany). The average radiation power in the corneal plane is maximally 60 μW, which is less than 1 of the maximal permissible exposure.20 The reflected light from the fundus and also the fluorescence light is confocally imaged onto a pinhole in the cLSO. Both parts of light are led to a separate detector unite by a 300-μm fiber. In the detector unit, a dichroic filter (DT blue, Linos, Goettingen, Germany) separates fluorescence light from reflected light, which is additionally blocked by a cutoff filter (GG 475, Linos, Goettingen, Germany). The fluorescence light is detected by a microchannel plate photomultiplier MCP-PMT (HAM-R3809U-50, Hamamatsu, Herrsching, Germany), which is sensitive between 180 and 850 nm and has jitters <50 ps. The reflected fundus light is detected by the original photomultiplier of the cLSO and grabbed as reflection images by a frame grabber (INSPECTA-4A, Mikrotron, Eching, Germany). The measurement of the dynamic autofluorescence is controlled by a custom-written program. Depending on the stability of patient fixation, the measuring time can be selected between 40 ms and 3 s for one image. For approximation by a biexponential model, a sufficient number of photons must be collected at each pixel during a series of images, taken in a time of 30 to 60 s. For compensation of eye movements between single measurements, an image registration procedure is necessary. Therefore, series of time-resolved fluorescence images will be recorded together with the corresponding reflection images. The reflection images were aligned using the retinal vascular network as landmark, and this alignment was transferred to the fluorescence images. The applied algorithm has already been described in the literature.30 2.3.ExperimentsIn all measurements, the eye pupil was dilated by Tropicamid (Pharma Stulln, Nabburg, Germany). Measurements of dynamic autofluorescence of the eye fundus are demonstrated from four healthy subjects and from two patients, suffering from dry age-related macular degeneration (AMD). Additionally, the provocation of metabolism by oxygen respiration was investigated in healthy subjects. After a baseline measurement, the effect of provocation was determined by measuring the time-resolved autofluorescence during breathing 100 oxygen for at least 6 min. Generally, images were taken in 40 deg fields, containing the optic disk, and in 20 deg images with the macula in the center. For determination of reproducibility five series were compared, each after registration of 10 single images. Each single image was taken within 2 s. Because of the limited 8 MB memory on the SPC 730 board, a compromise was found in 80 ×80 μm2 spatial resolution and 25 ps time resolution. Assuming a laser spot size of 10 μm in reflection images, after binning of 8×8 reflection pixels to one fluorescence pixel during acquisition of fluorescence images, a resolution of 80×80 μm2 is reached. This spatial resolution is in the order of diameters of retinal vessels. Each single fluorescence map contains 64×64 pixels. Caused by eye movements, the image size can be enlarged after registration of the single images. The sum of photons, collected in all time channels at any pixel, corresponds to an image of static autofluorescence.2 The program SPC Image 2.5 (Becker&Hickl, Berlin, Germany) was used for least square approximation of fluorescence decay according to Eq. (1). The instrumental response, required for signal deconvolution, was measured as time-resolved reflection at a Lambertian white standard (Spectralon, Labspere Inc., North Sutten, NH, USA) in a custom-made model eye. In this measurement, the blocking filter was replaced by a neutral density filter. The time-resolved autofluorescence at each pixel in fundus image was approximated by a biexponential model, resulting in much better fit (χR 2=1.3) than in monoexponential model (χR 2=8.5). Typical values of the photon number at maximum are 1000 photons in paramacular regions and about 4000 photons integrated over all time channels. 2.4.Evaluation of Lifetime ImagesIn fundus structures, homogeneously as well as heterogeneously distributed fluorophores must be assumed. For that reason, the resulting lifetime pairs of τ1 and τ2 are drawn in a diagram τ2 versus τ1 after fitting the decay of fluorescence at each pixel. Thus, each pixel is represented by one point in the diagram and if the sample under investigation shows a homogeneous distribution of fluorophores, this results in a certain cluster of points. Such lifetime clusters can be found, both for anatomical structures (macula, optic disk) and isolated substances. Frequency distribution29 31 of τ1 or of τ2 can be interpreted as projections of such lifetime clusters at the corresponding axis. Thus, maxima in the lifetime histograms occur at lifetimes most frequently found in the whole image or in a region of interest, which can be selected. 3.Results3.1.FitIn all measurements, a biexponential fit with 1<χR 2<2 was sufficient. The short lifetime τ1 was dominating in terms of relative amplitude at all fundus sites. In healthy subjects, the shortest values for τ1 (280 ps<τ1<380 ps) were found in the macula with relative amplitudes between 90 and 95. Figure 2 shows the biexponential approximation of a macular dynamic autofluorescence. Figure 2Approximation of a macular fluorescence decay by a bi-exponential model according to Eq. (1).  The longest values of τ1 were reached in the optic disk (500 ps<τ1<1500 ps). There, its relative amplitude decreased down to 60 to 80. The longer lifetime τ2 was determined between 2 and 5 ns with the highest values in the optic disk. 3.2.Mapping of Time-resolved AutofluorescenceAll parameters of time-resolved autofluorescence (αi,τi,qi,rel ) can be visualized two dimensionally. Most important are images of lifetimes, because they are substance specific. In maps of relative contribution of components, changes in local distribution of qi might be well suited for clinical interpretation. 3.2.1.Provocation of metabolism by oxygen breathingChanges of dynamic autofluorescence as response to oxygen breathing can be proven at the fundus both in lifetimes and in relative contribution. Figure 3 shows images of lifetime parameters of a healthy subject, breathing room air (a), during breathing oxygen for 6 min (b), and of an AMD patient under normal conditions (c). In Fig. 3, the smallest values are color-coded in blue and the highest in red. The lifetimes τ1 are presented between 300 and 600 ps, but the range of lifetimes τ2 is about one order larger in the range between 3000 and 5000 ps. In Fig. 3(a), the shortest lifetimes τ1 are calculated in the macula. The longest lifetimes τ1 appear in the optic disk. In the τ2 lifetime image, macula and optic disk are no more clearly remarkable. Considering the relative contribution q1 of the short component according to Eq. (3), lowest values are visible both in macula and in optic disk. Figure 3Effect of respiration of 100 oxygen for 6 minutes on lifetime τ1, τ2, and relative contribution q1 of a healthy subject in comparison with results of an AMD-patient, breathing air.  During breathing 100 oxygen for 6 min (Fig. 3(b)), the lifetimes τ1 are slightly longer during respiration of oxygen, indicated by color change from deep blue to light blue, but the lifetimes τ2 stay unchanged. In lifetime images it can be determined whether a substance exists or not. More information concerning the effect of metabolic provocation are visible in images of relative contribution of substances. Before oxygen breathing, the lowest relative contribution q1 was determined both in the optic disk and in the macula. During respiration of 100 oxygen, an increased relative contribution q1 after provocation of metabolism is visible by a color change to red. Only in the optic disk, a constant blue color indicates a small, unchanged relative contribution q1. More detailed information can be received when selected lifetime ranges are coded in different colors. 3.2.2.Comparison of dynamic autofluorescence in healthy subject and AMD patientAs an example of an ongoing study, the parameters of dynamic autofluorescence of one patient, suffering from nonexsudative AMD, are demonstrated in Fig. 3(c). The color code is the same as for Fig. 3(a) and Fig. 3(b). Most impressive is the global prolonged range of lifetimes τ1. Whereas in healthy persons τ1<475 ps was determined in all fundus sites outside the optic disk, in AMD τ1 was generally greater than 450 ps. In healthy subjects, the shortest range 320 ps<τ1<380 ps was detectable in the macula, but in AMD the shortest range of τ1 was determined between macula and optic disk. The autofluorescence in the AMD macula (520 ps<τ1<600 ps) was in the same range as in parts of the optic disk. The relative contribution q1 of the short component of biexponential fit is generally considerably decreased in AMD. The lowest values of q1 were determined in the macula and in the optic disk like in the healthy case, but there are considerable differences between healthy and pathological tissue. The relative contribution of q1 was determined up to 40 in the healthy macula, but only up to 25 in case of AMD. Considering the entire normal image, the maximal contribution of q1 was 65 but only 45 in AMD. 3.3.ReproducibilityFor more quantitative evaluation of lifetime measurements, the lifetime pairs τ1 and τ2, determined at each pixel in the region of interest, are drawn in a diagram τ2 versus τ1. Measurements of expected substances result in specific lifetime clusters.29 32 For testing the reproducibility of in vivo measurements, the time-resolved autofluorescence was measured in five series of 20 deg images with macula in the center. Each series contained 10 single images, taken in 2 s. After registration, about 4000 pairs of lifetimes τ2-τ1 were determined in each merged image of a series. Taking into account that the measurements were performed without any fixation target, the 70 percentile lines cover each other quite well in the lifetime range between 320 ps and 390 ps for τ1 and between 1700 ps and 2600 ps for τ2 (Fig. 4). As the optic disk was not contained in the images, no τ1 values were determined up to about 1 ns. 3.4.Lifetime Clusters of Healthy and AMD Macula in Comparison with Lipofuscin MeasurementsA comparison between lifetime measurements in 20 deg fields of the healthy and dry AMD macula with measurements on isolated human lipofuscin is demonstrated in Fig. 5. The lifetime cluster of a young healthy subject (22 years) is considerably different from the lifetime cluster of an AMD patient (87 years). Both clusters coincide only partially with lifetime cluster of isolated human lipofuscin. In contrast, the τ2-τ1 lifetime cluster of a 53-year-old man covers lipofuscin nearly completely. 4.DiscussionIt was shown that lifetime measurements of autofluorescence can be performed at the living human fundus in clinical application. Applying the time-correlated single photon counting technique in connection with scanning laser ophthalmoscopy, dynamic processes in the subnanosecond time scale can be determined within seconds. This technique requires extremely weak signals for the detection of single photons, which is optimal with respect to avoiding light damages at the eye. The achievable spatial resolution 80×80 μm2 is sufficient for the detection of local alterations in autofluorescence. Looking for short lifetime components in the retinal pigment epithelium33 after supplementation of A2E (N-retinyl-N-retinyldene-ethanolamine), 25 ps time resolution was chosen. The calculation of lifetime parameters in two-dimensional fundus images lasts only some seconds. In all considered measurements, a biexponential fit of the fluorescence decay was sufficient. Expressed by the amplitude αi, the short component τ1 (320 ps<τ1<450 ps) was dominating in relation to the long component τ2 (2000 ps<τ2<4500 ps) at all fundus sites in healthy subjects. For visual interpretation of measurements of dynamic autofluorescence, lifetime maps and images of relative contribution of components are well suited. In provocation of metabolism by respiration of 100 oxygen, a change in time-resolved autofluorescence was demonstrated. It is not known whether the autofluorescence of lipofuscin changes depending on availability of oxygen. This means, besides the expected autofluorescence of lipofuscin in retinal pigment epithelium, fluorophores are detectable whose fluorescence decay changes depending on oxygen supply. As the relative contribution of these short components increases during oxygen breathing, it might be flavins, probably bound to proteins. For free FAD, dissolved in physiological saline solution, a monoexponential decay of 2 ns was determined in separate measurements. But in this lifetime range, no alterations could be demonstrated after respiration of 100 oxygen until now. Another explanation might be that the lifetime of free flavin is quenched already by oxygen under physiological conditions. The measured macular data are in partial accordance with the decay data of flavintryptophan peptide in 50 mM sodium phosphate pH 7.0 (α1=0.92, τ1=0.33 ns, α2=0.08, τ2=3.8 ns).34 An influence of the reduced absorption of both excitation and emission light in deoxygenated blood and by constricted retinal capillaries on lifetime measurements is conceivable. Assuming no fluorescence is detectable from behind the retinal pigment epithelium, the lifetime range of the macula, where no retinal blood exists, should be extended in the perimacular range during oxygen breathing. This behavior was not observed in any of our experiments until now. It is also not known that the macular pigment xanthophyll has fluorescence properties. An influence of changes of light scattering on lifetime measurements can also be excluded. Scattering would influence predominantly the excitation light, which is inhibited by the combination of dichroic and blocking filters. A change in the shape of the excitation pulse by constriction of the equivalent thickness of retinal blood would result in time differences, which cannot be resolved by the applied technique. As the information provided by color-coded lifetime images is limited, the plot of τ2-τ1 diagrams of lifetimes in regions of interest is advised. Applying this method, substance specific clusters can be determined.29 For comparison with such clusters, a sufficient reproducibility of in vivo measurements is required. It could be demonstrated, that the 70 percentile lines of five macular 20deg images of a young healthy subject cover each other quite well in the lifetime range between 320 and 390 ps for τ1 and between 1700 and 2600 ps for τ2. The macular τ2-τ1 lifetime cluster of another young healthy subject and of a dry AMD patient are quite different and covers only partially with lipofuscin. As a much better covering of lipofuscin was determined with lifetime clusters of an older person, an accumulation of lipofuscin in the macula can be assumed with age, but in AMD the content of lipofuscin decreases. The presented new method of autofluorescence lifetime imaging might be a helpful tool in discovering early metabolic alterations, e.g., in age-related macular degeneration or in diabetic retinopathy. The detected changes in the lifetime distribution in the optic disk during oxygen provocation should also be applicable in glaucoma research. The interpretation of lifetime measurements at the healthy fundus or in case of diseases requires comparable measurements of pure substances and of cell cultures under different metabolic conditions. Despite the fact that only single examples are demonstrated, time-resolved measurements of the autofluorescence might have the potential for detection of early changes at the eye fundus, which lead to AMD. As it has to be assumed that several fluorophores are excited at the fundus, the value of lifetime measurements can at least partially be improved by applying selected excitation wavelengths or detection of emission in different spectral ranges. AcknowledgmentThis research was supported by the grant 01EZ0309 of the German Ministry for Education and Research (BMBF). REFERENCES
F. C. Delori
,
“Spectrometer for noninvasive measurement of intrinsic fluorescence and reflectance of ocular fundus,”
Appl. Opt. , 33
(31), 7439
–7452
(1994). Google Scholar
A. von Rueckmann
,
F. W. Fitzke
, and
A. C. Bird
,
“Distribution of fundus autofluorescence with a scanning laser ophthalmoscope,”
Br. J. Ophthamol. , 79 407
–412
(1995). Google Scholar
C. Bellmann
,
F. G. Holz
,
O. Schnapp
, and
H. E. Vo¨lker
,
“Topographie der Fundusautofluoreszenz mit einem neuen konfokalen Laser-Scanning-Ophthalmoskop,”
Ophthalmologe , 94 385
–391
(1997). Google Scholar
U. Solbach
,
C. Keilhauer
,
H. Knabben
, and
S. Wolf
,
“Imaging of retinal autofluorescence in patients with age-related macular degeneration,”
Retina , 17 385
–389
(1997). Google Scholar
F. G. Holz
,
C. Bellmann
,
M. Margaritidis
,
F. Schu¨tt
,
T. P. Otto
, and
H. E. Vo¨lker
,
“Patterns of increased in vivo fundus autofluorescence in the junctional zone of geographic atrophy of the retinal pigment epithelium associated with age-related macular degeneration,”
Graefe's Arch. Clin. Exp. Ophthalmol. , 237 145
–152
(1999). Google Scholar
L. Feeney
,
“Lipofuscin and melanin of human retinal pigment epithelium. Fluorescence, enzyme cytochemical and ultrastructural studies,”
Invest. Ophthalmol. Visual Sci. , 17 563
–600
(1978). Google Scholar
M. L. Katz
,
C. Drea
,
G. E. Eldred
,
H. Hess
, and
W. G. Robinson
,
“Influence of early photoreceptor degeneration on lipofuscin in the retinal pigment epithelium,”
Exp. Eye Res. , 43 561
–573
(1986). Google Scholar
F. C. Delori
,
K. C. Dorey
,
G. Staurenghi
,
O. Arend
,
D. C. Goger
, and
J. J. Weiter
,
“In vivo fluorescence of the ocular fundus exhibits retinal pigment epithelium lipofuscin characteristics,”
Invest. Ophthalmol. Visual Sci. , 36 718
–729
(1995). Google Scholar
F. Docchio
,
M. Boulton
,
R. Cubeddu
,
R. Ramponi
, and
P. D. Backer
,
“Age-related changes in the fluorescence of melanin and lipofuscin granules of the pigment epithelium: a time-resolved fluorescence spectroscopy study,”
Photochem. Photobiol. , 54
(2), 247
–253
(1991). Google Scholar
G. E. Eldred
and
M. L. Katz
,
“Fluorophores of the human retinal pigment epithelium: separation and spectral characteristics,”
Exp. Eye Res. , 47 71
–86
(1988). Google Scholar
D. Schweitzer
,
G. E. Lang
,
H. Remsch
,
B. Beuermann
,
M. Hammer
,
E. Thamm
,
C. W. Spraul
, and
G. K. Lang
,
“Die altersabha¨ngige Makulopathie—Vergleichende Untersuchungen zwischen Patienten, deren Kindern und Augengesunden,”
Ophthalmologe , 97
(2), 84
–90
(2000). Google Scholar
S. Anderson-Engels
,
J. Johansson
,
K. Svanberg
, and
S. Svanberg
,
“Fluorescence imaging and point measurements of tissue: Applications to the demarcation of malignant tumors and atherosclerotic lesions from normal tissue,”
Photochem. Photobiol. , 53
(6), 807
–814
(1991). Google Scholar
S. Anderson-Engels
,
A. Gustavson
,
J. Johansson
,
U. Stenram
,
K. Svanberg
, and
S. Svanberg
,
“Investigation of possible fluorophores in human atherosclerotic plaque,”
Lasers in Life Sciences, 5
(1–2), 1
–11
(1992). Google Scholar
R. Richards-Kortum
and
E. Sevick-Muraca
,
“Quantitative optical spectroscopy for tissue diagnosis,”
Annu. Rev. Phys. Chem. , 47 555
–606
(1996). Google Scholar
G. A. Wagnieres
,
W. M. Star
, and
B. C. Wilson
,
“In vivo fluorescence spectroscopy and imaging for oncological characterisation,”
Photochem. Photobiol. , 68
(5), 603
–632
(1998). Google Scholar
J. Pokorny
,
V. C. Smith
, and
M. Lutze
,
“Aging of the human lens,”
Appl. Opt. , 26 1437
–1440
(1987). Google Scholar
D. Schweitzer
,
A. Kolb
,
M. Hammer
, and
R. Anders
,
“Zeitaufgelo¨ste Messung der Autofluoreszenz-Ein Werkzeug zur Erfassung von Stoffwechselvorga¨ngen am Augenhintergrund,”
Ophthalmologe , 99 774
–779
(2002). Google Scholar
B. W. Pogue
,
J. D. Pitts
,
M. A. Mycek
,
R. D. Sloboda
,
C. M. Wilmot
,
J. F. Brandsema
, and
J. A. O’Hara
,
“In vivo NADH fluorescence monitoring as an assay for cellular damage in photodynamic therapy,”
Photochem. Photobiol. , 74
(6), 817
–824
(2001). Google Scholar
E. R. Gaillard
,
S. J. Atherton
,
G. E. Eldred
, and
J. Dillon
,
“Photophysical studies on human retinal lipofuscin,”
Photochem. Photobiol. , 61 448
–453
(1995). Google Scholar
B. Chance
,
“Pyridine nucleotide as an indicator of the oxygen requirements for energy-linked functions of mitochondria,”
Circ-Res., 38
(5), I31
–I38
(1976). Google Scholar
M. A. Mycek
,
K. T. Schomacker
, and
N. S. Nishioka
,
“Colonic polyp differentiation using time-resolved autofluorescence spectroscopy,”
Gastrointest Endosc , 48
(4), 390
–394
(1998). Google Scholar
D. Schweitzer
,
A. Kolb
,
M. Hammer
, and
E. Thamm
,
“Tau-mapping of the autofluorescence of the human ocular fundus,”
Proc. SPIE , 4164 79
–89
(2000). Google Scholar
D. Schweitzer
,
A. Kolb
,
M. Hammer
, and
E. Thamm
,
“Basic investigations for 2-dimensional time-resolved fluorescence measurement at the fundus,”
Int. Ophthalmol. , 23
(4–6), 399
–404
(2001). Google Scholar
D. Schweitzer
,
M. Hammer
,
F. Schweitzer
,
E. R. Gaillard
, and
F. Schu¨tt
,
“Evaluation of time-resolved autofluorescence images of the ocular fundus,”
Proc. SPIE , 5141 8
–17
(2003). Google Scholar
D. Schweitzer
,
A. Kolb
, and
M. Hammer
,
“Autofluorescence lifetime measurements in images of the human ocular fundus,”
Proc. SPIE , 4432 29
–39
(2001). Google Scholar
R. Cubeddu
,
P. Zaroni
,
D. N. Hu
,
N. Saai
,
K. Nakanishi
, and
J. E. Roberts
,
“Photophysical studies of A2E, putative precursor of lipofuscin, in human retinal pigment epithelial cells,”
Photochem. Photobiol. , 70
(2), 172
–175
(1999). Google Scholar
A. J. W. G. Visser
and
A. van Hoek
,
“The measurement of subnanosecond fluorescence decay of flavins using time-correlated photon counting and a mode-locked Ar ion laser,”
J. Biochem. Biophys. Methods , 1 195
–208
(1979). Google Scholar
|