|
|
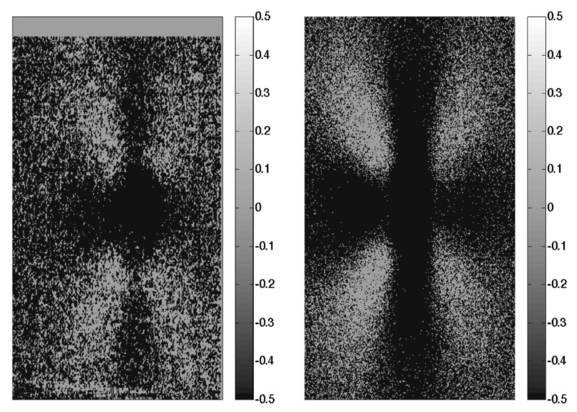
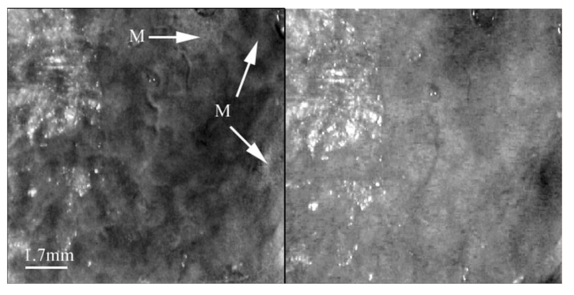
1.IntroductionPolarized light imaging has been shown1 2 to give relevant information on the borders of skin cancers that are not visible to the naked eye. Skin cancers typically originate in the superficial regions of the skin (epidermal basement membrane), where polarized light imaging is most effective. Quick assessment of skin cancer margins before Mohs surgery could guide the doctor during excision and reduce the surgery time and patient discomfort. A number of polarized light camera systems have been used in the clinic,3 4 5 6 but routine use has been limited by such factors as size, weight, cost, and poor user interface. Commercially available system such as Dermlite® photo and Dermlite® platinum (3 Gen, LLC, Dana Point, California) based on cross-polarization imaging yielded good results.7 These systems are useful for eliminating glare and shadows from the field of view but do not provide information on the backscattered degree of polarization and superficial light scattering. More complex systems based on confocal microscopy8 9 10 enable high resolution, imaging the dermis to 500 μm but with much higher equipment cost and limited portability. In this paper, a simple design is presented for a fully automatic polarized light camera system that can be held with one hand. The camera system is composed of two universal serial bus (USB) video cameras, one polarizing beamsplitter cube, and a microscope objective lens. A USB-wired mouse button on the camera enables the operator to request image acquisition. The total cost of the prototype system is approximately $350, not including the computer. The handheld device is controlled and powered through USB connections to a laptop computer. The entire system fits in a computer bag. 2.Materials and MethodsThe main components of the hand-held polarization system are visible in Fig. 1. Two USB digital cameras (Quickcam Pro3000; Logitech Inc., Fremont, California, USA, 24-bit, 8-bit per color channel) were disassembled and the CCD chips with support electronics were mounted on a Delrin mount that encased a broadband polarizing beamsplitter cube (Melles Griot, Carlsbad, California, USA). The beamsplitter cube had 0.01 nominal polarization extinction and was used to separate the two states of linear polarization, i.e., parallel and perpendicular to the orientation of the polarized source. Figure 1Main components of the handheld polarization system. The top figure shows the main components of the system: polarizing beamsplitter cube, two CCD cameras, and an objective lens. The bottom figure is a top view of the setup showing the CCD cameras attached to a Delrin support enclosing the beamsplitter cube.  Each camera had color 1/4-in. CCDs capable of acquiring 30 frames/s with an image size of 640×480 pixels. An interchangeable objective lens enabled different magnifications. An objective lens (PL 4/0.1) mounted at a distance of 5 cm from the front of the beamsplitter cube was the most commonly used imaging assembly. This lens sets the camera’s field of view at 1.5×1.2 cm. The CCDs and beamsplitter cube were encased in an ergonomic plastic sphere, as shown in Fig. 2. The spherical case protected the components and supported the light source and the focal distance assembly. Figure 2Clinical handheld polarization system; spherical casing protects the main components and makes the prototype easy to hold with one hand.  The polarized light source was constructed using three ultrabright white LEDs mounted on an acrylic support. The LEDs were battery powered by three AA batteries stored in a compartment in the bottom of the sphere. LED light was linearly polarized parallel to the source-sample-detector plane by a sheet polarizer of extinction 0.0001 (Hinds Inc., Portland, Oregon). The light source assembly was oriented at approximately 30 deg to the objective lens axis to avoid glare. A fixed distance between the imaging plane and the cameras was maintained using an adjustable acrylic support with a mount for a glass microscope cover slip that constituted an optical flat. During operation, the glass cover slip was placed in contact with the skin. A drop of water was used to minimize tissue-air-glass reflections. The USB cameras were connected to a 667-MHz PowerBook laptop (Apple Computer Inc., Cupertino, California, Model A1001). The controlling software was written in C starting from the QuickTime Software Development Kit11 12 (SDK). QuickTime is a system-level code package available on most computers that support multimedia tasks. Images were acquired sequentially from two devices, camera 1 and camera 2. Camera parameters such as gain, shutter aperture, and window orientation were modifiable through a user menu. During experiments, the gain was fixed and the shutter aperture was kept equal for both cameras. After streaming from the two cameras, every frame was decompressed. The separate frames were aligned (pixel shift respectively Δx=10 pixel Δy=13 pixels) in the software. A polarized image Pol was calculated at each pixel in the red, green and blue channels: where parallel is the image from camera 1 and perpendicular is the image from camera 2 (Fig. 1). A composite color image was generated from the three Pol images and displayed on screen. Alternatively, either the red, green, or blue Pol image could be displayed on the screen by pressing the R, G, or B key on the computer. A second window on the screen displayed the original color parallel image to facilitate camera positioning.The maximum frame rate to display the polarized light image in a full size window (400×400 pixels) was 7 frames/s. The frame rate could be improved by decreasing the image size. When the window was 250×250 pixels the frame rate increased to 15 frames/s. The software enabled the user to average up to 20 Pol images before displaying the results on screen. Images were on 256 gray levels, typical polarized images intensities were from 20 to 80 counts. The operator could save a desired image by pressing the USB mouse button on the camera. Images were saved in the Apple PICT image format. Acrylamide gels were used as standards. Gels were prepared with Intralipid (Liposin II, Abbott Laboratories, North Chicago, Illinois) and India ink (No. 4415, Higgs, Lewisburg, Tennessee) to illustrate the variability of polarization and reflectance in an amorphous sample. The concentration of the Intralipid was 3.5 (gram lipid/ml solution times 100). The gels were prepared with acrylamide solution (40 concentration) and water to a final volume of 100 ml (4 cm height and 5 cm diameter). The absorption coefficient of the gel was μa=1 cm −1 and the scattering coefficient μs=3 cm −1. 2.1.System CalibrationExperiments were conducted to test the performance of the cameras and polarizing optics. 2.1.1.Camera dark noiseThis test was performed with the camera software shutter off. The test was performed in the dark and dark images were captured at increasing time intervals. Camera streaming was interrupted only during an image save. The camera was run for 2 h, although typical clinical use of the camera is much briefer. The 12 captured images were processed using MATLAB software. The mean and standard deviation was calculated for 400×400×12=192,000 image pixels, for the three (red, green, and blue) images. The blue channel dark noise was the highest at 31 counts (standard deviation=3 counts) where full-scale response ranged from 0 to 255 counts. The red and green channels dark noise was 15 counts (standard deviation=3 counts). For all channels, dark noise did not vary over time, enabling us to subtract it from the acquired images programmatically. For comparison the same dark noise experiments were performed for a 16-bit digital camera electronically cooled camera (Roper Scientific, Tucson, Arizona). The dark noise was approximately 500 counts where the full-scale response ranged from 1 to 65,453. 2.1.2.Camera repeatabilityThis test was performed to establish the pixel-to-pixel variation during multiple acquisitions. The target was a checkerboard consisting of dark black squares and bright white squares. A group of 20 images of the checkerboard was captured over a 10-min period. The variability from image to image was analyzed using MATLAB. Different pixel locations were chosen on the images. For every pixel location in both black and white squares, the standard deviation of the 20 images was calculated and was less than 3 counts, showing the degree of image-to-image repeatability. A similar test performed with the 16-bit digital camera gave a pixel-pixel variation of 20 counts. Once again the scientific camera outperformed the cheap USB cameras. Currently small scientific 8-bit digital cameras are being considered to replace the USB camera in the design of a better prototype. 2.1.3.Polarization opticsThe performances of the polarizing beamsplitter and source polarizer were tested in transmission mode. The polarized white light source was positioned in front of the handheld system behind a linear polarization filter (Ealing Inc., Rocklin, California) with its polarization axis aligned parallel to the beamsplitter horizontal axis. The source polarizer was rotated in 10-deg intervals. At each angle two images were collected: one with camera 1 (parallel) and one with camera 2 (perpendicular). The transmitted light beam filled most of the cameras’ field of view. The pixel intensity counts of the central 100×100 pixels were selected to eliminate any beam shape artifact. Dark noise was subtracted from every image. Results are shown in Fig. 3. The mean and standard deviation of all three camera channels, red diamonds, green crosses, and blue circles are plotted versus the source polarization angle. The data were normalized by the incident 0-deg value for camera 1 and incident 90-deg value for camera 2. The experimental data was modeled with Malus’ law: I=cos 2 θ, where θ is the source polarization angle. The model appear as lines in Fig. 3.Figure 3Performance test for polarized optics. The x axis denotes the angle of orientation of the linear polarization of the light source (0 denotes parallel to horizontal axis of beamsplitter). The y axis denotes the detected intensity for the red, green and blue channels of the two cameras (at x axis equal to 0, the parallel CCD 1 camera sees maximum light and the perpendicular CCD 2 camera sees minimum light).  2.1.4.Backscatter from microsphere solutionsA solution of 2-μm-diameter microspheres (Fullam Inc., Latham, New York) was diluted until the scattering coefficient was equal to 29 cm−1. The concentration was confirmed with submerged optical fiber measurements of the lateral diffusion of light from a point source as a function of distance from the source.13 A rectangular cuvette with an optical path-length of 1.2 cm was filled with the diluted solution. A red He-Ne laser (Melles Griot, Carlsbad, California, USA) was used for the experiment. The laser beam had a nominal wavelength of 632.8 nm, the beam size was 2 mm and was polarized parallel to the optical bench and the horizontal axis of the beamsplitter. The beam illuminated the cuvette at 10 deg relative to the cuvette normal. The polarized system was located normal to the cuvette. The image of the polarized image of light reflected from the microsphere solution is shown on the left-hand side of Fig. 4. The right side shows the results of a Monte Carlo simulation for this experiment. The Monte Carlo image was obtained with a code14 that keeps track of the polarization of the photon after every scattering event. For the Monte Carlo program, a slab geometry was used that did not consider the air-glass interface, which might explain the discrepancies between model and experiment. The structure of the Monte Carlo program was similar to the one written by Kattawar and Plass, described in Ref. 15. Note that 107 photons were used for the simulation. In both images, a Maltese cross scattering pattern was clearly observed and is typical of this kind of experiment. 3.ResultsClinical studies were conducted at the Department of Dermatology, Oregon Health & Science University. Consent to take part in this study was obtained from all patients. A study protocol was defined and approved by the Hospital IRB Committee. Detailed written and oral information on the protocol was given to the patients prior to enrollment. The measurements extended the dermatoscopic procedure by an average of 10 min. Images of different skin lesions were captured minutes before Mohs surgery. All images reported were in 256 gray levels. Figures 5(a) and 5(b) are images of a melanoma in situ. The image in Fig. 5(a) was obtained with the parallel polarized camera and normalized by the average pixel value of an image of an epoxy standard and multiplied by 0.65 to yield reflectance. The epoxy standard had 65 calibrated reflectance across the visible wavelength spectrum corresponding to 180 counts. Figure 5(a) Normal image of melanoma in situ. Each pixel of the reflectance image was normalized by the average value of a 65 reflectance standard and multiplied by 0.65. White squares denote regions of interest, nonpigmented/amelanotic (N), and melanotic (M), from which data for Fig. 6 are collected. (b) Polarized image of melanoma. White squares denote regions of interest, nonpigmented/amelanotic (N), and melanoma (M), from which data for Fig. 7 are collected. In this image, the gray-scale levels are 256. 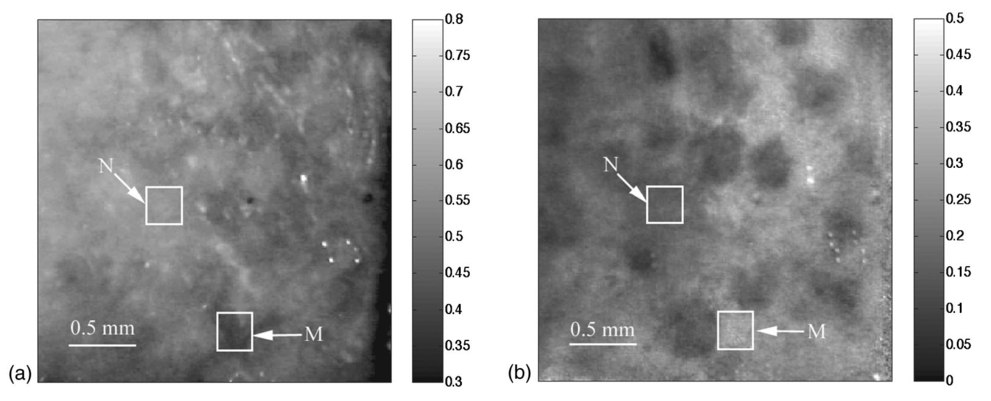 Figure 6Probability density functions p(Pol,R) showing the distribution of pixel values versus Pol and R for the visible melanin skin site (M), the nonpigmented normal skin site (N), and the standard gel (G). The p(Pol,R), in units of (R−1 Pol −1), is normalized such that the integral of p(Pol,R) for each sample is unity. The greater variation in Pol relative to R for the melanotic site (M) indicates how Pol images present more texture in an image of a variegated melanotic skin lesion.  Figure 7Image of a nevus. The apparent textural structure of the nevus is visible in the polarized image on the left, the gray-scale levels of the polarized image were 256. The normal image on the right does not show this structure. 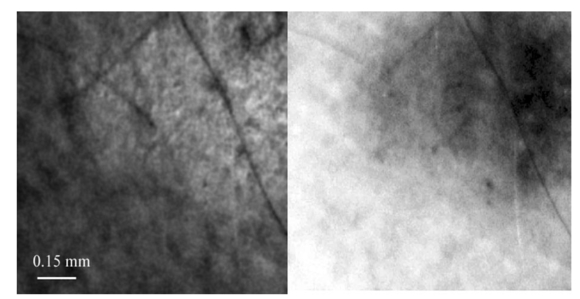 Melanoma is comprised of abnormal proliferation of the melanocytes, the melanin pigment producing cells in the skin. Melanosomes are organelles that contain melanin. The polarized regions with melanin pigmentation are whiter than the amelanotic regions. The whiter regions correspond to the more darkly pigmented globules in the normal image and likely correlate with cluster/nests of melanocytes. In the normal image, only gray shades are visible. To illustrate the potential of the camera system two regions of interest were selected in both Figs. 5(a) and 5(b), as indicated by the squared areas demarcated by white contour lines corresponding to nonpigmented tissue (N) and melanotic (M). The pixel values for Pol and reflectance within the two regions of interest are cross-plotted in Fig. 6. The values of reflectance for a visually normal area (N) are in the 60 range while the values for the melanotic areas (M) are around 45. The variation of Pol and R for the amorphous gel sample indicate the noise level in the camera system. The normal skin site presented a slightly greater range of Pol and R values indicating the natural variation for that skin site. The melanin skin site presented the largest variation in Pol and R values, with Pol variation greater than the R variation. The R values of the melanin site were lower due to increased melanin content. The increase in Pol for the melanin site is presumably due to the backscatter of polarized light from the melanosomes. The melanin and normal tissues are distinguished on the basis of both Pol and R, with R providing better contrast than Pol. To simply identify melanin in a skin site, R is better than Pol. However, Pol images present more texture in the images. Texture is represented in Fig. 6 by a greater range of variation in the Pol values relative to the R values. The texture of the melanotic lesion is greater than the texture of the normal skin site. The Pol image offers a better presentation of the variegation of the melanotic lesion. Figure 7 shows images of a nevus from a forearm. The polarized image is shown on the left and the unpolarized image on the right. In the polarized image the nevus appears white and the background tissue appears dark gray. The structure of the nevus appears hilly and nonuniform. These structures are not visible in the unpolarized image. Figure 8 shows a squamous cell carcinoma before excision. On the left is the polarized image, and on the right is the normal image. In the normal image are visible specular artifacts (white spots) due to air bubbles between the skin and the optical flat. Figure 8Polarized (left) and normal (right) images of a squamous cell carcinoma on a patient’s upper lip. The gray-scale levels of the polarized image were 256. 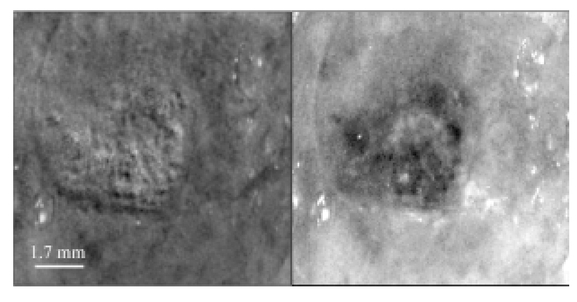 Figure 9 shows another melanoma image. In the polarized image, branches of spreading melanoma are visible, while in the normal image the melanoma is visible as darker areas. 4.DiscussionA handheld device was described that can quickly collect polarized light images. Most of the device’s parts are available at any computer store. The device costs approximately $350. Although its performance is not as good as a cooled 16-bit camera,3 the resulting images contain enough contrast for a preliminary diagnosis of skin cancer margins. Since USB video performance is continuously improving, the gap between bench-top prototypes and handheld devices of this kind is bound to decrease rapidly. AcknowledgmentsThe authors would like to acknowledge Dr. Paulo R. Bargo for his help in the design of the backscattering from microsphere test. This research was supported by the National Institute of Health Grants ROI-CA80985 and R24-EB000224 (S. L. Jacques). REFERENCES
R. R. Anderson
,
“Polarized light examination and photography of the skin,”
Arch. Dermatol. , 127 1000
–1005
(1991). Google Scholar
S. L. Jacques
,
J. Roman
, and
K. Lee
,
“Imaging superficial tissues with polarized light,”
Lasers Surg. Med. , 26 119
–129
(2000). Google Scholar
S. L. Jacques
,
J. C. Ramella-Roman
, and
K. Lee
,
“Imaging skin pathology with polarized light,”
J. Biomed. Opt. , 7
(3), 329
–340
(2002). Google Scholar
M. H. Smith
,
P. Burke
,
A. Lompado
,
E. Tanner
, and
L. W. Hillman
,
“Mueller matrix imaging polarimetry in dermatology,”
Proc. SPIE , 3911 210
–217
(2000). Google Scholar
J. A. Muccini
,
N. Kollias
,
S. B. Phillips
,
R. R. Anderson
,
A. J. Sober
,
M. J. Stiller
, and
L. A. Drake
,
“Polarized light photography in the evaluation of photoaging,”
J. Am. Acad. Dermatol. , 33 765
–769
(1995). Google Scholar
S. Gonzalez
,
M. Rajadhyaksha
, and
R. R. Anderson
,
“Non-invasive (real-time) imaging of histologic margin of a proliferative skin lesion in vivo,”
J. Invest. Dermatol. , 111
(3), 538
–539
(1998). Google Scholar
G. Argenziano
,
G. Fabbrocini
,
P. Carli
,
V. De Giorgi
,
E. Sammarco
, and
M. Delfino
,
“Epiluminescence microscopy for the diagnosis of doubtful melanocytic skin lesions,”
Arch. Dermatol. , 134 1563
–1570
(1998). Google Scholar
R. Langley
,
M. Rajadhyaksha
,
P. Dwyer
,
A. Sober
,
T. Flotte
, and
R. R. Anderson
,
“Confocal scanning laser microscopy of benign and malignant melanocytic skin lesions in vivo,”
J. Am. Acad. Dermatol. , 45 365
–376
(2001). Google Scholar
S. Gonza´lez
,
R. Sackstein
,
R. R. Anderson
, and
M. Rajadhyaksha
,
“Real-time evidence of in vivo leukocyte trafficking in human skin by reflectance confocal microscopy,”
J. Invest. Dermatol. , 117 384
–386
(2001). Google Scholar
K. Busam
,
K. Hester
,
C. Charles
,
D. Sachs
,
C. Antonescu
,
S. Gonza´lez
, and
A. Halpern
,
“Detection of clinically amelanotic malignant melanoma and assessment of its margins by in vivo confocal scanning laser microscopy (CSLM),”
Arch. Dermatol. , 137 923
–929
(2001). Google Scholar
P. R. Bargo
,
S. A. Prahl
, and
S. L. Jacques
,
“Optical properties effects upon the collection efficiency of optical fibers in different probe configurations,”
IEEE J. Sel. Top. Quantum Electron. , 9
(2), 314
–321
(2003). Google Scholar
G. W. Kattawar
and
G. N. Plass
,
“Radiance and polarization of multiple scattered light from haze and clouds,”
Appl. Opt. , 7
(8), 1519
–1527
(1968). Google Scholar
|