
|
|
1.IntroductionWith recent advances in optics and medicine, it is becoming increasingly more important to acquire rapid and accurate measurements of light propagation from the tissue surface and, using those measurements, infer the physiology of the underlying tissue. Successful near-infrared (NIR) optical imaging necessitates the accurate collection of diffusely propagated light at the tissue surface as well as an optimization approach to recover or map the optical properties of the underlying tissue volume. The study of light propagation through turbid media can broadly be divided into one of two classes: steady-state or continuous wave (cw) techniques, and time-resolved approaches, either in the time domain [time-domain photon migration (TDPM)] or in the frequency domain [frequency domain photon migration (FDPM)]. Steady-state techniques employ a light source whose intensity is constant in time. In these techniques, the spatially resolved diffuse reflectance may be used with the steady-state diffusion equation to obtain estimates of the optical properties.1 2 3 4 On the other hand, time-resolved techniques, as the name implies, measure the optical response of a system to a light source whose intensity varies in time. Time-domain techniques employ ultra-fast light pulses (on the order of femto- to picosecond) to irradiate the medium under investigation, and photon counting or gated detectors to capture the broadened and attenuated pulse some distance away from the source. The measured pulse shape may then be fitted to a theoretical expression to obtain the absorption and scattering coefficients.4 5 In frequency-domain approaches, the light source intensity is modulated at high frequencies (on the order of MHz) and a phase-sensitive detector is used to measure the amplitude attenuated, phase-shifted light signal. The characteristics of the detected light wave may then be used to determine the absorption and scattering coefficients of the medium.6 7 8 9 10 11 12 13 14 15 In many cases, the measurements used to determine the optical properties of turbid media are obtained using an infinite media geometry in which the source light and detected light, delivered and captured via fiber optics, are located deep within the media.6 7 8 9 10 11 15 Certainly the determination of optical properties has applications outside medical imaging for which the infinite geometry is well suited. However, for applications in medical imaging, the infinite media geometry is hardly applicable. Thus, the determination of optical properties requires a more relevant half-space or semi-infinite geometry.4 5 11 12 13 14 15 Furthermore, the measurements must be rapid to ensure that data collection concludes within a clinically acceptable time frame. Finally, tomographic imaging requires accurate acquisition of time-dependent measurements at the tissue boundary for successful recovery of the interior optical property map. To this end we have developed an intensified charge-coupled device (ICCD) imaging system, operated in the frequency domain, capable of acquiring rapid and accurate area measurements of photon migration.16 17 18 Herein, we demonstrate the use of the system to obtain estimates of the optical properties of homogenous turbid media to demonstrate the system’s accuracy. The results compare favorably to estimates obtained via the well-characterized conventional FDPM technique employing a single point of illumination and point of collection, and further validate the ICCD detection system and its capacity to obtain frequency-domain data. To the authors’ knowledge, this study presents the first time that frequency-domain measurements, obtained using an imaging detector of the form of an ICCD camera system, have been employed to determine the absorption and reduced scattering coefficients of turbid media. In the following sections, we first review diffusion theory of light propagation in turbid media to establish the theoretical framework. Next, we describe our experimental method, including the scattering media investigated and the instrumentation used for the acquisition of frequency-domain data across the area of the imaging detector. We also detail our data analysis procedure. Finally, we present our experimental results and compare them with the results obtained from well-characterized, conventional frequency-domain measurements to demonstrate the validity of the technique. 2.TheoryDiffusion theory is often used to describe the time-dependent photon passage through turbid or highly scattering media and often finds applicability in studies of time-domain photon migration, where source light is launched as ultra-short pulses and photon detection is achieved as a function of time and position. Additionally, for studies of frequency-domain photon migration, where the incident source light intensity is sinusoidally modulated, an adequate description of photon migration is provided by the well-known diffusion equation: Here, i is the principal square root of −1, c is the speed of light in the medium, Φ(r,ω) is the ac photon fluence rate at position r and angular modulation frequency ω, S(r,ω) is the isotropic photon source density, and D is the diffusion coefficient defined by: where μs and μa are the inverses of the mean free paths for scattering and absorption, and are known as the scattering and absorption coefficients, respectively, μs ′ is known as the reduced scattering coefficient, and g is the mean cosine of the scattering angle.2.1.Analytical Solutions to the Diffusion EquationFor infinite and semi-infinite media geometries, the diffusion equation may be solved analytically to obtain an expression for the photon fluence rate. We follow the method of Haskell et al.; and apply the extrapolated boundary condition to solve for the ac photon fluence rate at the surface.15 This boundary condition states that the photon fluence rate goes to zero at some fictitious boundary located a distance ls above the physical surface, with ls defined as: where R eff is the effective reflection coefficient and represents the fraction of photons that is internally reflected at the boundary. R eff is a function of the refractive indices (ni) of the turbid media and surroundings and has a value of 0.431 for a refractive index mismatch typical of a water-air interface (n water /n air =1.33). The expression for the surface ac photon fluence rate may then be expressed as: where S is a complex number representative of the source ac strength (S ac ) and phase (θs), such that, and r1 and r2 are the distances from the point of interest to the true source located just beneath the surface and to the image source introduced to satisfy the boundary condition, respectively, and ρ is equivalent to the projection of r1 and r2 onto the surface, such that (Fig. 1),Figure 1Schematic depicting the semi-infinite model. The true source is located a distance of one mean free path length (3D) below the surface of the medium, while the image source is located a distance of 2ls+3D above the surface to create a net-zero fluence at the extrapolated boundary located a distance of ls above the surface. The true source and image source are located a distance of r1 and r2, respectively, from the detector, and ρ is the projection of r1 and r2 onto the surface.  A case of particular importance and pertinent to this report involves a reflectance geometry detection scheme, where the source and detected light are located on the same surface. In this case, the detected signal or the diffuse reflectance, denoted by R, is that portion of the diffuse light that is transmitted through the surface and captured by the detector. It can be shown that the diffuse reflectance is proportional to the photon fluence rate at the surface:15 where A is a proportionality constant equivalent to:15 Here, αo is equal to one-half of the detector acceptance angle and R Fresnel , the Fresnel reflection coefficient, is a function of the refractive indices of the turbid media and surroundings. For a system with a refractive index mismatch of 1.33, and a detector with a large acceptance angle (such as a camera, such that αo is approximately π/2), A has a value of 0.199. Thus, when Eqs. (4) and (9) are applied to Eq. (8), one obtains an analytical expression for the diffuse reflectance at the medium surface:Several approaches may be applied to determine the optical parameters of a semi-infinite media given frequency domain measurements. In one such approach, ρ is fixed and measurements are obtained as a function of ω. Alternatively, measurements may be obtained for a fixed ω as a function of ρ. Finally, a technique that utilizes both a fixed modulation frequency and a fixed separation distance sequentially may be applied. An algorithm based on the measurement approach applied and the analytical solution to the diffusion approximation may then be used to regress the unknown optical properties. The imaging system described here is capable of obtaining data at a number of modulation frequencies. However, its capacity to obtain measurements simultaneously from an area of the medium surface makes it convenient to obtain frequency-domain data for multiple values of ρ simultaneously at a fixed frequency. Thus, we focus on a frequency-domain method that employs a fixed modulation frequency and measurements obtained at a number of distances from the source to determine unknown optical parameters of scattering media. 2.2.Absolute Versus Relative MeasurementsIn the frequency domain, the measured quantities are the steady-state reflectance or dc amplitude, denoted by I dc , the modulation or ac amplitude, denoted I ac , and the phase angle between the source and detector, θ. These quantities are related to the diffuse reflectance by the following expression: where I ac (ρ,ω) is the modulus of the diffuse reflectance, and θ(ρ,ω) is the argument of the diffuse reflectance. Consequently, the steady-state reflectance, modulation amplitude, and the phase angle are found via the following relationships: where IMAG[R(ρ,ω)] and REAL[R(ρ,ω)] refer to the imaginary and real components of the diffuse reflectance, respectively, and R(ρ,ω) is the diffuse reflectance defined by Eq. (10). Thus, given the distance from the source, angular modulation frequency, and optical properties of the medium, Eqs. (12), (13), and (14), when applied to the analytical expression for the diffuse reflectance, may be used to obtain theoretical or predicted values of steady-state reflectance, modulation amplitude, and phase angle.Moreover, frequency-domain measurements may be absolute or relative. If absolute measurements are to be used, the proportionality constant A needs to be determined. An additional calibration experiment must also be performed to characterize the source ac strength and phase, since the quantity S appears in the analytical solution for the photon fluence rate. On the other hand, since the diffuse reflectance is a linear function in both the quantities A and S, dividing the diffuse reflectance obtained at one position by a measurement obtained at a second reference position cancels both quantities and obviates the need to calculate the proportionality constant and characterize the source. Hence, relative FDPM measurements may be calculated using the relationships: where the superscript rel denotes relative measurements, ρ ref represents the distance from the source at some reference position, and R(ρ,ω) is the diffuse reflectance defined by Eq. (10).A second, perhaps greater advantage to using relative data for the determination of optical properties involves the uniqueness of the derived optical parameters. Kienle and Patterson previously demonstrated that the determination of optical properties is not unique if absolute measurements of steady-state reflectance are used.14 Figure 2(a) presents a contour plot of the steady-state diffuse reflectance typical of measurements obtained from an air-water interface using a detector with a large numerical aperture, (i.e., n water /n air =1.33, R eff =0.431, A=0.199) , obtained using Eq. (12), versus the absorption and reduced scattering coefficients for ρ=0.5 cm. The value S, representative of the source, was further assumed to equal unity. From the plot it is evident that for certain fixed values of the absorption coefficient, two separate values of the reduced scattering coefficient will yield the same steady-state diffuse reflectance. Similarly, Figs. 2(b) and 2(c) demonstrate that for certain values of the absorption coefficient, multiple values of the reduced scattering coefficient can produce the same value of the ac amplitude and phase angle [computed using Eqs. (13) and (14), with ω=2π×(100 MHz)]. As a result, the determined optical properties will be nonunique if absolute measurements of steady-state reflectance, ac amplitude, or phase angle are used alone or if a combination of absolute measurements are employed [i.e., superimposing Figs. 2(a), 2(b), and 2(c) still results in multiple pairs of absorption and scattering coefficients that yield the same results]. Figure 2Contour plots of (a) steady-state diffuse reflectance (cm −2), (b) ac amplitude (cm −2), and (c) phase angle. Values were obtained using Eqs. (12), (13), (14) and (10) with ρ=0.5 cm and ω=2π×(100 MHz).  On the other hand, the use of relative measurements leads to the determination of a unique set of optical parameters. Figures 3(a) 3(b), and 3(c) display contour plots of normalized steady-state reflectance, normalized ac amplitude, and referenced phase angle, respectively, versus the absorption and reduced scattering coefficients. The values were calculated using Eqs. (15), (16), and (17) for ρ=1.0 cm and normalized or referenced to those obtained at a distance of ρ ref =0.5 cm. As in Fig. 2, the effective reflection coefficient was assigned a value of R eff =0.431, and the angular modulation frequency was set to ω=2π×(100 MHz), but no assumption about the source was necessary and the proportionality constant A was not required in the calculation. The plots in Fig. 3 demonstrate that for any fixed value of the absorption coefficient, there exists only one value of the reduced scattering coefficient that will yield a given value of normalized steady-state reflectance, normalized ac amplitude, or referenced phase angle. As a result, relative measurements of steady-state reflectance, ac amplitude, or phase angle may be used alone or in combination to determine a unique pair of optical properties. Figure 3Contour plots of (a) normalized steady-state diffuse reflectance, (b) normalized ac amplitude, and (c) referenced phase angle. Values were obtained using Eqs. (15), (16), (17), and (10) with ρ=1.0 cm, ρ ref =0.5 cm, and ω=2π×(100 MHz).  The following section describes the instrumentation, experimental setup, and experimental method employed for data acquisition, as well as details of the data analysis procedure used to obtain the final estimates of the optical properties of the turbid media investigated. 3.Materials and Methods3.1.InstrumentationThe frequency-domain imaging system has been described previously in detail.17 18 Hence, we only point out the salient features. Modulated light of 785 nm provided by a laser diode (Sanyo, model DL7140-201, Allendale, New Jersey) was launched onto the surface of the medium under investigation via a 1000-μm optical fiber. The fiber was positioned perpendicularly such that the tip just touched the medium surface. A laser diode driver (ThorLabs, model LDC500, Newton, New Jersey) provided the diode with 50-mA of dc current while a temperature controller (ThorLabs, model TEC2000, Newton, New Jersey) helped maintain a constant lasing wavelength. A 100-MHz ac signal of +13-dBM rf power, provided by a frequency synthesizer (Marconi Instruments, model 2022D, United Kingdom), was superimposed onto the constant dc bias of the laser diode. Consequently, the diode delivered approximately 48 mW of optical power to the source fiber. A 16-bit CCD camera (Photometrics, model CH350/L, Tucson, Arizona) coupled to an image intensifier via a 105-mm lens functioned as an area detector of the re-emitted light. A circular image of the medium surface of approximately 3.4 cm diam was focused onto the photocathode of the image intensifier with a 50-mm lens. A neutral density filter was positioned prior to the 50-mm lens to prevent saturation of the CCD. A second frequency synthesizer (Programmed Test Sources, model PTS-310, Littleton, Maryland) provided an ac signal of +13 dBM, further amplified to +40 -dBM, using an external amplifier (ENI, model 604L, Rochester, New York), that was used to modulate the photocathode of the intensifier at 100 MHz. The synthesizers are phase locked to maintain a constant programmable phase offset. Because both source and detector are modulated at the same frequency, a homodyne data acquisition technique is employed to facilitate the collection of frequency domain data. The phase offset between frequency generators is swept through a 2π cycle to obtain phase sensitive intensity images that are subsequently used in a fast Fourier transform (FFT) analysis to obtain the quantities of steady-state diffuse reflectance, amplitude modulation, and phase angle (for a detailed description see Ref. 17). Data acquisition and instrumentation control is performed on a personal computer equipped with V++ imaging software (Digital Optics, Auckland, New Zealand). A schematic of the instrumentation is provided in Fig. 4. Figure 4Frequency-domain ICCD imaging system. The source light provided by a laser diode (LD) is delivered through an optical fiber to the medium surface. The re-emitted light passes through a neutral density filter (F) before being focused onto the photocathode of the image intensifier (I) by a lens (L 1). The intensifier is optically coupled via a lens (L 2) to a CCD camera (C), which acquires and digitizes the images. A frequency synthesizer (S 1) provides an rf signal, further amplified by an external amplifier (A), that modulates the intensifier photocathode at 100 MHz. A second synthesizer (S 2) modulates the laser diode at the same 100-MHz frequency. 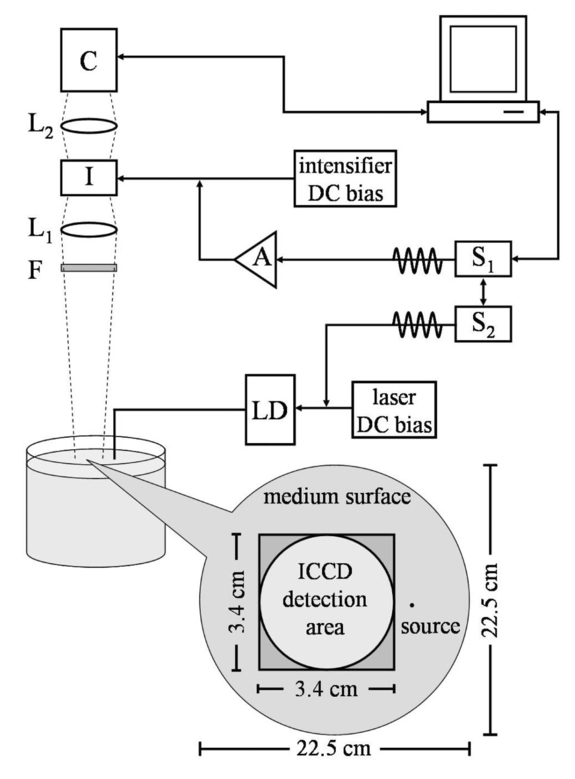 3.2.Scattering MediaThe scattering media was composed of 20 Liposyn (Abott Laboratories, Chicago, Illinois) diluted with distilled, deionized water to a final volume percent of 0.5, 1.0, and 2.0 to vary the degree of scattering. The reduced scattering coefficients of the turbid media were measured using the conventional frequency-domain technique employing a single point of illumination and detection in infinite media as described elsewhere,10 and agree well with previously published reports.19 20 Additionally, India ink dye (Pro Art, Mount Laurel, New Jersey) was added in various concentrations to vary the extent of light absorption.21 The extinction coefficient for the India ink was determined using dilute samples in a standard spectrophotometer (SPEX FluoroLog, Jobin Yvon, Incorporated, Edison, New Jersey) and Beer’s law calculations. We found it to have a value of ε785 nm ink =1.12 cm −1(vol)−1. The absorption coefficient due to the ink at 785 nm can then be calculated as: Using Eq. (18), it is possible to calculate the increase in the absorption coefficient as a result of added India ink dye as μa=μa ink +μa o, where μa o represents the absorption prior to the addition of the dye. To vary the final absorption coefficient, the concentration of ink was adjusted between 0 and 0.07 by volume and no change in scattering was measured, as expected for these low concentrations of added ink. Hence, a total of nine solutions was investigated. Table 1 summarizes the composition of the nine solutions investigated.Table 1
3.3.Experimental MethodA cylindrical container constructed from clear acrylic with a diameter of 22.5 cm housed the Liposyn-ink solutions during the experiment. The container was filled with the solution to a depth of approximately 10.5 cm, yielding a final volume of approximately 4 L. With the source fiber located on the medium surface and the ICCD imager positioned to acquire images from the clear cylindrical sides of the acrylic container, we verified the validity of a semi-infinite medium, as we were unable to detect any re-emitted light from the sides of the container. Just prior to the start of each experiment, an image was acquired of a grid to determine the field of view and the exact location of the fiber optic with respect to it. The acrylic container was then filled with a well mixed Liposyn-ink solution until the surface just touched the fiber tip. The frequency-domain imaging procedure then commenced. A total of nine images were acquired at each of 32 equally spaced phase delays between the synthesizers modulating the light source and the detector. With a 400-msec exposure per image, data acquisition time totaled approximately 2 min [(exposure time/image)×(images/phase delay)×(number of phase delays)]. Hence, although the solution was well stirred prior to each experiment, there was little concern of the solution settling due to the duration of the data acquisition. The procedure was repeated for all the solutions investigated. 3.4.Data AnalysisFrequency-domain data were extracted from the phase sensitive images of the medium surface via a FFT procedure described in detail elsewhere.17 The nine images obtained per phase delay yielded nine independent area measurements of steady-state reflectance, modulation amplitude, and phase angle per investigational medium studied. The standard deviations of the nine measurements were computed for use in the nonlinear least-squares algorithm discussed later. Having previously determined the position of the source with respect to the field of view, the data were then sorted into radial bins centered on the source (Fig. 5). The width of each bin was 1000 μm, equivalent to the diameter of the source fiber. Data within each bin were averaged to yield one measurement corresponding to its surface-projected distance from the source ρ. The first or shortest distance determined ρref, the reference position, and subsequent measurements of steady-state reflectance, amplitude modulation, and phase angle were made relative to the measurements obtained at this position. In all cases we ensured that this first position was located at least 10 mean free path lengths from the source to preserve the validity of the diffusion approximation. Figure 5Schematic of the radial binning procedure. (a) A total of m area measurements of I dc , I ac , and θ are (b) sorted into radial bins of width Δr=1000 μm. (c) Data within each bin are averaged to yield a single measurement corresponding to a projected distance from the source ρ. The number of area measurements m is dictated by the number of images obtained per phase delay, and n represents the number of separation distances.  We obtained relative frequency-domain measurements at source-detector separation distances ranging from 6.7 to 33.5 mm. A nonlinear least-squares analysis was then performed to fit the derived analytical solution to the obtained experimental measurements of steady-state reflectance, modulation amplitude, and phase angle to recover the optical properties of the medium. Each FDPM measurement type could be utilized separately or in combination in the least-squares analysis. Thus, the parameters were extracted from the frequency-domain datasets in one of the following ways: I dc rel (ρ) data were fit to Eq. (15); I ac rel (ρ,ω) data were fit to Eq. (16); θ rel (ρ,ω) data were fit to Eq. (17); I dc rel (ρ) and I ac rel (ρ,ω) were simultaneously fit to Eqs. (15) and (16), respectively; I dc rel (ρ) and θ rel (ρ,ω) were simultaneously fit to Eqs. (15) and (17), respectively; I ac rel (ρ,ω) and θ rel (ρ,ω) were simultaneously fit to Eqs. (16) and (17), respectively; and finally, I dc rel (ρ), I ac rel (ρ,ω), and θ rel (ρ,ω) were simultaneously fit to Eqs. (15), (16), and (17), respectively. As a result, a single FDPM dataset yielded estimates of the optical parameters obtained in seven different ways. Furthermore, because we obtained essentially nine independent FDPM area measurements per experiment, the least-squares analysis yielded nine estimates of the optical parameters for each of the measurement combinations employed in the algorithm. The nonlinear least-squares fitting routine we employed is part of the commercial package Matlab software (The MathWorks, Natick, Massachusetts). The objective function minimized was of the form: where the subscript i denotes the measurement type (I dc rel , I ac rel , and θ rel ) obtained at the j’th distance from the source, ξ pred and ξ obs represent the predicted and observed measurements, respectively, and σ obs is the standard deviation of the observed measurements.4.Results and DiscussionTable 2 summarizes the experimentally obtained estimates for the optical parameters of the different media investigated. The optical parameters are reported as the mean of the nine estimates obtained for each of the seven measurement combinations applied in the regression. To validate the results, we compare them with the values obtained using the conventional frequency-domain technique using a PMT as a detector. Although this conventional FDPM measurement is itself prone to some degree of measurement error, in general it is regarded as a technique with high accuracy and measurement precision, and as such, is widely used for the determination of separate and distinct absorption and scattering properties of turbid media.10 Therefore, the values obtained using the conventional PMT-based FDPM method provide a practical metric by which to evaluate the accuracy of our experimental results. Table 2
The following formula is used to compute the percent relative error in the experimentally derived optical parameters: where μ calc represents the calculated optical coefficient and μsp is the value obtained from the conventional FDPM analysis. In general, when measurements of steady-state diffuse reflectance were employed, either alone or in combination with another measurement type, the resulting optical parameters were most in error. That is, they possess the highest relative error, indicating that they deviate most from the optical parameters computed via the single-pixel technique. The error in the estimated optical parameters obtained from an analysis of I dc rel does not necessarily reflect the lack of fit of experimental data to the model. In fact, the errors in estimating the optical parameters using measurements of I dc rel alone were obtained despite a relatively good fit of I dc rel data to Eq. (15); the regression coefficient R2 was greater than 0.97 in all the applicable cases. Instead, the relative errors in predicting the optical parameters using measurements of I dc rel alone could be due to errors in the steady-state reflectance measurements themselves, an idea that is discussed further later on. This finding is in accord with the results of Sun, Huang, and Sevick-Muraca, who also determined that simultaneous regression of I dc rel and I ac rel from conventional FDPM measurements failed to accurately recover the optical properties.10Table 3 summarizes the mean relative error in estimating the optical parameters for each of the measurement combinations used in the least-squares analysis for all media investigated. The mean relative error in determining the absorption and reduced scattering coefficients using dc measurements alone, as computed via Eq. (20), was approximately 64 and 54, respectively. The addition of amplitude and phase measurements considerably improved this result. Table 3
Furthermore, it can be seen from Table 2 that measurements of steady-state reflectance underestimated the optical parameters. This may arise due to the fact that the FDPM image measurements were not background subtracted, as is typically required for conventional, steady-state reflectance measurements. As a result, the increased dc signal in nonbackground subtracted images is incorrectly interpreted as light that has propagated and exited the medium. Consequently, the absorption and scattering coefficients are underestimated. Although measurements were conducted in a darkroom to negate the contribution of extraneous light in nonbackground subtracted images, less than ideal darkroom conditions occurred and may have caused artifact in the dc measurements.18 Under experimental conditions similar to those described within this work, and employing a background subtraction technique, Thompson and Sevick-Muraca demonstrated that the ICCD imager operated in the photon-noise limit, or in terms of signal-to-noise ratio (SNR), the optimum in detector performance.18 Therefore, because we employed dc measurements that were not background subtracted, a resulting decrease in SNR could explain the less precise dc measurements. In addition, because the least-squares regression utilized an optimization function weighted by the standard deviations of obtained measurements, and our obtained measurements of I dc rel were generally less precise than measurements of I ac rel and θ rel (σI dc >σI ac ,σθ), the analyses that employed a combination of measurements favored measurements of I ac rel and θ rel over measurements of I dc rel . That is, like Sun et al.;,10 we found that simultaneous regression of I dc rel , I ac rel , and θ rel data gives comparable recovered results as simultaneous regression of I ac rel and θ rel . Consequently, the estimates of the optical parameters were minimally influenced by the addition of I dc rel measurements in the least-squares analysis. On the other hand, because modulation amplitude and phase lag image quantities do not require background subtraction for precise measurement, the optical parameters determined from measurements of I ac rel and θ rel , either alone or in combination, deviated least from the values obtained using the conventional FDPM technique. Typically, the use of phase measurements, alone or in combination with measurements of modulation amplitude, resulted in the determination of the optical parameters from the ICCD system that most closely matched those determined from measurements made with the conventional frequency-domain techniques. In the nonlinear regression analysis of ac amplitude and/or phase lag data, the models yielded extremely good fits to experimental data of I ac rel and θ rel ; R2>0.99 in all the relevant cases. However, in general, the optical parameters obtained from an analysis of I ac rel and/or θ rel data failed to provide a model fit to experimental data of steady-state reflectance (R2 was typically less than 0.5 in these cases, see Fig. 6). Again, this could be a result of the nature of the steady-state reflectance data. The mean relative error, as computed by Eq. (20), was approximately 15 and 11 in the determination of the absorption and reduced scattering coefficients, respectively, when phase measurements were used alone or in combination with ac amplitude data. In addition, the calculated absorption coefficients agreed quite well with those computed using the added absorber calculation provided by Eq. (18). Finally, including additional measurements in the nonlinear regression does not necessarily yield a model that leads to a better fit of the data. Because the number of fitting parameters, namely the absorption and reduced scattering coefficients, is the same in all the nonlinear regressions employed, inclusion of an additional measurement type increases the degrees of freedom by the number of additional measurements. Because the increase in the sum of squared residuals is proportional to the increase in the degrees of freedom, it stands to reason that additional measurements do not necessarily improve the fit of the model to the experimental data. However, as evidenced in Table 3, the use of multiple measurement types in the nonlinear least squares regression can lead to improved estimates of the optical parameters. Figure 6Experimentally obtained measurements of normalized I dc intensity (a.u.) as a function of distance from the source (cm) for solutions containing various concentrations of Liposyn emulsion and no added ink absorber. The symbols and error bars denote the mean and standard deviations of the measurements, respectively, whereas the lines represent the predictions using the optical properties obtained from least-squares analysis of I ac and θ measurements.  Figure 6 shows the experimentally acquired I dc rel measurements and those predicted by the optical properties obtained from least-squares analysis of I ac rel and θ rel for media comprised of various concentrations of Liposyn and no added ink absorber. Similarly, Figs. 7 and 8 report the experimentally acquired measurements of I ac rel and θ rel , respectively, as well as those predicted from least-squares analysis of both I ac rel and θ rel for media comprised of various concentrations of Liposyn and no added ink absorber. Unlike Fig. 6, these plots demonstrate that measurements of amplitude modulation and phase lag agree relatively well with theoretical predictions. The results for the solutions containing added India ink absorbers are akin to Figs. 6, 7, and 8. Figure 7Experimentally obtained measurements of normalized I ac intensity (a.u.) as a function of distance from the source (cm) for solutions containing various concentrations of Liposyn emulsion and no added ink absorber. The symbols and error bars denote the mean and standard deviations of the measurements, respectively, whereas the lines represent the predictions using the optical properties obtained from least-squares analysis of I ac and θ measurements.  Figure 8Experimentally obtained measurements of referenced phase lag (radians) as a function of distance from the source (cm) for solutions containing various concentrations of Liposyn emulsion and no added ink absorber. The symbols and error bars denote the mean and standard deviations of the measurements, respectively, whereas the lines represent the predictions from the optical properties obtained from least-squares analysis of I ac and θ measurements.  Finally, we wished to investigate the effect of modulation frequency on the determination of the optical properties. Measurements were performed at three additional distinct modulation frequencies (40, 60, and 80 MHz) for the solution comprised of 0.5 Liposyn. The gathered I ac rel and θ rel data were then employed in the least squares analysis to obtain estimates for the optical parameters. Figure 9 presents the obtained absorption and reduced scattering coefficients as the mean of nine separate trials. The estimates at modulation frequencies of 40, 60, and 80 MHz are consistent with the results obtained at a modulation frequency of 100 MHz. Again, the obtained absorption coefficients were found to deviate from the value obtained via the conventional technique by (on average) approximately 17 over all the modulation frequencies investigated. Similarly, the reduced scattering coefficient was found (on average) to within 2 of value determined by the conventional FDPM technique. Figure 9Estimates of the optical parameters of a solution comprised of 0.5 Liposyn and no added ink absorber. The optical parameters were acquired via a least-squares analysis using measurements of modulation amplitude and phase lag. The experiments employed the various modulation frequencies listed in the first column of the table. The symbols denote the mean of nine estimates while the error bars indicate the standard deviations.  5.ConclusionWe demonstrate the use of an ICCD detector for the collection of frequency-domain photon migration data and its subsequent use in determining the optical properties of semi-infinite turbid media. We employ referenced measurements obtained at multiple source-detector positions and the diffusion approximation to regress estimates for the absorption and reduced scattering coefficients. We found that measurements of steady-state diffuse reflectance are least accurate in determining both the absorption and reduced scattering coefficients, with estimates varying from values calculated by conventional FDPM measurements by (on average) approximately 64 and 54, respectively. Furthermore, our results suggest that measurements of phase lag provide the most accuracy in determining optical parameters when a single type of measurement is employed; phase lag measurements yield estimates for the absorption and reduced scattering coefficients that vary by on average approximately 14 and 11, respectively. The least-squares regression algorithm employed could exploit multiple measurement types simultaneously. Our results deviate most from the estimates obtained via the conventional FDPM technique when the combinations of measurements include steady-state reflectance. This is due in part to the fact that FDPM measurements are not background subtracted and it is believed that employing a background subtraction technique should improve the dc component while having little if any effect of ac and phase lag. On the other hand, the most accurate estimates of the optical parameters are obtained when amplitude data are employed along with phase lag data. In this case, the estimates for the absorption and reduced scattering coefficients again vary from values computed by the conventional FDPM technique by (on average) approximately 15 and 11, respectively. Finally, we found that our results are consistent at multiple modulation frequencies spanning 40 to 100 MHz. In summary, we recommend that the optical properties of semi-infinite media be obtained from an analysis of phase shift data or the simultaneous regression of amplitude and phase shift data. Finally, the estimates we obtain for the accuracy of the derived optical parameters are calculated using reference values, which are obtained from conventional frequency-domain measurements employing a single point of collection in response to a point of illumination within an infinite media. Thus, inaccuracies in the gold-standard values of absorption and scattering may also contribute to an unaccounted error. Nonetheless, we demonstrate for the first time the use of an ICCD detection system to acquire simultaneous surface-area FDPM measurements for purposes of estimating the absorption and scattering coefficients of turbid media. Additionally, our results validate the use of an ICCD detection system for FDPM analysis on systems that exhibit tissue-like scattering, including those used for the acquisition of data for optical tomography. AcknowledgmentsThe authors gratefully acknowledge funding from National Institutes of Health Grant numbers R01 CA67176 and EB00174. The authors also thank Alan Thompson, Jessica Houston, Anuradha Godavarty, and Amit Joshi for assistance with instrumentation and insightful discussions. REFERENCES
M.G. Nichols
,
E.L. Hull
, and
T.H. Foster
,
“Design and testing of a white-light, steady-state diffuse reflectance spectrometer for determination of optical properties of highly scattering systems,”
Appl. Opt. , 36 93
–104
(1997). Google Scholar
T.J. Farrell
,
M.S. Patterson
, and
B. Wilson
,
“A diffusion theory model of spatially resolved, steady-state diffuse reflectance for the noninvasive determination of tissue optical properties in vivo,”
Med. Phys. , 19 879
–888
(1992). Google Scholar
R.M.P. Doornbos
,
R. Lang
,
M.C. Aalders
,
F.W. Cross
, and
H.J.C.M. Sterenborg
,
“The determination of in vivo human tissue optical properties and absolute chromophore concentrations using spatially resolved steady-state diffuse reflectance spectroscopy,”
Phys. Med. Biol. , 44 967
–981
(1999). Google Scholar
A. Kienle
and
M.S. Patterson
,
“Improved solutions of the steady-state and the time-resolved diffusion equations for reflectance from a semi-infinite turbid medium,”
J. Opt. Soc. Am. A , 14 246
–254
(1997). Google Scholar
M.S. Patterson
,
B. Chance
, and
B.C. Wilson
,
“Time resolved reflectance and transmittance for the noninvasive measurement of tissue optical properties,”
Appl. Opt. , 28 2331
–2336
(1989). Google Scholar
J.B. Fishkin
,
P.T.C. So
,
A.E. Cerussi
,
S. Fantini
,
M.A. Franceschini
, and
E. Gratton
,
“Frequency-domain method for measuring spectral properties in multiple-scattering media: methemoglobin absorption spectrum in a tissuelike phantom,”
Appl. Opt. , 34 1143
–1155
(1995). Google Scholar
B.J. Tromberg
,
L.O. Svaasand
,
T.T. Tsay
, and
R.C. Haskell
,
“Properties of photon density waves in multiple-scattering media,”
Appl. Opt. , 32 607
–616
(1993). Google Scholar
M. Gerken
and
G.W. Faris
,
“Frequency-domain immersion technique for accurate optical property measurements of turbid media,”
Opt. Lett. , 24 1726
–1728
(1999). Google Scholar
S. Fantini
,
M.A. Franceschini
,
J.B. Fishkin
,
B. Barbieri
, and
E. Gratton
,
“Quantitative determination of the absorption spectra of chromophores in strongly scattering media: a light-emitting-diode based technique,”
Appl. Opt. , 33 5204
–5213
(1994). Google Scholar
Z. Sun
,
Y. Huang
, and
E.M. Sevick-Muraca
,
“Precise analysis of frequency domain photon migration measurement for characterization of concentrated colloidal suspensions,”
Rev. Sci. Instrum. , 73 383
–393
(2002). Google Scholar
B.J. Tromberg
,
R.C. Haskell
,
S.J. Madsen
, and
L.O. Svaasand
,
“Characterization of tissue optical properties using photon density waves,”
Comments Mol. Cell. Biophys. , 8 359
–386
(1995). Google Scholar
S. Fantini
,
M.A. Franceschini
, and
E. Gratton
,
“Semi-infinite-geometry boundary problem for light migration in highly scattering media: a frequency-domain study in the diffusion approximation,”
J. Opt. Soc. Am. B , 11 2128
–2138
(1994). Google Scholar
J.B. Fishkin
,
O. Coquoz
,
E.R. Anderson
,
M. Brenner
, and
B.J. Tromberg
,
“Frequency-domain photon migration measurements of normal and malignant tissue optical properties in a human subject,”
Appl. Opt. , 36 10
–20
(1997). Google Scholar
A. Kienle
and
M.S. Patterson
,
“Determination of the optical properties of semi-infinite turbid media from frequency-domain reflectance close to the source,”
Phys. Med. Biol. , 42 1801
–1819
(1997). Google Scholar
R.C. Haskell
,
L.O. Svaasand
,
T.T. Tsay
,
T.C. Feng
,
M.S. McAdams
, and
B.B. Tromberg
,
“Boundary conditions for the diffusion equation in radiative transfer,”
J. Opt. Soc. Am. A , 11 2727
–2741
(1994). Google Scholar
J.R. Lakowicz
and
K.W. Berndt
,
“Lifetime-selective fluorescence imaging using an rf phase-sensitive camera,”
Rev. Sci. Instrum. , 62 1727
–1734
(1991). Google Scholar
J.S. Reynolds
,
T.L. Troy
, and
E.M. Sevick-Muraca
,
“Multipixel techniques for frequency-domain photon migration imaging,”
Biotechnol. Prog. , 13 669
–680
(1997). Google Scholar
A.B. Thompson
and
E.M. Sevick-Muraca
,
“Near-infrared fluorescence contrast-enhanced imaging with intensified charge-coupled device homodyne detection: measurement precision and accuracy,”
J. Biomed. Opt. , 8 111
–120
(2003). Google Scholar
H.J. van Staveren
,
C.J.M. Moes
,
J. van Marle
,
S.A. Prahl
, and
M.J.C. van Gemert
,
“Light scattering in Intralipid-10 in the wavelength range of 400–1100 nm,”
Appl. Opt. , 30 4507
–4514
(1991). Google Scholar
S.T. Flock
,
S.L. Jacques
,
B.C. Wilson
,
W.M. Star
, and
M.J.C. van Gemert
,
“Optical properties of Intralipid: a phantom medium for light propagation studies,”
Lasers Surg. Med. , 12 510
–519
(1992). Google Scholar
S.J. Madsen
,
M.S. Patterson
, and
B.C. Wilson
,
“The use of India ink as an optical absorber in tissue-simulating phantoms,”
Phys. Med. Biol. , 37 985
–993
(1992). Google Scholar
|
||||||||||||||||||||||||||||||||||||||||||||||||||||||||||||||||||||||||||||||||||||||||||||||||||||||||||||||||||||||||||||||||||||||||||||||||||||||||||||||||||||||||||||||||||||||||||||||||||||||||||||||||||||||||||||||||||||||||||||||||||||||||||||||||||||||||||||||


