
|
|
1.IntroductionTransposable elements (TEs) or transposons are mobile segments of DNA that are capable of being excised and moved from one chromosomal location to another by a process known as transposition. TEs are a heterogeneous class of genetic elements that vary in structure, mechanism of transposition, and choice of target sites. TEs of some form are found in all prokaryotic and eukaryotic organisms. Transposable elements in eukaryotes are of two types: those that are mobilized by a DNA-only mechanism (class 2) and those that use an RNA intermediate (class 1).1 Class 2 transposons move by a cut-and-paste mechanism wherein the transposon is cut out or excised from its original location and pasted or transposed into a new location (target site). This process requires an enzyme called the transposase that performs the excision reaction, recognizes specific target site sequences, and then promotes insertion of the TE at the target site (transposition). Hence, TEs are also known as jumping genes and are valuable molecular tools for creating transgenic or genetically modified organisms (GMOs). Transposable elements are key to many applications in molecular genetic research. They can be used for genetic analysis as markers to tag other genes and for mutagenesis experiments to localize and characterize genes. Some transposons in bacteria are known to carry genes that confer antibiotic resistance and hence have tremendous potential to impact public health.1 However, one of the most important features of TEs are their contributions to the evolution of genomes due to mutations resulting from insertions, deletions, and recombination events. TEs have also been found to be the cause of mutations responsible for some human genetic diseases, including hemophilia A and B, porphyria, and Duchenne muscular dystrophy.2 Hence there is a need to study TEs to explore various advances in transgenic research, and this may also serve to better understand mutations that lead to certain diseases. When a TE moves from one genomic location to another, it can cause changes in the DNA at both the original site and the target site, hence generating gene mutations and chromosomal rearrangements. TE insertions near or within a target gene can activate or inactivate the target gene, thereby affecting gene expression. However, in some systems, the process of generating transgenic organisms is not very efficient due to integration into unstable or transcriptionally inactive genomic regions that prevent transgene expression. It is expected that a greater understanding of how and where TEs integrate into target genomes will enable the engineering of TE movement into favorable and specific target sites. TE movement exhibits variable specificity in selecting target sites while integrating into host genomes.3 Class 2 TEs typically use 2 to 8 base pair (bp) target recognition sequences, which are then duplicated on insertion. However, it is clear that not all potential target sites within a genome are used with unbiased frequency.3 4 5 Sites that have been targeted by TEs are called insertion sites. The TE-targeted sites that have been used at high frquencies are called hot spots, whereas those sites that match the primary target recognition sequence and yet remain unused are called cold spots. Based on the observation that TEs do not insert at every site that matches their primary target sequence, it is likely that there are other factors contributing to target choice. It has been shown by previous research that besides the primary nucleotide sequence, certain transposable elements show a preference for particular secondary structures in target DNA, thus playing a vital role in target site selection.4 6 7 8 9 It has been postulated that certain local and unusual DNA structures formed in the vicinity of hot spots enhance preferential recognition by the transposition machinery, and hence influence insertion of elements at those sites.9 Hence we postulate that secondary and tertiary local DNA structures, such as supercoiled DNA, bending of target DNA, and curved flanking DNA, may also contribute to target site preferences for the transposon of our interest, the Hermes transposable element from the house fly, Musca domestica. To better understand the concept of selective choice of TE target sites, we used UV-visible absorption spectroscopy to investigate the effect on the aggregation of colloidal gold nanoparticles by DNA flanking known hot and cold spots for the Hermes element. The observed differences in effects on the aggregation of the colloidal gold was postulated to be due to differences in dynamic structural flexibility of the various olionucleotide samples. Dynamic structural flexibility of the DNA flanking known hot and cold spots could directly contribute to target site preferences for the Hermes transposable element, or it could have an indirect effect by influencing the formation of different secondary and tertiary local DNA structures flanking known hot and cold spots. It is well established that the ability of DNA to wrap or bend around minute nanoscale structures plays a critical role in its functionality.10 Central to this phenomenon is the intricate sequence-dependent structure and flexibility of the DNA molecule, which leads to the wrapping, bending, and other conformational states of the double helix.10 Thus significant efforts have focused on the binding of oligonucleotides around metal nanostructures and colloids to study various characteristics of DNA and in the development of a myriad of DNA-based applications, such as elucidating the mechanism of electron transfer through DNA and developing revolutionary DNA detection technologies.11 For this current mode of research to successfully design DNA probes that can target DNA sequences with optimal specificity, and selectivity, and to study various DNA conformational states, it is crucial to have a sound understanding of the mechanism of interaction of the DNA molecule and its constituent building blocks with the metal surfaces on a molecular level. To this end, there have been several studies documented in the existing literature dealing with the binding and conformation of oligonucleotides on metal surfaces.11 12 Previous bioinformatics research, performed on the same set of controls and samples studied in this investigation, analyzed bendability values given by a trinucleotide scale and stacking energy values given by a dinucleotide scale.13 Bendability is a value of anisotropic flexibility and corresponds to 32 complementary trinucleotides that range from −0.28 (rigid) to +0.194 (bendable).14 Stacking energy relates to the interaction energy between adjacent base pairs in the double helix and is estimated using a set of dinucleotide values. It is expressed in kcal/mol and ranges from −3.82 (will melt easily) to a maximum value of −14.59 (requires the most energy to destack or melt the helix).15 Hence values closer to −3.82 reflect regions of the helix that would destack or melt more easily. Conversely, larger negative numbers would represent more stable regions of the DNA helix. It was seen that the values of bendability for the flexible control and hot spots were between −0.0332 and −0.06049, while the rigid control and cold spots revealed values between −0.09375 and −0.14539. 13 The stacking energy values for the flexible control and hot spots ranged between −6.89971 and −8.5153, while the rigid control and cold spots revealed values between −8.71838 and −9.60647. 13 Hence it was concluded from bioinformatics that the flexible control and hot spots were both more flexible and stable than the rigid control and the cold spots. The goal of this investigation is to spectroscopically detect differences in the influence of hot spots and cold spots for the Hermes transposable element on the aggregation of colloidal gold nanoparticles. The samples tested were two known hot spots and two known cold spots for the Hermes element, as well as controls for rigid and flexible DNA. The sequence-dependent DNA controlled aggregation of gold nanoparticles was monitored here by UV-visible absorption spectroscopy. Single isolated colloidal gold nanoparticles have a surface plasmon resonance manifested as an absorption peak located at approximately 520 nm. This is due to the sum of the effects of light absorption and scattering, which in turn is dependent on the size and the dielectric constant of these particles. When these gold nanoparticles aggregate, their surface plasmon resonance shifts to longer wavelengths, depending on the size and shape of the aggregate complex and the interparticle distance between individual particles within the aggregate.10 16 This translates to a different light scattering profile according to the Mie scattering theory, and manifests itself as a visible color change of the solution from wine red to various shades of pink, purple, or gray, depending on the state of aggregation.17 18 19 2.Materials and Methods2.1.MaterialsGold (Au) colloidal particles with a mean diameter of 15.5 nm and a coefficient of variation of 10 were purchased from Ted Pella, Incorporated (Redding, California). The cuvettes used were disposable semimicro polystyrene cuvettes purchased from VWR International Incorporated (West Chester, Pennsylvania) that allowed the use of small sample volumes. The KCl used to induce aggregation was purchased from EM Science (Gibbstown, New Jersey). The primers used to produce each double-stranded oligonucleotide were obtained from Invitrogen Life Technologies (Carlsbad, California). The 1× annealing buffer consisting of 5-mM Tris-HCl (pH 7.4), 5-mM NaCl, and 0.5-mM EDTA was made from reagents purchased from Sigma (Saint Loius, Missouri). 2.2.Design of Primers for Hot/Cold Spots and Flexible/Rigid ControlsBased on previously performed transposition assays, Sarkar et al.; revealed 65 insertions of the Hermes element into the target plasmid pGDV1.5 Of these 65 insertions, only 22 were used more than twice and hence were called hot or preferred spots.5 The two hottest spots for integration of the Hermes element into the target plasmid pGDV1 were chosen for this analysis. The most frequently used hot spot (HS1) for the Hermes element is located at base pair 2154+ in pGDV1 with 14 integration events at that site, while the other hot spot (HS2) used in this analysis was located at 736+ in the target plasmid pGDV1 with 12 integration events at that site. The 8 base-pair (bp) target sequence at each of these sites was identified and 10 bp of flanking upstream and downstream sequences were incorporated into oligonucleotide primers. In effect, each primer was 28 bp in length with the 8 bp consensus in the middle flanked by the 10 bp of the up/downstream sequence. The DNA sequence for the hot spots (which are in duplex form) are as follows, where the bold letters represent bases that are the consensus sequence. Oligonucleotide pairs for each hot spot representing the sequences as shown and the reverse complement sequence were synthesized by the manufacturer. The two complementary primers were annealed in the lab to form the double-stranded DNA targets.Putative target sites that matched the 8-bp target primary consensus sequence for the Hermes element, NTNNNNAC, that had not been targeted previously in transposition assays, were identified as cold spots. Two cold spots were chosen for this analysis. Their 8-bp target site was identified and 10 bp of upstream and downstream sequence was included in the design of the primers for the cold spots, as shown next. Hence, the primers for the cold spots were also 28 bp in length, similar to that of the hot spots, the difference being that the hot spots were actually previously hit insertion sites, while the cold spots are only putative target sites. The rigid control was designed using repeating triplets of ACG trinucleotides flanked by A-tracts. DNA bendability is a measure of anisotropic flexibility of DNA and is given by a trinucleotide scale, wherein each triplet is assigned a bendability value in the software HMMPro that uses bioinformatics algorithms to simulate structures.13 20 21 We designed the rigid control using ACG trinucleotides, which are assigned the lowest bendability value of −0.174, and these repeating triplets were also flanked by highly rigid A-tracts. The flexible control was designed using repeating triplets of CAG trinucleotides corresponding to the highest bendability value of +0.28, and these are also flanked by A-tracts.2.3.Annealing of DNA PrimersEach primer with its forward F and reverse R compliment were provided by the manufacturer (Invitrogen Life Technologies) in a lyophilized form. Each primer was resuspended in appropriate volumes of 1× annealing buffer so as to ensure that the final concentration of each primer was 3 mM. They were then allowed to sit at room temperature for 20 min to allow proper hydration of the lyophilized primers with the annealing buffer. Each primer went through a process of vortexing and centrifugation twice to ensure proper mixing. Equal volumes of the F and R primers of each sample were then combined together so that the final concentration of the double-stranded sample was 1.5 mM, following which the samples were then vortexed and centrifuged twice to ensure proper mixing of samples. In this process of combining together equal volumes of the F and R primers of each sample, unstable double-stranded complexes are formed. To ensure correct base pairing of the F and R strands to form stable double-stranded oligonulceotides, the samples went through a process of heating at 65° for 10 min, during which the DNA is denatured into single-stranded DNA. This process was immediately followed by a gradual cooling of the sample to room temperature for approximately 2 h to allow the annealing of the primers to form stable double-stranded DNA complexes. 2.4..UV-Visible ExperimentsUV-visible absorption spectra were collected using a Beckman DU-640 spectrophotometer. Each sample [flexible control (FC), hot spot 1 (HS1), hot spot 2 (HS2), rigid control (RC), cold spot 1 (CS1), and cold spot 2 (CS2)] was prepared by combining 25 μl of 0.3-M KCl with 25 μl of the various DNA samples (each DNA sample had a stock concentration of 1.5 mM) that were dissolved in 5-mM Tris, 5-mM NaCl buffer (pH=7.2). Then 50 μl of the colloidal gold particles were added to this salt-DNA mixture and thoroughly mixed. This final 100-μl reaction mixture was transferred to a semimicro disposable polystyrene cuvette (used for small sample volume assays) and its absorption spectra was collected. Three equal aliquots of each sample were prepared and tested for studying intra-batch consistency for each sample. The final DNA concentration in each sample was 0.375 mM. It is critical that KCl is added to the reaction mixture as it greatly assists the aggregation of the gold nanoparticles. This aggregation causes a shift in the surface plasmon resonance of the particles, which is then analyzed to determine the extent of colloid aggregation, and thus a postulate on the nature of the dynamic flexibility of the oligonucleotide samples. A variety of KCl concentrations (from 0.1 to 0.3 M) were tested to induce aggregation of the gold colloid-DNA complex, from which 0.3-M KCl was identified as the most reliable. The order in which the KCl was added to the gold colloid was also very important. This is in agreement with similar observations made by other groups.10 Adding KCl to the gold colloids prior to the addition of the DNA samples made the nanoparticles very unstable, as it induced them to aggregate extremely fast and fall out of solution within minutes. However, if the KCl and DNA are mixed together first and then added to the gold colloid, a time-dependent study of the aggregated gold-DNA complex by measuring the absorption spectra of the DNA samples at 1, 17, 32, and 52 min after the initiation of the aggregation process showed that the spectra changed little in this time frame. Thus, 10 min was chosen as the reference point to collect the absorption spectra after mixing the samples for all further experiments. 3.Results and DiscussionThe goal of this research is to study the effect of each of the following oligonucleotides on the aggregation of colloidal gold nanoparticles: flexible control (FC), hot spot 1 (HS1), hot spot 2 (HS2), rigid control (RC), cold spot 1 (CS1), cold spot 2 (CS2), and control (buffer sample—no DNA present) with 15.5-nm Au colloidal particles. The gold colloid is citrate reduced and thus possesses negative charge due to the presence of citrate ions. Single isolated Au colloidal particles have a surface plasmon resonance that is manifested spectrally as an absorption peak at approximately 520 nm. This resonance peak is sensitive to the aggregation of the colloidal particles, which then results in the development of a second peak or shoulder at longer wavelengths, depending on the state of the aggregation and the nature of the aggregated complex. Several factors, such as the size of the aggregated complex, their shape, orientation, and the interparticle spacing within each aggregated complex, determine the nature, intensity, and stability of the red-shifted peak and/or shoulder.10 11 16 Figure 1 shows the results of the preliminary time-dependent study. The purpose of this study was to observe the stability of the aggregated colloids on addition of KCl and DNA. As can be clearly observed, the spectra of the colloid remained fairly stable until roughly 52 min. While only the data for the rigid control is shown, this was observed for all the samples. As a result, 10 min was chosen as a suitable reference point from which to collect spectra of all subsequent samples in the second round of experiments. A series of KCl concentrations, from 0.1 to 0.3 M, were tested to induce aggregation of the gold colloidal particles, from which 0.3-M KCl was found to induce an optimal level of repeatable aggregation. Figure 1Absorption spectra of rigid control at 1, 17, 32, and 52 min after addition of salt and the DNA to the colloidal gold. The top graph is the 1-min scan and it goes down progressively little with time. As can be clearly observed, the change in aggregation profile of the sample varies very little with time.  The data shown in Figs. 2(a–h) are the mean of the absorption spectra of three aliquots of each sample with error bars depicting one standard deviation above and below the mean. The data are displayed in this manner to show the experimental variability in the data collection process for each of the samples. A careful observation of the graphs show that the effect on the aggregation of the gold colloid by flexible and rigid DNA is markedly different. The flexible control (FC), hot spot 1 (HS1), and hot spot 2 (HS2) reacted with the gold colloid to induce a stable nanoparticle aggregate with a plasmon resonance located at roughly 630 nm. This new shoulder at 630 nm was relatively low in magnitude, suggesting that the extent of the aggregation was limited and thus the size of the aggregates were relatively small. This is in agreement with the observation that these aggregated solutions had a reddish-violet color and remained stable for a longer period of time than those samples with rigid DNA that were dark purple-gray in color and began to become unstable after 52 min. The absorption spectra of the rigid control (RC), and cold spot 2 (CS2) samples showed a large aggregated plasmon resonance band at approximately 658 nm. The spectra of cold spot 1 (CS1) had a very large shoulder at 630 nm. On the basis of this spectroscopic evidence, it can be said that the rigid DNA samples promoted greater gold-to-gold particle aggregation than that of flexible DNA samples. Figure 2Absorption spectra plot with error bars showing experimental variability of the mean of three aliquots of: (a) unaggregated colloidal gold, (b) colloidal gold with flexible control, (c) colloidal gold with hot spot 1, (d) colloidal gold hot spot 2, (e) colloidal gold with rigid control, (f) colloidal gold with cold spot 1, (g) colloidal gold with cold spot 2, and (h) control sample (colloidal gold with buffer only). Here the state of aggregation is depicted by both the size of the aggregated plasmon resonance peak/shoulder as well as the extent to which it is red-shifted.    Figures 3(a) and 3(b), broken down into two charts for clarity, show the mean absorption spectra of three separate aliquots of the samples that were tested 10 min after mixing the colloid and DNA, and unaggregated gold colloid only. As can be seen in the graphs, the gold colloidal particles begin to aggregate after the addition of the salt and DNA. This is visually confirmed by a rapid change in color of the colloid from wine red to purple and/or gray, depending on the speed and extent of the aggregation process. Here it is clearly seen that the extent of gold aggregation on addition of the two hot spots and flexible control is much less than the extent of gold aggregation on addition of the two cold spots and rigid control. This is shown by a stronger and more red-shifted aggregated plasmon resonance peak for the cold spots and rigid control when compared with the hot spots and flexible control. This points to a similarity in behavior of the hot spot samples to the flexible control sample and the cold spot samples to the rigid control sample. Figure 3(a) Absorption spectra of mean of three aliquots of (A) unaggregated colloidal gold, (B) colloidal gold with flexible control, (C) colloidal gold with hot spot 1, and (D) colloidal gold with hot spot 2. (b) Absorption spectra of mean of three aliquots of (E) colloidal colloidal with rigid control, (F) colloidal gold with cold spot 1, (G) colloidal gold with cold spot 2, and (H) control sample. 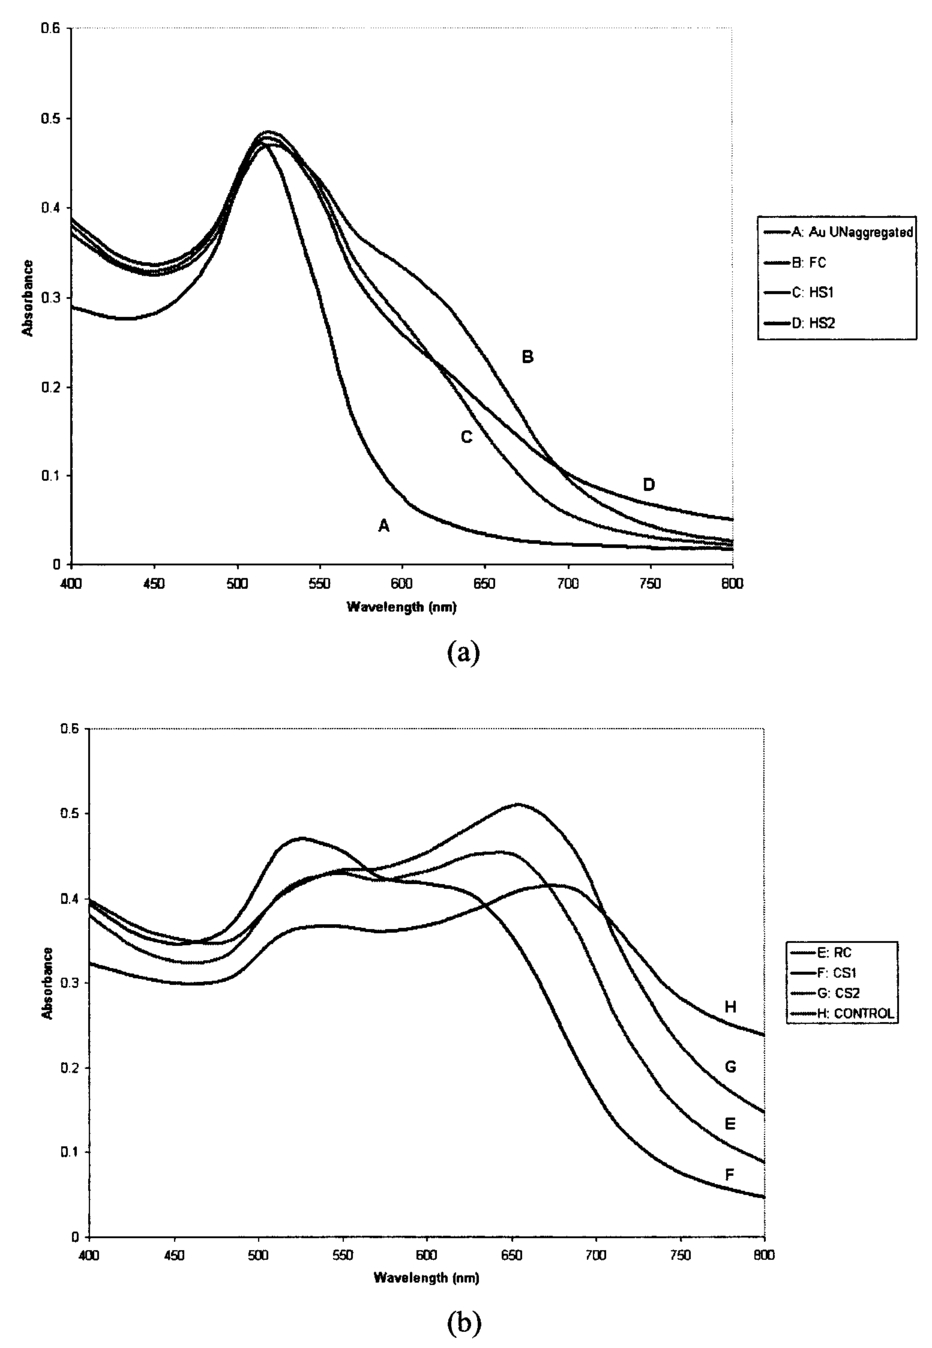 A clue that could lead to a possible explanation for the difference in aggregation characteristics can be seen when the spectra of the control sample (which has colloidal gold, KCl, and buffer only but no DNA) is studied. This spectra shows the highest degree of aggregation of the nanoparticles by virtue of the large and most red-shifted plasmon resonance peak at 687 nm. The sample had a light gray appearance immediately after mixing and began to fall out of solution within 5 min. This is confirmed by the control sample in Figs. 3(b) and 2(h) having the lowest absorption values when compared to the rest of the samples. It is thus confirmed that without the interference of DNA, the gold colloids rapidly aggregate, become unstable, and fall out of solution. With this in mind, it can then be postulated that the presence of DNA in the sample helps to stabilize the aggregation of gold colloid by slowing the rate and amount of uncontrolled gold aggregation. The extent of this stabilization procedure seems to be a direct function of the affinity of the oligonucleotides for the gold nanoparticles, i.e., the higher the affinity, the more the oligonucleotides bind to the gold colloidal particles and thus reduce direct gold-to-gold interaction. This prevents the formation of extremely large clusters of gold particles, which are primarily responsible for the instability of the reaction mixture. Based on this hypothesis, it can be said that the flexible (bendable) nucleotide samples displayed more affinity to gold colloids than the rigid samples. Therefore, we propose that the inherent dynamic flexible nature of the bendable DNA allows it to wrap around gold particles more easily and thus form more stable complexes when compared to the rigid DNA samples. One caveat for these reactions was that the inter-batch consistency of the data were significant. Although the data were consistent within each batch (it followed the same trend within each batch for each sample) and thus displayed intra-batch consistency, the DNA samples showed different overall reactivity to the gold colloidal particles between batches of primer synthesis. This is, however, not surprising, as the result of the annealing process of individual primers is invariably different from batch to batch, since it is not possible to control the extent of the annealing reaction for every run. It is possible that unstable complexes and pieces of unannealed single-stranded F and R primers remain in the final double-stranded annealed oligonucleotide, and this cannot be comprehensively monitored or controlled. A more lucid picture of the difference in the affinity of these oligonucleotides toward gold colloidal particles can be drawn when the ratio of the area under the single particle plasmon resonance peak to that of the area under the aggregated particle plasmon resonance peak/shoulder is taken for all the relevant samples. Here the areas under the curve were taken, as they are more robust in quantifying the continuous change in spectral shape of the aggregating gold particles through many wavelengths. Figure 4 shows the region under which the areas of the curve were computed (flexible control sample shown here only). Region A spanning from 490 to 540 nm was chosen for the single-particle plasmon resonance region, while region B spanning from 570 to 750 nm was chosen for the aggregated particle plasmon resonance region. Table 1 shows the mean of the ratio of the areas of three aliquots of each sample, along with their standard deviation. Figure 4Plot of absorption spectra of flexible control showing the region under which the areas of the curve were computed for all the samples. Region A spanning from 490 to 540 nm was chosen for the single-particle plasmon resonance region, while region B spanning from 570 to 750 nm was chosen for the aggregated particle plasmon resonance region. 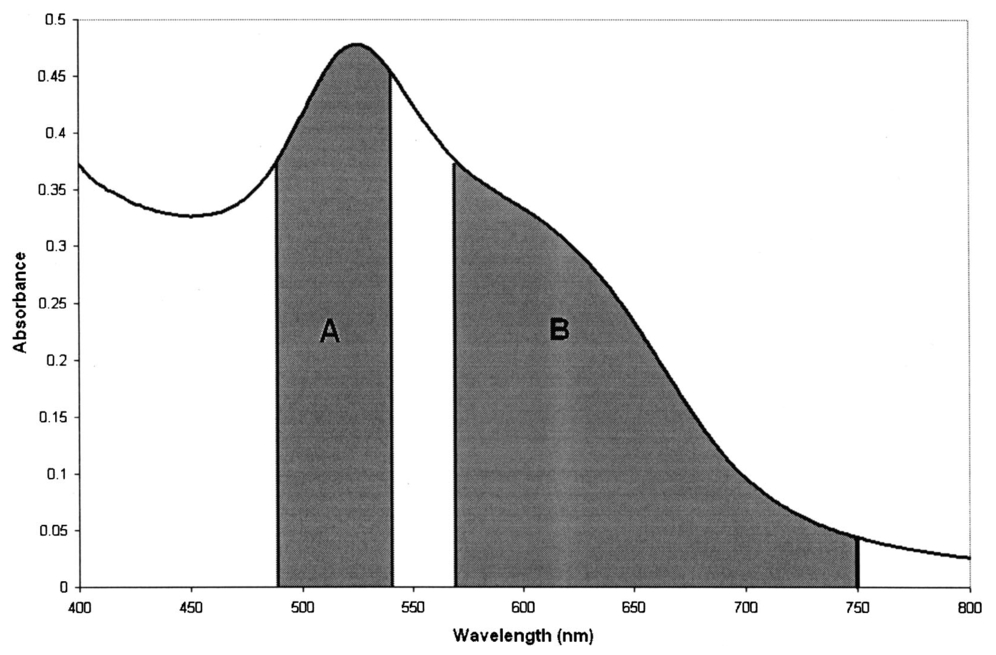 Table 1
Figure 5 is a pictorial representation of the data shown in Table 1, where each point labeled represents the mean of the ratio of the area under B to the area under A for the three aliquots of each sample, along with their standard deviation (error bars). As can be seen from the charts, there is a significant difference in the area ratios between the flexible DNA and the rigid DNA, as they occupy different areas in the area ratio plots. The flexible control and hot spot samples all have their area ratios (including error bars) below 1.7, whereas the rigid control and cold spot samples have their area ratios (including error bars) above 1.7. A simple two-tailed t-test was performed where the null hypothesis tested was to determine if the ratio of mean of the area under B to the area under A for three aliquots of each of the three rigid DNA and the three flexible DNA samples are equal (i.e., not significantly different). Here the data (individual data points not shown) was divided into two groups. The first group had the mean ratio of the area under B to the area under A of the three aliquots of flexible control (FC), hot spot 1 (HS1), and hot spot 2 (HS2). The second group of data contained the mean ratios of the area under B to the area under A for the three aliquots of rigid control (RC), cold spot 1 (CS1), and cold spot 2 (CS2). The results of the t-test gave a probability of 3.22×10⁻⁵ for the null hypothesis to hold. This represents over 99.99 probability that the ratio of mean of the area under B to the area under A is statistically different for the two forms of DNA, respectively. Therefore as a coarse study, the t-test result does support our hypothesis that rigid and flexible DNA samples interact differently with the gold colloidal particles. 4.ConclusionThe results of this study show that the trends in the absorption spectra of the samples and controls are clearly different and can be grouped under two categories, the first including the flexible control, HS1, and HS2, while the second category includes the rigid control, CS1, and CS2. Our UV-visible absorption spectroscopy results are in keeping with previously established bioinformatics results. Correlating both sets of results, it now seems apparent that the flexible control and hot spots form stable complexes with the gold colloids and prevent uncontrolled aggregation. This is corroborated by observing the fact that the flexible control and hot spots stay in solution considerably longer than the rigid control and the cold spots. It can thus be postulated that the flexible control and hot spots allow for easier wrapping around the gold colloids and form stable complexes, and likewise may wrap or interact better with transposases and/or transposons, and hence serve as favored substrates or targets for TEs to insert into. The technique described can be used to detect differences in the effects on aggregation of colloidal gold nanoparticles by the oligonucleotides of interest. The next step will be to optimize this technique to obtain quantitative information on the degree of gold aggregation and thereby possibly gain more insight on the dynamic flexibility of the oligonucleotides. These postulated differences in the dynamic flexibility between the cold and hot spots could directly contribute to target site preferences for the Hermes transposable element, or could do so by indirectly influencing the formation of various secondary and tertiary local DNA structures flanking known hot and cold spots. The simplicity of the procedure has a clear advantage as it only involves mixing the sample DNA with salt and colloidal gold particles and then obtaining a UV-visible absorption scan. It thus requires basic instrumentation, minimal sample preparation, and minimal technical expertise. Each of these advantages makes this method a simple and attractive option to study DNA properties that might ultimately influence its secondary structure. AcknowledgmentsThis work was supported by the National Institute for Allergies and Infectious Diseases, National Institutes of Health (NIAID) (grant number RO1 AI47303), and the Whitaker Foundation Special Opportunity Award. REFERENCES
E. T. Prak
and
H. H. Kazazian Jr.
,
“Mobile elements and the human genome,”
Nat. Rev. Genet. , 1 134
–144
(2000). Google Scholar
H. G. van Luenen
and
R. H. Plasterk
,
“Target site choice of the related transposable elements Tc1 and Tc3 of Caenorhabditis elegans,”
Nucleic Acids Res. , 22 262
–269
(1994). Google Scholar
R. F. Ketting
,
S. E. Fischer
, and
R. H. Plasterk
,
“Target choice determinants of the Tcl transposon of Caenorhabditis elegans,”
Nucleic Acids Res. , 25 4041
–4017
(1997). Google Scholar
A. Sarker
,
C. J. Coates
,
S. Whyard
, and
U. Willhoeft
,
“The Hermes element from Musca domestica can transpose in four families of cyclorrhaphan flies,”
Genetica , 99 15
–29
(1997). Google Scholar
G. Liao
and
G. M. Rubin
,
“Insertion site preferences of the
P
transposable element Drosophila melanogaster,”
Proc. Natl. Acad. Sci. U.S.A. , 97 3347
–3351
(2000). Google Scholar
T. J. Vigdal
,
“Common physical properties of DNA affecting target site selection of sleeping beauty and other Tc1/mariner transposable elements,”
J. Mol. Biol. , 323 441
–452
(2002). Google Scholar
P. A. Pribil
and
D. B. Haniford
,
“Target DNA bending is an important specificity determinant in target site selection in Tn10 Transposition,”
J. Mol. Biol. , 330 247
–259
(2003). Google Scholar
P. N. Kuduvalli
,
J. E. Rao
, and
N. L. Craig
,
“Target DNA structure plays a critical role in Tn7 transposition,”
EMBO J. , 20 924
–932
(2001). Google Scholar
L. A. Gearheart
,
H. J. Ploehn
, and
C. J. Murphy
,
“Oligonucleotide adsorption to gold nanoparticles: A surface enhanced Raman spectroscopy study of intrinsically bent DNA,”
J. Phys. Chem. B , 105 12609
–12615
(2001). Google Scholar
N. N. Jang
,
“The coordination chemistry of DNA nucleosides on gold nanoparticles as a probe by SERS,”
Bull. Korean Chem. Soc. , 23
(12), 1790
–1800
(2002). Google Scholar
J. J. Storhoff
,
R. Elghanian
,
R. C. Mucic
,
C. A. Mirkin
, and
R. L. Letsinger
,
“One-pot colorimetric differentiation of polynucleotides with single base imperfections using gold nanoparticle probes,”
J. Am. Chem. Soc. , 120 1959
–1964
(1998). Google Scholar
I. Brukner
,
R. Sanchez
,
D. Suck
, and
S. Pongor
,
“Sequence-dependent bending propensity of DNA as revealed by DNaseI: parameters for trinucleotides,”
EMBO J. , 14 1812
–1818
(1995). Google Scholar
R. L. Ornstein
,
R. Rein
,
D. L. Breen
, and
R. D. Macelroy
,
“An optimized potential function for the calculation of nucleic acid interaction energies I. Base stacking,”
Biopolymers , 17 2341
–2360
(1978). Google Scholar
X. Dou
,
Y. M. Jung
,
Z. Q. Cao
, and
Y. Ozaki
,
“Surface enhanced Raman scattering of biological molecules on metal colloid II: Effects of aggregation of gold colloid and comparison of effects of pH of glycine solutions between gold and silver colloids,”
Appl. Spectrosc. , 53
(11), 1440
–1447
(1999). Google Scholar
G. Mie
,
“Beitrage zur optik truber medien, speziell kolloidaler metallosungen,”
Ann. Physik , 25 377
–445
(1908). Google Scholar
J. A. Crighton
,
C. G. Blatchford
, and
M. G. Albrecht
,
“Plasma resonance enhancement of Raman scattering by pyridine adsorbed on silver or gold sol particles of size comparable to the excitation wavelength,”
J. Chem. Soc. Faraday Trans. II , 75 790
–798
(1979). Google Scholar
A. A. Lazarides
and
G. C. Schatz
,
“DNA-linked metal nanosphere materials: Strucural basis for the optical properties,”
J. Phys. Chem. B , 104 460
–467
(2000). Google Scholar
|
||||||||||||||||||


