
|
|
1.IntroductionIn vivo bioluminescence imaging (BLI) is emerging as a powerful tool for studying a wide range of biological processes from cell trafficking patterns to protein-protein interactions in live animals.1, 2, 3, 4, 5, 6, 7 This approach depends on external detection of weak bioluminescent light sources located at various places in the body, requiring that this light traverse the absorbing and scattering environment of mammalian tissues.8 Luciferases generate visible light through the oxidation of an enzyme-specific substrate in the presence of oxygen, and usually, a cofactor such as ATP as a source of energy. Inherently low background due to near absence of endogenous light from mammalian cells and tissues results in great sensitivity and make BLI ideal for real-time detection of biological events in the body.9, 10 The versatility of this approach has led to widespread use in a variety of disciplines.9, 10 Images produced by BLI are a diffuse projection on the surface from the bioluminescent sources located deep inside the animal. Sensitive low light imaging systems, typically based on charge-coupled device (CCD) cameras, are used to localize and quantify the bioluminescent signals in vivo.8, 11 The signal intensity at the surface is dependent on both the optical properties (absorption and scattering) of the tissue through which the photons pass and the thickness of tissue through which they travel.8, 12, 13 While tissue scattering has weak wavelength dependence in the visible spectrum, absorption can have a sharply contrasted spectral signature originating from the various endogenous chromophores present in the body.12 Within the visible spectrum , hemoglobin is the primary chromophore that absorbs light within tissues;13 melanin in skin is also a significant contributor to absorption if the animal is pigmented.12 Hemoglobin absorbs primarily in the blue and green part of the visible spectrum, but its absorption of wavelengths longer than is reduced, allowing transmission of red light through several centimeters of tissue. Therefore, the spectral properties of the luciferase light source should have a significant impact on how much of the light is transmitted to the surface for external detection. There are several luciferases that have been cloned and characterized such that they can be used as reporter genes in mammalian cells in culture and more recently in vivo.9 To be an optimal reporter for BLI, a luciferase gene needs to have true expression in mammalian cells and its light transmitted efficiently through tissues. The commercially available mammalian-optimized luciferases fall into two classes: the coelenterazine-utilizing enzymes from marine organisms, such as hRLuc, and the benzothiazole luciferin-utilizing coleoptera (beetle) luciferases from terrestrial organisms, such as FLuc and CBLucs. The region of visible spectrum where these luciferases maximally emit is in the range of , where the influence of tissue absorption, especially hemoglobin, is extreme (Fig. 1 ). As all biological sources of light are broad-spectrum emitters, it is important to understand the fraction of light that is absorbed when the reporter is expressed at various tissue depths. Fig. 1The absorption spectra of oxy- and deoxyhemoglobin relative to emission spectra of several bioluminescent enzymes. The hemoglobin and deoxy hemoglobin absorption spectra are plotted based on data from the Oregon Medical Laser Center. The peaks of the emission spectra for luciferases lie in a region of the visible spectrum (shaded gray) that is greatly influenced by hemoglobin absorption. The four selected luciferases represent the range of emission spectra from all well-characterized luciferases. Optimal transmission of photons through mammalian tissues occurs between 600 and based on the absorption spectra of tissues.  In this study, we observed effects of temperature on spectral profile as well as brightness of four different luciferases. Understanding the influences of reaction temperature on the enzymes is critical if comparisons between signals in tissue homogenates and in vivo are performed. A highly sensitive spectrometer was used to measure the emission spectrum of cultured cells labeled with these reporters, with the temperature carefully controlled. All reporters showed increased activity with elevated temperature. In addition, the peak emission wavelength of FLuc was red shifted when the temperature was increased from . We then evaluated the effect of tissue absorption on the spectra of the four luciferases by spectral scanning using a highly sensitive imaging system based on a CCD camera (IVIS® 200).11 The spectra were measured when the reporters were expressed in cultured mammalian cells and in various tissues with varied depth relative to the surface of the animal. Bioluminescent signals from enzymes with spectral peaks in the blue/green wavelengths were strongly absorbed with a pattern suggestive of a significant influence of hemoglobin. Enzymes with spectral peaks in the orange/red wavelengths were less absorbed, with greater penetration through tissues. Thus, luciferases with a larger proportion of their emission spectra above (Fluc+ and CBRed), which have the least attenuation of their signals by mammalian tissue, have greater applicability for measuring biological processes that occur in deep tissues. In addition, gene fusions that encoded dual wavelength luciferases, combining the coding sequences of CBGr68 and CBRed, had a broader spectral emission, and may prove useful for providing information on the signal depth and localization in tissue. 2.Materials and Methods2.1.Plasmids and ReagentsPlasmids containing Fluc+ (pGL3-Basic), CBluc (pCBG68-Basic, pCBR-Basic) and hRluc (phRLuc-CMV) were purchased from Promega Corporation (Madison, Wisconsin). The preparation of both luciferin (Biosynth, Naperville, Illinois) and native coelenterazine (Biotium, Incorporated, Hayward, California) were as previously described.2, 14 2.2.Construction of Luciferase Expression Plasmids and Dual Luciferase Fusion GenesFor consistency of expression, each luciferase coding sequence was inserted into the vector pCDNA3.1(-) (Invitrogen Corporation, Carlsbad, California) such that the reading frame of each gene is identical to the original vector sequence and the regulatory sequences are preserved and consistent among the constructs. All resulting plasmids contained the neomycin resistance gene with the luciferase coding sequences behind the immediate early promoter from human cytomegalovirus (CMV). The dual luciferase fusion proteins were comprised of CBGrluc and CBRed and were created in both orientations (CBGr68-CBRed and CBRed-CBGr68), joined by a DNA linker, which encodes a 17 amino acid peptide rich in glycine and serine residues.15 Transcription of the fusion genes are also under control of the CMV promoter, and the expression context is equivalent to those in the single luciferase constructs. 2.3.Luciferase Activity Measurement in CellsC6 (rat glioma) cells were obtained from American Type Culture Collection (ATCC, Manassas, Virginia) and maintained according to ATCC instructions. In live cell assays, cells were seeded in 96-well plates with growth medium (Dulbecco’s Modified Eagle’s Medium containing 10% fetal bovine serum) and transiently transfected with the luciferase plasmids using Lipofectamine 2000 (Invitrogen). Untransfected cells not containing luciferase genes were used as sham controls. of luciferin was added to cells labeled with Fluc+ and CBluc, while for hRLuc, growth medium was replaced with PBS containing coelenterazine with final concentration at . PBS was used for measurements of hRLuc activity in cultured cells, since culture medium has an effect on coelenterazine that results in higher nonspecific signals due to autocatalyses of substrate.14 Bioluminescent signals were determined using either the IVIS® 100 Imaging System (Xenogen Corporation, Alameda, California) or Triax 320 spectrometer (Jobin Yvon Incorporated, Edison, New Jersey). 2.4.Spectral Analyses and Spectral Imaging Using a SpectrometerBioluminescence emission spectra from cultured cells were obtained using the Triax 320 spectrometer (Jobin Yvon Incorporated, Edison, New Jersey). This instrument, capable of scanning from , uses a diffraction grating system to spectrally decompose the light, which is then imaged onto a liquid-nitrogen cooled, high-sensitivity CCD camera. Culture dishes containing luciferase-expressing cells were placed on a heated pad whose temperature was monitored constantly using a type T thermocouple thermometer (Cole Palmer Instrument Company, Chicago, Illinois) placed in the media. 2.5.Spectral Measurements Using the IVIS 200 Imaging SystemLow-light imaging was performed using an IVIS 200 Imaging System that consists of a cooled integrating CCD camera mounted on a light-tight specimen chamber, and controlled by computer. Grayscale reference images were obtained with low-light illumination, and bioluminescent output was then acquired in complete darkness. The data are represented as pseudocolor images (indicating light intensity, blue least and red most intense) superimposed over the grayscale reference images. The IVIS Imaging System is calibrated against a NIST traceable source to measure light in absolute, quantitative units. Based on this absolute calibration, light output from specified regions of interest (ROI) is quantified as the total number of photons emitted per second using Living Image analysis software (v2.50, Xenogen Corporation). In vivo spectral imaging was performed using an IVIS 200 Imaging System in which the filter wheels had been loaded with bandpass filters, ranging from . A series of images was acquired using each of the filters in sequence between the source and detector. To determine the signal kinetics during the image sequence acquisition, two open-filter images were collected at the beginning and end of the spectral series. Depending on bioluminescence intensity, images were collected under various conditions with exposure times ranging from , binning from 4 to 16, and a field of view. Regions of interest corresponding to the luciferase sources were then applied to the entire stack. A plot of flux measured against wavelength was used to determine the spectral properties of the sample. Both the Triax 320 spectrometer and the IVIS 200 Imaging System were calibrated to correct the measured light output at each wavelength to account for the spectral response of the filters, optics, and CCD (quantum efficiency) that are specific to these devices. 2.6.Animal Models and In Vivo Spectral ImagingBALB/c mice ( old females) were obtained from Stanford University’s Research Animal Facility (RAF) and the Department of Comparative Medicine, and maintained under strict adherence to Stanford University institutional guidelines. Three animal models were used. 1. Liver model: in vivo DNA transfection of mouse hepatocytes were performed using the hydrodynamic method as previously described.14, 16, 17 Briefly, the plasmid DNA was diluted in phosphate buffer (without , ) in a volume of body weight and was rapidly (within ) injected into the tail veins of mice using a syringe fitted with a 27-gauge needle. The amount of plasmid DNA injected was per mouse. These volumes and amounts were selected based on published results14, 16, 17 for conditions that would give us an optimal signal from the liver for these studies. Images were acquired between 22 and postliver transfection. The use of relatively large injection volumes and rapid i.v. injection has been shown to result in transfection of the liver, primarily.14, 16, 17 Transfection of other tissues is very inefficient in this approach, and the signals from other tissues relative to that from the liver are negligible. 2. Lung model: C6 cells expressing transiently transfected luciferase genes ( culture medium) were injected via the tail vein, i.v., into mice. Bioluminescent signals were apparent from a region corresponding to the lungs within after injection. Images presented here were taken after luciferin administration. 3. Skin model: C6 cells expressing luciferase ( cells in cultured medium) were injected [subcutaneous (s.c.)] at two dorsal locations on the mice. The images presented here were acquired after luciferin administration. Mice were anesthetized by inhalation of isoflurane, and D-luciferin [ body weight (BW), interperitoneally (i.p.) injection], or coelenterazine ( BW, i.v., or i.p. injection14) was administered, by injection, at (luciferin in liver and lung models), (luciferin in skin model), or immediately (coelenterazine in all models) prior to BLI. Images were acquired and analyzed with LivingImage software and the light intensity from the region of interest (ROI) corresponding to the liver, lung, or dorsal areas was measured in units of photons/s. 2.7.Quantitative RT-PCRTotal RNA was extracted using RNAeasy Mini Kit (Qiagen, Valencia, California) and message RNA levels for Fluc, CBGr68, and CBRed were determined using Quanti-Tect SYBR Green Reverse Transcription Polymerase Chain Reaction (RT-PCR) kit (Qiagen) following the manufacturer’s instructions. The reaction was performed in a GeneAmp® 5700 Sequence Detector System (PE Applied Biosystems). The primers were designed as follows: Fluc+ (forward, GGCGCGTTATTTATCGGAGTT ; reverse, TACTGTTGAGCAATTCA-CGTTCATTAT ); CBGr68 (forward, TGGTAGCCTGGGTCGCG , reverse TGCTTTGCCGGTCTCACG 3); CBRed (forward, GGCTGAACGTGTGAGCCA-TAC , reverse ACGAGGGATGGAGTCAACAAAA ). Primers for GAPDH gene and control RNA were from TaqMan™ Rodent GAPDH Control Reagent Kit (PE Applied Biosystems, Foster City, California). Standard mRNA for Fluc+, CBGr68, and CBRed was synthesized from pCMV-Fluc+, pCMV-CBGr68, and pCMV-CBRed using the Riboprobe In Vivo Transcription System (T7) (Promega), and the copy numbers were calculated using the formula: (transcription length in nucleotide . For each sample, copy numbers per microgram of total RNA was calculated from a standard curve normalized to the GAPDH value. 3.Results and Discussion3.1.Luciferase ExpressionThe four luciferase genes (Fluc+, CBGr68, CBRed, and hRLuc) used in this study are all commercially available and have been optimized for expression in mammalian cells by the manufacturer. The gene modifications include altering the codon usage to reflect the mammalian preference, removal of mammalian transcription factor binding sites, and removal of peroxisome targeting sites to allow for cytoplasmic expression (Promega Corporation). Each gene was placed in the identical expression vector for the resulting luciferase expression plasmids: pCMV-Fluc+, pCMV-CBGr68, pCMV-CBRed, and pCMV-hRLuc. All these constructs were confirmed by restriction enzyme digestion, the transcriptional activities detected by real-time RT-PCR, and luciferase activity measured by light production observed by IVIS 100 following substrate addition (data not shown). 3.2.Validation of Spectral MeasurementsBioluminescent light, in general, is relatively weak and therefore requires the use of spectrometers operating with a cooled detector, such as the Triax 320 spectrometer. Yet these devices are generally not designed for in vivo animal experiments. Imaging systems with spectral capabilities are becoming available, and the IVIS 200 has been designed to accommodate a large selection of filters to enable spectral imaging; we used bandpass filters, covering the region of the spectrum from . This filter set provides fewer data points along the visible spectrum than a spectrometer [Fig. 2(a) ]; however, the set of filters is in a dedicated in vivo animal imaging system that provides light output measurements in absolute, calibrated units. Fig. 2Thermoactivation of luciferase in live mammalian cells. Rat glioma C6 cells were transiently transfected with each luciferase plasmid. Temperatures were regulated by a heating pad placed in a JY spectrometer or the heating platform in the chamber of IVIS™ 200. (a) Comparable spectra were obtained with the spectrometer (upper panel) or IVIS™ 200 (lower panel) at . The optical transmission window is shaded gray. (b) Luciferase activities are activated from room temperature to physiology temperature ( , ). (c) The spectral emission peak of Fluc+ is red shifted when temperature is increased from at to at . (d) Relative spectral emissions of luciferases above , representing photons least absorbed by hemoglobin.  When the luciferase spectra from rat glioma C6 cells transiently expressing each of the four enzymes in culture were measured sequentially in both the Triax 320 Spectrometer and IVIS® 200 at wavelengths between 420 and , with well-controlled temperature, the spectral profiles measured from each instrument were comparable [Fig. 2(a)]. These data indicate that spectral measurements made using the more limited number of data points can be used to accurately measure spectral output from reporters expressed in animal models. 3.3.Thermal Activation of Luciferases in Live Mammalian CellsTypically, bioluminescent measurements of cells culture, cell lysates, and tissue homogenates are performed at room temperature or even lower. However, live animals have a physiological temperature around , depending on species and anatomic location of signal, and the activity of the enzymes are likely different at the warmer temperature. To investigate the effect of temperature on both the spectral characteristics and enzyme activity, light output from all four luciferases was measured over a range from using the spectrometer. The activities of all the luciferases increased with temperature [Fig. 2(b)], although a markedly larger increase in activity was apparent from the two CBLucs (6.4 fold for CBGr68, 7.8 fold for CBRed) relative to the other two enzymes (2.2 fold for hRLuc, 1.9 fold for FLuc). The thermal activation of all four of these luciferases has not been reported previously, although it was not unexpected, as most enzymes display a kinetic activation on temperature elevation within a physiological range. Although each of the beetle luciferases (CBLucs and FLuc) has comparable activities at , the CBLucs have significantly lower activity at . The smaller increase in thermal activation may reflect the lower temperature optimum of the Fluc enzyme, which is known to be thermolabile on prolonged incubation at .18 Baggett reported firefly luciferase mutants with increased thermo-stability that produced more light in BLI than the enzyme from the parental gene, but the effects on spectral emission of these mutations were not reported. Selection of an optimal luciferase for in vivo imaging may therefore be compromised by making measurements at room temperature . Using luciferases with known reduced activity following prolonged incubation at may not be ideal. In addition to a temperature-dependent increase in activity, the spectral profile of FLuc also changed with elevated temperature, with a spectral peak ranging from at to at [Fig. 2(c)]. This red-shift phenomenon was observed only for FLuc. The spectral profiles of hRLuc , CBGr68 , and CBRed remained stable and were in agreement with the manufacturers’ specifications (data not shown). The total light output above is a key determinant for transmission efficiency through mammalian tissues. The percentage of light above relative to total light output was calculated for each luciferase from spectrometer measurements of labeled culture cells. This value was obtained by integrating the area under the spectrum from , and dividing it by the area under the spectrum integrated over the whole wavelength range . hRLuc and CBGr68 showed smaller percentage values ( and , respectively), while CBRed has the highest values (75 to 80%). For FLuc, the increase in intensity combined with the red shift of emission wavelength at the elevated temperature resulted in more light emission above (41% at to 64% at ) [Fig. 2(d)], revealing that FLuc is nearly equivalent to CBRed for BLI. This might explain the observation that the sensitivity of detection in BLI has been greater than what would have been predicted prior to the first publications of in vivo measurements of bioluminescence.2 3.4.Characterization of Spectra Collected In VivoPhotons transmitted through animal tissue are both absorbed and scattered. To further understand which proportion of light is mostly affected when passing through tissues, the spectral properties (in cell culture, defined here as in vitro, and in mammals, defined here as in vivo) for four luciferases were compared in three animal models (liver, lung, and skin) relative to that from cell culture [Fig. 3(a) ]. The liver model represents a deep-tissue model, in which luciferase is expressed in situ by liver cells. Photons emitted from these cells are transmitted through a solid milieu, rich in hemoglobin, before they can be detected at the surface. The lung model takes advantage of the temporary sequestering of cells that were injected i.v. before dispersal throughout the entire animal; the injected cells labeled with luciferase are trapped in the fine capillaries of the lung tissue. Photons must traverse an interface-rich path, being scattered at both the air/alveolar boundaries and lung/muscle junctions. Both liver and lung models represent deep, hemoglobin-rich tissues. The skin model places luciferase-labeled cells superficially in the mouse, s.c., approximately a millimeter below the surface. Fig. 3Light attenuation through tissues revealed by in vivo spectra. The bioluminescent images and spectra were obtained using an IVIS™ 200. (a) Bioluminescent light emission was collected from skin, lung, or liver models. Representative animals are shown for each model using a pseudocolor (blue-red) image to represent bioluminescence signals, and these are superimposed over a grayscale reference image. (b) Spectral scanning was performed by collecting sequential bioluminescence images using an IVIS200 loaded with bandpass filters (filter wavelength indicated below each image). Open-filter images acquired before and after this sequence were used to calibrate the signal degradation during the scanning process. (c) Spectra collected from skin, lung, and liver are compared with those from labeled cells in culture . Photon fluxes are normalized to the values at for beetle luciferases and for Renilla luciferase (indicated at green arrow). Hemoglobin absorption curves (average values of oxy-Hb and deoxy-Hb) are plotted as background (shaded in gray). 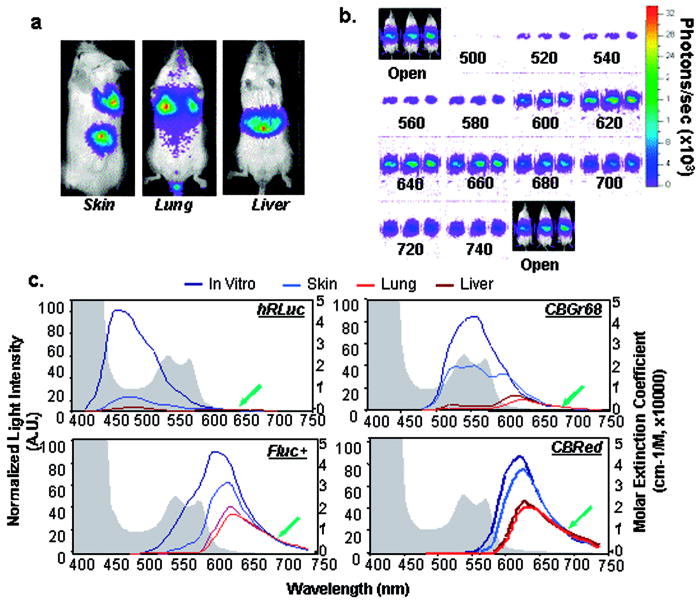 In vivo spectra were obtained by collecting sequential bioluminescent images using bandpass filters . Figure 3(b) shows a spectral stack from three mice from the liver model. Open-filter images were acquired before and after this sequence, so that the difference of total flux, which resulted from signal degradation during the scanning process, could be used to calibrate the sequential imaging data. The entire sequence was acquired in less than five minutes to minimize signal deterioration due to substrate exhaustion. The spectra for each luciferase were normalized by the value at ( for hRLuc), where tissue absorption is at a minimum. This normalization allows for a qualitative, although not quantitative, observation of the light attenuation for the various tissues and signal depths. The in vivo spectra of four luciferases revealed a significant attenuation of light at wavelengths below , especially in the deep tissue models (lung and liver), due to hemoglobin absorption. FLuc and CBRed, with emission above , displayed the least spectral attenuation in all animal models, and therefore appear to be the most suitable for BLI when maximum sensitivity is needed [Fig. 3(c)]. The CBGr68 light emission spectrum ranged from and was nearly a direct inverse of the hemoglobin absorption spectrum, indicating that it is absorption by this pigment that largely accounts for the attenuation. Therefore, as could be predicted, most emitted light from CBGr68 is absorbed [Fig. 3(c)]. For hRLuc, only skin and liver models were used, since hRLuc signals in the lung model were either too weak to detect when coelenterazine was administered i.p., or the substrate was depleted too rapidly from this tissue to provide a reasonable window to perform spectral scanning after i.v. administration of the substrate. Although it has proven to be a successful reporter for imaging of signals originating from subcutaneous sites,19 hRLuc showed great attenuation in deep tissue models [Fig. 3(c)]. In addition, rapid utilization of coelenterazine substrate necessitates imaging immediately following administration,14, 20 which places constraints on imaging protocols. Signals from hRLuc-expressing cells in deep tissues have been obtained by increasing the amount of injected substrate over those reported initially ( compared to the usual ),19 suggesting that nonsaturating doses of substrate are typically used when imaging hRLuc signals, but cost and possible toxicity of the substrate, or its buffer (containing methanol), may prevent routine use of such elevated doses. 3.5.Construction and Characterization of Fusion Luciferases with CBGr68 and CBRedThe CBGr68 coding sequence, sharing 68.9% gene identity with the CBRed gene, was selected to create a gene fusion with CBRed. This lower sequence homology of CBGr68, relative to CBGr99 with 99% sequence homology, was selected to reduce the likelihood of homologous recombination between the coding regions of the two reporter genes. Genes of CBGr68 and CBRed were fused to create translational fusions in both orientations, CBGr68-CBRed and CBRed-CBGr68, with a DNA linker encoding a glycine/serine rich peptide [Fig. 4(a) ]. The junction regions were sequenced and mRNA levels for each gene in the fusion were determined using real-time RT-PCR [Fig. 4(c)]. Fig. 4Construction and characterization of fusion luciferase genes composed of CBGr68 and CBRed. (a) Design of fusion constructs: coding sequences of CBGr68 and CBRed were fused to generate a translational fusion in both orientations (pCB-RG and pCB-GR) with a DNA linker encoding a glycine/serine rich peptide between the two open reading frames. (b) Broad spectra were detected in culture, using the spectrometer, from C6 cells transiently transfected with pCB-RG, pCB-GR, or cotransfected with equal amounts of CBGr68 and CBRed [CB- ]. Changes of spectral shapes are observed for each case when the temperature increases. (c) Message RNA levels for CBGr68 and CBRed, determined by real-time RT-PCR, are compared in two fusion luciferases or CB- expressed in the liver . (d) In vivo spectra were collected from the liver samples expressing pCB-RG or pCB-GR. Photon flux was normalized to the values at (indicated at green arrow). Hemoglobin absorption curves were plotted as background (shaded in gray).  Compared to CBGr68 or CBRed, both fusion luciferases displayed broader spectra (roughly ranging from ) when expressed in mammalian cells, with two peaks corresponding to of CBGr68 and CBRed [Fig. 4(b)]. When the temperature was elevated, the overall light output increased and was accompanied with some overall spectral changes due to unequal activation of CBGr68 and CBRed; thermal activation of CBRed seems higher than that of CBGr68 [Fig. 4(b)]. The spectral profile of cotransfected CBGr68/CBRed and its thermal activation are more comparable to CB-RG than CB-GR. In the liver model, both fusion luciferases showed similar light intensity as well as similar emission spectra with the around . Most green light was attenuated in both fusions [Fig. 4(d)], although more light attenuation is apparent in the region of hemoglobin absorption with the CB-RG fusion [Fig. 4(d)], suggesting that this fusion might be a more useful reporter for depth of tissue determination in spectral imaging strategies. 3.6.Comparison of Luciferase Light Output in Culture and In VivoExpression and light production of each luciferase was compared in cultured C6 cells transiently transfected by equimolar amounts of luciferase plasmids. The dual luciferase fusions showed higher activity than either individual luciferase. Activity of Fluc+ at was , and the relative activity for each luciferases was FLuc:CBGr68:CBRed:CB-GR:CB-RG at 1.0:1.3:0.8:1.5:1.9 [Fig. 5(a) ]. Similar mRNA levels were detected by real-time RT-PCR, demonstrating they have similar transcriptional activities (data not shown). However, measurement of protein levels by Western blots or ELISAs was not feasible due to lack of antibodies for the click beetle luciferases. Fig. 5Comparison of luciferase light output in cell culture and in tissues. (a) Light intensities are compared from the luciferase-labeled C6 cells in culture or from the tissues like the skin or lung, where the same amount of labeled cells were implanted . (b) Intensities of surface-emitted light are compared in hepatically expressed luciferase .  To determine the efficiency of light transmission through different depths of tissue compared to the total flux of the cells, cells were harvested from growing cultures, washed, and equal numbers of cells injected under the skin (subcutaneous), into the tail vein (i.v. to the lungs) or back into a culture dish containing fresh media. Harvesting and injection of cells decreases the total photon flux of mammalian cells (data not shown), so selecting the correct control was important to determine photon transmission efficiency for each model. Table 1 (columns 1 and 2) reports the ratio of light flux collected from the subcutaneous and lung model over light flux collected from the same number of cells imaged in a culture dish. As expected, for beetle luciferases and the fusions, 15 to 25% of light was apparently transmitted through skin (superficial tissue site) and detected, but only 1 to 2.5% of light appears to be transmitted through tissues when originating from the lung (deep tissue) [Fig. 5(a), Table 1]. Besides tissue absorption, substrate availability might also be a contributing factor to the levels of signal detected in the skin model. Although luciferin was provided at a concentration that is likely in excess at most tissue sites , local concentrations might not be sufficient due to uneven biodistribution.21 hRLuc was not included in this study due to the different route of substrate administration (i.v. for coelenterazine while i.p for luciferin) and the nonsaturating dose of coelenterazine that was used in this study and that has been reported previously .14, 20 Table 1Transmission efficiency of luciferases in vivo.
Light collected externally from luciferase expressed from liver cells was evaluated by selecting the abdominal region as the ROI. The relative flux collected from mice following in vivo liver transfections of the various luciferin utilizing enzymes (Table 1, column 3) was normalized by a reference value chosen arbitrarily to be that of hRLuc with i.p. injection of coelenterazine. The dual luciferase fusions produced the greatest signal, while the CBGr68 signal was significantly less than Fluc+ and CBRed [Fig. 5(b), Table 1]. The mRNA levels for each luciferase in excised liver tissues were roughly the same (data not shown), therefore, the difference in light output from mice expressing Fluc+, CBGr68, and CBRed were not due to differences in transcriptional activity, but rather due to differential absorption of light by the tissues overlying the signal. This further supports the data from the previous experiment [Fig. 3(c)]. Signals from hRluc-transfected liver were also measured after coelenterazine ( BW) was administered i.p. [ , Fig. 5(b)]. Previous data indicated that a 36.2-fold higher signal was detected when coelenterazine was administered i.v. ( , Table 1); yet since the kinetics of signal loss were too rapid following i.v. administration of the substrate, the i.p. route was utilized.16 4.ConclusionsWe present the first comparative study of spectral imaging for four commonly used bioluminescent reporters in live animals, and two novel dual luciferase fusions. In addition to the many other considerations in the selection of a reporter for in vivo applications, the emission spectrum and its stability versus temperature are crucial determinants of maximum sensitivity of detection and utility. Each reagent and reporter will have advantages and disadvantages, and in any in vivo study the optical properties of tissues will influence our ability to detect and quantify signals from enzymes with different spectra of emission. This study emphasizes the influences of tissues on BLI and the currently available reporter genes, and reveals general principles of tissue optics that carry over to all in vivo optical imaging modalities, including those that use reporter genes. Although this study was performed using genes encoding bioluminescent reporters, the optical properties of tissues will have the same impact on fluorescent reporters and dyes. In particular, we show that luciferases such as FLuc and CBRed are preferred for animal models with sources deep inside the body, since a larger fraction of their emission spectra lies in the red wavelength range where light penetrates more readily through tissues than light in the blue and green regions of the spectrum (shorter wavelengths). Spectral imaging of optical reporters in vivo is the next advance in the field of optical molecular imaging, in that the spectra of the detected light carry information about tissue depth and source intensity. If understood, the emitted spectra will contribute greatly to improving our images by providing 3-D datasets and refining quantification. From the measurements reported in this study, it is shown that Fluc is a useful reporter because its spectrum contains both a red and green component that can be used for spectral methods to determine depth. Furthermore, the dual CBGr68/CBRed luciferase fusions produced even broader spectral profiles than FLuc, and therefore it is possible that they will provide additional tissue optical contrast and further improve calculations of the signal depth and source localization in tissue. This suggestion is supported by our preliminary experiments conducted in the liver model in this study. The data from this study will have broad implications in how we interpret data, quantify signals, and write the next generation of algorithms for image reconstruction. AcknowledgmentsThis work is supported, in part, by grants from the NIH (RO1HD37543 and R24CA92862) and NSF (002865-SU, NSF Center for Biophotonics Science and Technology), in addition to unrestricted gifts from Philips Medical and the Lucille Packard Foundation. ReferencesC. H. Contag,
P. R. Contag,
J. I. Mullins,
S. D. Spilman,
D. K. Stevenson, and
D. A. Benaron,
“Photonic detection of bacterial pathogens in living hosts,”
Mol. Microbiol., 18 593
–603
(1995). https://doi.org/10.1111/j.1365-2958.1995.mmi_18040593.x 0950-382X Google Scholar
C. H. Contag,
S. D. Spilman,
P. R. Contag,
M. Oshiro,
B. Eames,
P. Dennery,
D. K. Stevenson, and
D. A. Benaron,
“Visualizing gene expression in living mammals using a bioluminescent reporter,”
Photochem. Photobiol., 66 523
–531
(1997). 0031-8655 Google Scholar
Y. A. Cao,
A. J. Wagers,
A. Beihack,
J. Dusich,
M. H. Bachmann,
R. S. Negrin,
I. L. Weissman, and
C. H. Contag,
“Shifting foci of hematopoiesis during reconstitution from single stem cells,”
Proc. Natl. Acad. Sci. U.S.A., 101 221
–226
(2004). https://doi.org/10.1073/pnas.2637010100 0027-8424 Google Scholar
M. Edinger,
Y. A. Cao,
M. R. Verneris,
M. H. Bachmann,
C. H. Contag, and
R. S. Negrin,
“Revealing lymphoma growth and the efficacy of immune cell therapies using in vivo bioluminescence imaging,”
Blood, 101 640
–648
(2003). https://doi.org/10.1182/blood-2002-06-1751 0006-4971 Google Scholar
K. E. Luker,
M. C. Smith,
G. D. Luker,
S. T. Gammon,
H. Piwnica-Worms, and
D. Piwnica-Worms,
“Kinetics of regulated protein-protein interactions revealed with firefly luciferase complementation imaging in cells and living animals,”
Proc. Natl. Acad. Sci. U.S.A., 101 12288
–12293
(2004). https://doi.org/10.1073/pnas.0404041101 0027-8424 Google Scholar
R. Paulmurugan,
Y. Umezawa, and
S. S. Gambhir,
“Noninvasive imaging of protein-protein interactions in living subjects by using reporter protein complementation and reconstitution strategies,”
Proc. Natl. Acad. Sci. U.S.A., 99 15608
–15613
(2002). https://doi.org/10.1073/pnas.242594299 0027-8424 Google Scholar
P. Ray,
H. Pimenta,
R. Paulmurugan,
F. Berger,
M. E. Phelps,
M. Lyer, and
S. S. Gambhir,
“Noninvasive quantitative imaging of protein-protein interactions in living subjects,”
Proc. Natl. Acad. Sci. U.S.A., 99 3105
–3110
(2002). https://doi.org/10.1073/pnas.052710999 0027-8424 Google Scholar
B. W. Rice,
M. D. Cable, and
M. B. Nelson,
“In vivo imaging of light-emitting probes,”
J. Biomed. Opt., 6
(4), 432
–440
(2001). https://doi.org/10.1117/1.1413210 1083-3668 Google Scholar
C. H. Contag and
M. H. Bachmann,
“Advances in in vivo bioluminescence imaging of gene expression,”
Annu. Rev. Biomed. Eng., 4 235
–260
(2002). https://doi.org/10.1146/annurev.bioeng.4.111901.093336 1523-9829 Google Scholar
T. C. Doyle,
S. M. Burns, and
C. H. Contag,
“In vivo bioluminescence imaging for integrated studies of infection,”
Cell. Microbiol., 6 303
–317
(2004). 1462-5814 Google Scholar
O. Coquoz,
T. L. Troy,
D. Jekic-McMullen, and
B. W. Rice,
“Determination of depth of in vivo bioluminescent signals using spectral imaging techniques,”
Proc. SPIE, 4967 37
–45
(2003). 0277-786X Google Scholar
J. Mobley and
T. Vo-Dinh,
“Optical properties of tissue,”
Biomedical Photonic Handbook, CRC Press, Boca Raton, FL (2003). Google Scholar
V. Tuchin, Tissue Optics, SPIE Press, Bellingham, WA (2000). Google Scholar
H. Zhao,
T. C. Doyle,
R. J. Wong,
Y. Cao,
D. K. Stevenson,
D. Piwnica-Worms, and
C. H. Contag,
“Characterization of coelenterazine analogs for measurements of Renilla luciferase activity in live cells and living animals,”
Mol. Imaging, 3 43
–54
(2004). Google Scholar
J. McCafferty,
A. D. Griffiths,
G. Winter, and
D. J. Chiswell,
“Phage antibodies: filamentous phage displaying antibody variable domains,”
Nature (London), 348 552
–554
(1990). https://doi.org/10.1038/348552a0 0028-0836 Google Scholar
G. Zhang,
V. Budker, and
J. A. Wolff,
“High levels of foreign gene expression in hepatocytes after tail vein injections of naked plasmid DNA,”
Hum. Gene Ther., 10 1735
–1737
(1999). 1043-0342 Google Scholar
F. Liu,
Y. Song, and
D. Liu,
“Hydrodynamics-based transfection in animals by systemic administration of plasmid DNA,”
Gene Ther., 6 1258
–1266
(1999). https://doi.org/10.1038/sj.gt.3300947 0969-7128 Google Scholar
B. Baggett,
R. Roy,
S. Momen,
S. Morgan,
L. Tisi,
D. Morse, and
R. Gillies,
“Thermostability of Firefly luciferase affects efficiency of detection by in vivo bioluminescence,”
Mol. Imaging, 3 324
–332
(2004). Google Scholar
S. Bhaumik,
X. Z. Lewis, and
S. S. Gambhir,
“Optical imaging of Renilla luciferase, synthetic Renilla luciferase, and firefly luciferase reporter gene expression in living mice,”
J. Biomed. Opt., 9 578
–586
(2004). https://doi.org/10.1117/1.1647546 1083-3668 Google Scholar
S. Bhaumik and
S. S. Gambhir,
“Optical imaging of Renilla luciferase reporter gene expression in living mice,”
Proc. Natl. Acad. Sci. U.S.A., 99 377
–382
(2002). https://doi.org/10.1073/pnas.012611099 0027-8424 Google Scholar
K. H. Lee,
S. S. Byun,
J. Y. Paik,
S. Y. Lee,
S. H. Song,
Y. S. Choe, and
B. T. Kim,
“Cell uptake and tissue distribution of radioiodine labelled D-luciferin: implications for luciferase based gene imaging,”
Nucl. Med. Commun., 24 1003
–1009
(2003). 0143-3636 Google Scholar
|
||||||||||||||||||||||||||||||||


