|
|
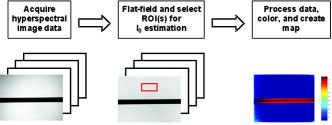
1.IntroductionIt has been known for nearly that hypoxic cells are more radioresistant than aerobic cells.1 In most normal tissues, there is sufficient redundancy in vascular density such that only small oxygen gradients exist between microvessels, and hypoxia does not develop. In tumors, lowered vascular density, irregular vascular geometry, longitudinal oxygen gradients (drop in vascular in afferent direction from feeding arteriole), rheologic effects (increased blood viscosity from lowered vascular ), and oxygen consumption that is out of balance with supply are among the contributors to the development of hypoxia in tumors.2, 3 In recent years, hypoxia has been shown to be of prognostic value in several clinical trials involving radiation, chemotherapy, and surgery.4, 5, 6, 7, 8, 9 Consequently, the effects of hypoxia reach beyond the realm of radioresistance to the core of aberrant tumor biology typified by altered gene expression, multidrug resistance, tumor cell invasiveness, angiogenesis, and metastasis.10, 11 Studies of tumor oxygenation at the microvascular and microregional levels provide understanding of tumor oxygen transport on dimensional scales comparable to the diffusion distance of oxygen in tissue .12 To fully grasp the significance of blood oxygen delivery and hypoxia at the microvascular level, the spatial and temporal relationship of blood oxygenation data must be preserved and mapped. Polarographic microelectrodes are a well-established method of measuring tissue at the microvascular level.12 However, this technique can be technically difficult to perform and does not provide a spatial map of data to the extent that is required to increase understanding of oxygen delivery at the microvascular network and regional level. In contrast, quantitative imaging methods, such as hyperspectral imaging, can provide spatial maps of blood oxygenation in terms of hemoglobin saturation at the microvascular level, and these measurements can be performed serially in the same animal in a noninvasive fashion with relative technical ease. Using a 4T1 mouse mammary carcinoma that constitutively expresses the red fluorescent protein (RFP) DsRed, and co-expresses enhanced green fluorescent protein (GFP) that responds to hypoxia under the control of the hypoxia regulatory element (HRE) promoter, we can study tumor development and the evolution of tumor hypoxia starting at very early stages by directly imaging tumors grown in dorsal skin-fold window chambers. Serial measurements of RFP fluorescence enable tracking of the tumor cells and tumor growth over time, while GFP fluorescence indicates tumor regions that have become hypoxic. This information can be combined with measurements of hemoglobin saturation in tumor-affiliated microvasculature to enhance understanding of blood oxygen delivery and the development of tumor hypoxia at the microvascular level in the early stages of tumor development. The temporal effects of various methods to ameliorate hypoxia can also be examined in fine spatio-temporal detail. Hyperspectral imaging techniques can be used to image blood perfusion in tissue13, 14 and create maps of hemoglobin saturation in blood vessels.15 Also, in cases where different fluorescence emission spectra are poorly resolved or overlap, such as with green fluorescent protein and endogenous tissue autofluorescence,16 hyperspectral imaging can be used to discriminate and classify image pixels between spectrally similar fluorophores.17, 18 In this work, calibration of the imaging system is described and in vivo results are shown. 2.Materials and Methods2.1.Imaging SystemA Zeiss Axioskop 2 microscope (Carl Zeiss, Incorporated, Thornwood, New York) served as the imaging platform. For hemoglobin saturation mapping, a tungsten halogen lamp was used for transillumination, while for fluorescence images, a mercury lamp was used for epiillumination. For RFP fluorescence, a bandpass excitation filter with a bandwidth and a longpass dichroic beamsplitter were used. For GFP fluorescence, a bandpass excitation filter with a bandwidth and a longpass dichroic beamsplitter were used (Chroma Technology Corporation, Rockingham, Vermont). Images were acquired at and dynamic range with a DVC 1412 CCD camera (DVC Company, Austin, Texas) thermoelectrically cooled to . A or Fluar objective (Carl Zeiss, Incorporated, Thornwood, New York) was used for image magnification. Bandlimited optical filtering for hyperspectral imaging was accomplished with a C-mounted liquid crystal tunable filter (LCTF) with a transmission range placed in front of the camera (CRI, Incorporated, Woburn, Massachusetts). The LCTF bandwidth is when tuned to , but is narrower at shorter wavelengths and wider at longer wavelengths. In addition, the transmission of the LCTF is lower at shorter wavelengths and higher at longer wavelengths. Images were saved as grayscale uncompressed TIF files. 2.2.Image AcquisitionA custom virtual instrument designed with Labview software (National Instruments Corporation, Austin, Texas) was used to control the tuning of the filter and operation of the camera. The software allows automated image acquisition with specifications of camera exposure time and gain for each filter wavelength. For hemoglobin saturation mapping, images were acquired from in intervals. Fluorescence images of GFP were acquired from in intervals and RFP fluorescence images were acquired from at intervals. 2.3.Tumor Cells4T1 mouse mammary carcinoma cells stably transfected with the gene for DsRed, a red-fluorescent protein (RFP), and the gene for enhanced green fluorescent protein (GFP) were used. RFP was constitutively expressed under the control of the cytomegalovirus (CMV) promoter, while GFP was up-regulated by the HIF-1 transcription factor under hypoxic conditions under control of the hypoxia regulatory element (HRE).19 2.4.System CalibrationReference spectra of the pure components of interest (oxy- and deoxyhemoglobin, RFP, and GFP) were acquired on the imaging system to account for effects due to the emission spectra of the illumination sources, the wavelength dependent transmission bandwidth of the LCTF, the transmission of the optics on the microscope, and the detection sensitivity of the camera. 2.4.1.Hemoglobin saturationSolutions of rat oxyhemoglobin and deoxyhemoglobin (Hb-R) were prepared using a modification of the protocol by Malinuskas.20 Red blood cells (RBCs) were obtained from rat blood collected from anesthetized ( pentobarbital, IP) Fischer 344 rats via cardiac puncture with a heparinized needle. A volume of concentrated PBS was added to the cell-free hemolysate, and the hemolysate was used immediately for calibration. Oxyhemoglobin solutions were obtained by repeatedly inverting the hemolysate solution in room air for several seconds, and deoxyhemoglobin solutions were created by adding sodium dithionite (Sigma-Aldrich Company, Saint Louis, Missouri) to the hemolysate solution. Square profile glass capillary tubes with a pathlength (VitroCom, Mountain Lakes, New Jersey) submerged in index-matching immersion oil (Cargille type A, Ted Pella, Incorporated, Redding, California)21 on a glass slide were used for calibrating the solutions of hemoglobin on the microscope system. An image of a blank field on the slide was used for flat-field correction.22 The concentration of hemoglobin in the calibration solutions was estimated using the Kahn method20 from spectra collected on a spectrophotometer (Lambda 2S UV/Vis, Perkin-Elmer, Fremont, California) with a spectral-slit width of . 2.4.2.GFP and RFP fluorescence4T1 mouse mammary carcinoma cells, exclusively expressing GFP or RFP, were used for calibration. Cells were cultured in Dulbecco’s Modified Eagle Medium with 10% serum on coverslips until a confluent layer was achieved. The coverslips were rinsed in PBS to remove growth media containing the pH indicator phenol red, which may contaminate the GFP and RFP fluorescence emission spectra. A small drop of PBS was placed on a glass slide, and a coverslip with cells was placed cell-side down on the drop of PBS. Fluorescence images were acquired as previously described. A fluorescence image of an alcohol solution containing Rhodamine 6G was used for flat-field correction. 2.5.Image ProcessingImage processing was performed using Matlab software (The Mathworks, Incorporated, Natick, Massachusetts). All images were converted into double-precision arrays for mathematical processing. 2.5.1.Hemoglobin saturationImages were processed to create pseudocolor hemoglobin saturation maps according to the flow diagram in Fig. 1 . The method for determining the hemoglobin saturation in the microvasculature from hyperspectral image information was based on that of Shonat 15 using the following model equation: where is the absorbance at wavelength , is the pixel value, is the pixel value of reference light, and are the extinction coefficients for and Hb-R and wavelength , respectively (calculated from measurements performed on the microscope system of pure component solutions), and [Hb-R] are the concentrations of oxy- and deoxyhemoglobin, respectively, is the pathlength, and is a pathlength-dependent scattering term. The pixel values were converted to absorbance values by manually selecting avascular regions in the images to use as an estimate of . In the model, it is assumed that and Hb-R are the dominant absorbers in blood, which is reasonable in the 500– to 650–nm wavelength range. A modification of the Shonat model to account for the wavelength-dependent scattering of blood in which scattering varies with wavelength by (Ref. 23) was also evaluated.The model equation was solved using linear least-squares regression. The calculated values of hemoglobin saturation were accepted or rejected based on the value for the fit of the calculated unknowns from the data to the model. was calculated according to the standard definition for the coefficient of determination:24 where is the error sum of squares (variance considering regressors), and is the total variance (no regressors considered).2.5.2.RFP and GFP fluorescenceImages were processed according to the flow diagram in Fig. 2 . Pixels were classified as expressing GFP or RFP using the spectral angle mapping technique.25 A normalized reference vector of GFP or RFP fluorescence was constructed from calibration data, and a data vector of fluorescence emission was constructed for each pixel in the image set. The angle between the vectors was computed as follows: where is the cosine of the angle between the reference and spectral vectors (radians), and ∥∙∥ denotes the vector two-norm. A threshold angle was chosen for rejection of pixels with measured spectra at angles to the reference greater than the threshold. Pixels were classified as GFP only if found to express both RFP and GFP (the Boolean AND operation of the two classification results).2.6.In Vitro System Tests2.6.1.Red blood cellsThe performance of the imaging system was characterized with RBCs in vitro to investigate the effects of varying hematocrit, flow rate, image acquisition time, and . Rat RBCs were harvested as described earlier, but without the lysing step. The final resuspension solution was PBS with bovine serum albumin (Sigma-Aldrich, Saint Louis, Missouri). Albumin was added to reduce the incidence of mechanical hemolysis and to block adhesion of RBCs to the glass surfaces used in the experiment.26 Square profile glass capillary tubes with 100- and pathlengths (VitroCom, Mountain Lakes, New Jersey) were connected to a 1–mL gas-tight glass syringe (Bioanalytical Systems, Incorporated, West Lafayette, Indiana) with polyethylene tubing (Clay Adams PE50, Becton Dickinson, Franklin Lakes, New Jersey). The capillary tubes were imaged as before. A syringe pump (Bioanalytical Systems, Incorporated, West Lafayette, Indiana) was used to adjust the flow rate of the RBCs through the capillary tube. Hematocrits between approximately 3 to 30% and flow rates between (corresponding to RBC velocities based on the capillary tube cross sectional area) were used. The actual velocity profile across the diameter of the capillary tube for flowing RBCs is not constant due to the concentration of flowing RBCs toward the center of the flow stream, a phenomenon that is responsible for the Fahraeus effect.27, 28 Oxyhemoglobin solutions were obtained by repeatedly inverting the RBC solution in room air for several seconds and deoxyhemoglobin solutions were created by adding sodium dithionite (Sigma-Aldrich Company, Saint Louis, Missouri) to the RBC solution. 2.6.2.Methyl green and Methylene blue dyesThe spectral angle mapping pixel classification method was tested in vitro with the absorbing dyes Methyl green and Methylene blue. A solution of each dye in water was used to calibrate the imaging system from in 5–nm intervals. Square profile glass capillary tubes with a pathlength (VitroCom, Mountain Lakes, New Jersey) were filled with dye solution and imaged as previously described. Methyl green was selected as the target dye of interest, and Methylene blue, a dye with a similar absorption spectrum to Methyl green, was used to test the classification accuracy of the spectral angle mapping technique. Two different wavelength ranges were considered: , and , and 16 images were acquired in each range in intervals. 2.7.In Vivo ImagingAll in vivo experiments were conducted under a protocol approved by the Duke University Institutional Animal Care and Use Committee. A titanium window chamber was surgically implanted under anesthesia (ketamine IP and xylazine IP) on the back of athymic nude mice (nu/nu, NCI, Frederick, Maryland). A window chamber tumor was established during chamber implantation by injecting of a single cell suspension ( cells) of tumor cells into the dorsal skin flap prior to placing a -diam number 2 round glass coverslip (Erie Scientific, Portsmouth, New Hampshire) over the exposed skin. Animals were housed in an environmental chamber at and 50% humidity with free access to food and water and standard light/dark cycles. The ambient temperature of is necessary to mimic the growing conditions of subcutaneously implanted tumors in the raised and exposed window chamber. For imaging, animals were anesthetized with ketamine ( IP) and xylazine ( IP) and placed on a heating pad attached to the microscope stage. For in vivo demonstration of the imaging of hemoglobin saturation, imaging was performed with the animal first breathing room air, then 100% oxygen though a nose cone at flow rate, and then after sacrifice by anesthetic overdose (pentobarbital, IP). For in vivo demonstration of fluorescence protein expression classification, an animal was imaged after implanting of the co-expressing 4T1 cells previously described. 3.Results3.1.In Vitro Hemoglobin Saturation Characterization—Red Blood CellsFigure 3 is a plot of the absorbance spectra of the hemoglobin calibration solutions. Data points were taken at intervals over the range of , and trend lines were fit to aid visualization of the spectra. While the precise location of peak values and isobestic points vary from spectrophotometer data due to the wavelength-dependent bandwidth of the LCTF, the curves have the characteristic shapes of and Hb-R absorption spectra reported in the literature. Figure 4 contains example hemoglobin saturation maps of RBCs in capillary tubes processed using the constant scattering model with for two different hematocrits and flow rates. The higher hematocrits and flow rates are closer to typical values that would be found in microvessels of this dimension. In general, as the hematocrit and flow rates are reduced, the maps of the capillary tubes contain more noise, and as a result, the calculated hemoglobin saturation values in a selected ROI tend to be less accurate. An image acquisition time of was used for the data in Fig. 4. Image acquisition times of less than resulted in significant inaccuracies (10 to 20%) in the measured in vitro hemoglobin saturation values. For the in vitro test conditions used in this study, the constant scattering model yielded results that were 1 to 6% closer to the expected value than the wavelength-dependent scattering model. Varying the rejection threshold from 0.80 to 0.90 had a statistically insignificant effect ( , ANOVA) on the measured hemoglobin saturation values for the selected ROIs. However, the higher values tended to reduce background noise in the hemoglobin saturation maps. Fig. 3Absorbance spectra of oxy- and deoxyhemoglobin ( and Hb-R, respectively) solutions in pathlength capillary tubes measured from in intervals on the microscope imaging system. The hemoglobin concentration of the solutions was approximately . The actual measured values are plotted as points on the graph. The trend lines were fit to aid visualization of the spectra. 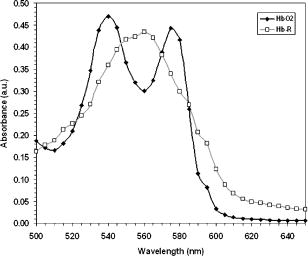 Fig. 4Example hemoglobin saturation pseudocolor maps of RBCs in pathlength capillary tubes for two different hematocrits and flow rates calculated using the constant scattering model with . The hematocrits are listed to the left of each row. The colorbar illustrates the color coding of percent hemoglobin saturation (background pixels are assigned the bottom color). The calculated hemoglobin saturation (median±semiquartile range) in an ROI (approximately ) placed in the center of the tube at the center of the image is shown in the top left corner of each map.  3.2.In Vitro Spectral Angle Mapping Characterization—DyesUsing the spectra measured on the imaging system, the spectral angle for the dyes is for the wavelength range of , while for the wavelength range of , the angle is . Figure 5 shows classification results with tubes of Methyl green and Methylene blue in the range for threshold angles of 15, 10, and . Since Methyl green was the target dye, the reference spectrum for Methyl green was used for classification, and pixels that were classified as the target dye were overlaid in red on the image of the capillary tube. Although in the range, the spectral angle between Methyl green and Methylene blue is , a threshold angle of was necessary to minimize artifacts and misclassification of pixels that occurred at larger threshold angles. In the range, Methyl green could not be distinguished from Methylene blue at thresholds less than , and at thresholds less than , the algorithm failed to classify either dye. Fig. 5Classification results for the dyes using the spectral angle mapping method in the range with the Methyl green reference spectrum. Results are shown for threshold angles of 15, 10, and . Pixels classified by the algorithm as being Methyl green are colored red and overlaid on the image of the capillary tube.  3.3.In Vivo Hemoglobin Saturation Test—Window Chamber MicrovesselsA picture of a typical dorsal skin-fold window chamber on a nude mouse five days after implantation of tumor cells is shown in Fig. 6 . Figure 7 shows example hemoglobin saturation maps of microvasculature in a dorsal skin-fold window chamber under different conditions (not the same window as in Fig. 6). The images were acquired with a exposure time and processed using the constant scattering model with . The first image in Fig. 7 (ROIs) shows the areas selected as reference areas (blue regions) for estimating a value of to convert the raw pixel values to absorbance data. Pseudocolored maps of hemoglobin saturation are shown for the conditions of breathing room air (Air), oxygen (100% ), and after sacrifice with anesthetic overdose (Sac’d). The white arrows in the first image (ROIs) indicate large vessels located deeper in the tissue that are not imaged and mapped as clearly as the superficial vessels in the chamber. In Fig. 8 , a graph of the hemoglobin saturation within the numbered ROIs in Fig. 7 (yellow areas) is shown. Using the information in Fig. 8 with hemoglobin saturation maps like those in Fig. 7, it is possible to infer changes in oxygen transport and delivery. Fig. 6Picture of a dorsal skin-fold window chamber on a nude mouse five days after implantation of tumor cells. The circled region is where the tumor is located. The outer diameter of the window is about .  Fig. 7Maps of hemoglobin saturation in window chamber microvasculature for the conditions of air breathing (Air), oxygen breathing (100% ), and after sacrifice (Sac’d). The first frame (ROIs) is an image at showing the ROIs used for estimation of (blue) and the numbered ROIs used for the graph in Fig. 8 (yellow). The white arrows indicate large vessels located deeper in the tissue.  Fig. 8Graph of the hemoglobin saturation within the selected regions of interest in Fig. 7 (numbered yellow areas in ROIs image). Each bar indicates the median±semiquartile range.  3.4.In Vivo Spectral Angle Mapping Test—Development of HypoxiaUsing the co-expressing 4T1 tumor cells implanted in window chambers, the lowest threshold angle that appeared to produce acceptable classification results was determined to be between . Below a threshold angle of , portions of tumors failed to be classified. Therefore, a threshold angle of was selected for classification. Figure 9 shows hypoxia development in a 4T1 tumor. Red pixels indicate tumor cells and green pixels indicate hypoxic tumor cells. The pixel classification results were overlaid on a transillumination image of the window chamber taken immediately prior to fluorescence imaging (the classification results were made semitransparent so that the tissue beneath could be visualized). Hypoxic cells appeared in the central region of the tumor four days after cell implantation and expanded throughout most of the tumor on the following days. 3.5.In Vivo Combined Hemoglobin Saturation/Tumor Hypoxia MapsFigure 10 illustrates combined maps showing tumor, hypoxic tumor cells, and hemoglobin saturation for the tumor in Fig. 9. Hypoxic cells initially appear in the central region of the tumor and expand throughout the tumor. Even though blood vessels with relatively well-oxygenated blood infiltrate and proliferate in the central tumor region, hypoxic cells are still present. The development of a region of vessels with a relatively low hemoglobin saturation despite the proliferation of more highly oxygenated surrounding vessels can be seen on days 8 through 10. Fig. 10Combined tumor, hypoxic tumor, and hemoglobin saturation maps showing development of tumor hypoxia and microvascular alterations over time. The white arrow in the day 8, 9, and 10 images points to the development of a region that has a relatively low hemoglobin saturation despite the proliferation of more highly oxygenated surrounding vessels.  4.DiscussionStudies of tumor oxygen delivery at the microvascular level may expand the understanding of aberrant tumor physiology and aid in the development of treatments and protocols to address or exploit tumor behavior. Quantitative imaging techniques provide a method of collecting data with spatial relationships preserved in a minimally or noninvasive fashion with relative technical ease. We are interested in studying oxygen delivery and tumor hypoxia at the microvascular network level and have developed a mouse mammary carcinoma that expresses GFP in hypoxic conditions under control of the HRE promoter. In this study, we describe our hyperspectral imaging system that will be used to measure hemoglobin saturation in tumor microvessels and classify regions of tumor hypoxia via GFP expression. In prior studies we have evaluated the impact of various features of oxygen transport by performing detailed measurements of key parameters in window chambers: 1. perivascular oxygen partial pressure (using microelectrodes),29 2. microvascular geometry (using confocal microscopy),30 3. red cell flux (using fluorescently labeled red cells),31 4. oxygen consumption rates (using profiles of between neighboring microvessels measured with microelectrodes),32 and 5. tissue fields using phosphorescence lifetime imaging.33 From these prior studies, we have identified a number of important features about the deficiencies in oxygen transport in tumors. First, collective data from many experiments were put together to create Green’s function models to determine oxygen fields in small tumor regions, typically in diameter. The insights gained with such measurements have taught us that vascular geometry has a significant impact on whether hypoxia develops in a tumor microregion, and that temporal variations in red cell flux in tumor microvessels can cause significant fluctuations in tissue , leading to transient hypoxia. Furthermore, we have found that longitudinal tissue gradients exist as the vasculature is further removed from the afferent arteriolar feed vessels. Hyperoxic gases have an impact on the tissue nearer the afferent feeding vessels, and yet have little effect on the downstream vasculature. While all of these observations have been informative, they have been limited to a single tumor model and have taken many years to obtain. A better solution for the future would be to develop a method that would allow for simultaneous measurement of all of the key parameters in a single experiment. Additionally, if such measurements could be made serially in the same animal after treatment, the insights would prove invaluable and provide data that would have been impossible to obtain using our prior methods. There have been stringent limitations imposed by the requirement to use microelectrodes to obtain detailed information on tissue and perivascular . Microelectrodes can provide precise information about the in a single location, and although they can be moved around a window tumor to obtain several point measurements, it is virtually impossible to obtain enough data to truly characterize the entire oxygen field, even in a small tumor microregion. Secondly, microelectrodes require removal of the glass coverslip, and as such are terminal and limited to a single set of measurements. To avoid this problem, we have collaborated in the past with Wilson’s group (Department of Biochemistry and Biophysics, School of Medicine, University of Pennsylvania) to use the phosphorescence lifetime imaging (PLI) method to obtain noninvasive measurements of tissue oxygen fields. However, the accumulation of dye outside of the vascular compartment over several days may impede the ability to resolve signal from only the microvessels, which are our primary interest. Using Green’s function models to incorporate vascular geometry and hemoglobin saturation of vascular segments, we can calculate oxygen fields in regions of interest30, 31 if desired, and thus, hemoglobin saturation measurements are sufficient to answer our current questions. The methods in this work circumvent many of the problems of previous research by facilitating direct measurement of microvascular hemoglobin saturation and hypoxia simultaneously from endogenous signals. We are interested in investigating oxygen transport in tumor microvessels on the size scale of arterioles, capillaries, and venules. These microvessels are prevalent in tumors, and oxygen exchange with the tissue can occur here. The hematocrit in such microvessels will generally be somewhat less than the systemic hematocrit.27, 28 For vessels with a mean diameter of , a median tumor microvascular hematocrit of 19% with an interquartile range of 8 to 23% has been reported.34 The velocity of RBCs in tumor vessels in diameter has been measured at 35 in rat mesentery and in the range of in window chamber tumors for similar sized vessels.34 Pittman notes that for microvessels in the -diam range, wavelengths in the range are useful for photometric measurements of hemoglobin saturation.21 Our choice of wavelengths in the range was based in part on the size range of the vessels of interest. This wavelength range was also a compromise between narrower bandwidths at shorter tuned wavelengths for the LCTF (bandwidth decreases with wavelength) and sufficient light transmission through the LCTF (light transmission increases with longer wavelengths). The and Hb-R spectra in Fig. 3 measured on the microscope system differ slightly from those reported in the literature measured on a spectrophotometer,36 illustrating the need to calibrate reference spectra on the imaging system itself. The hematocrits and flow rates used in the in vitro RBC tests were chosen to represent values that are expected in our vessels of interest (the higher hematocrits and flow rates), as well as extreme minimum values atypical of these vessels (the hematocrits of our vessels of interest are generally greater than about 10%). In our wavelength range, the absorbance in larger vessels with hematocrits at or near systemic level will be such that little to no signal will reach the camera, and a calculation of hemoglobin saturation will not be possible. In smaller vessels with lower hematocrits, however, the sieve effect can lead to anomalous measurements of hemoglobin saturation.21 This can be seen in Fig. 4, in which increased noise and decreased accuracy in the hemoglobin saturation maps are present in the lowest hematocrit tested. Our results indicate that increasing the threshold in the model can help reduce background noise in the images without adversely affecting the hemoglobin saturation measurements, but there is a practical upper limit to the value that can be used. At some point, pixels within the tubes (vessels) are rejected, smaller vessels can appear to have breaks, and some small vessels will be wiped out, resulting in a map that is not aesthetically pleasing or useful. A tradeoff must be made between background noise, accuracy in the hemoglobin saturation values, and a usable hemoglobin saturation map. An value of 0.90 was chosen as an acceptable value. Pittman and Duling note that random RBC motion causes fluctuations in transmitted light intensity, an effect that is more pronounced at low flow rates, necessitating longer integration times for measurement to average out the effect.37 We found that integration times of or more were required to minimize the effects. In Fig. 4, an artifact can be seen near the edges and corners of some of the hemoglobin saturation maps where pixels that should have been classified as background were instead classified as vessels, and where some pixels that should have been classified as RBCs were classified as background. This is a result of the inhomogeneous illumination field leading to a lower signal-to-noise ratio along the edges of the images. A region of interest near the center of the tube was used for the measurements in Fig. 4, because this region provides the most accurate values of hemoglobin saturation for microspectrophotometric measurements.38 Roggan describe a wavelength dependence of scattering for flowing blood,23 but in this study, the constant scattering model produced more accurate results. The wavelength dependence in the hemoglobin saturation model probably did not yield superior results due to the fact that the wavelength dependence measured by Roggan was derived from measurements on a double integrating sphere setup. Measurements made on the integrating sphere setup will yield true absorbance values, while measurements on the microscope-based system are proportional to the true absorbance due to scattering (light scattered outside the acceptance angle of the optics is not detected).37 The scattering artifact appears to affect wavelengths in the range in an approximately equal manner,37 therefore a constant scattering term is appropriate for the model. In this case, the scattering term functions like a constant additive error term in the linear regression model.24, 39 The use of fluorescent proteins to localize cells in vivo has been well established, and the use of GFP as a genetic reporter of tumor hypoxia has recently been recognized.40 However, at low expression levels and in sparsely populated regions, accurate discrimination of the target fluorescent protein from autofluorescence of tissue components and metabolites can be problematic.16 Hyperspectral imaging is one method for distinguishing between spectrally similar fluorescent species.18 We are interested in two broad classifications of the pixels—distinguishing tumor cells (RFP) from host tissue, and distinguishing hypoxic tumor cells (RFP plus GFP) from normoxic tumor cells (RFP alone). In our case, the two fluorophores of interest are spectrally well separated, but are expressed at widely varying levels within a given tumor, including low levels of expression on the order of possible spectrally overlapping endogenous fluorophores (for example, red autofluorescence of mouse skin41). Many different algorithms are available for pixel classification from hyperspectral image data. The spectral angle mapping technique was chosen for pixel classification for two reasons: 1. only knowledge of the target spectrum is required, and 2. in the ideal case, the technique is insensitive to scaling of the amplitude of the measured emission spectrum.25, 42 The images in Fig. 5 demonstrate the need to judiciously choose a threshold angle when using the spectral angle mapping technique. Although the absorbance spectra of the two dyes are separated by an angle of in the range, a threshold of was necessary to minimize artifacts and misclassification of pixels. Figure 7 is a proof-of-principle experiment to demonstrate the ability of the system to measure changes in oxygen transport. The hemoglobin saturation in an arteriole on the left of the image increases under oxygen breathing, and some oxygen is transferred to nearby venules, increasing the hemoglobin saturation in those vessels. This is not unexpected, given that arterioles are recognized as a significant source of oxygen delivery to tissues, and that venules can serve as oxygen sinks via countercurrent exchange in some cases.27, 43 After sacrifice, the hemoglobin saturation drops to about the same level in all of the vessels. With the wavelength range used to acquire the data for Fig. 7, the smallest branches cannot be accurately measured and do not appear in the hemoglobin saturation map, except possibly as disconnected regions of pixels. Very large vessels deep in the tissue like those in Fig. 7 need to be identified in the images a priori to avoid misinterpretation of the images and inadvertently selecting these areas as reference regions in the calculation of the hemoglobin saturation maps. In addition to the data in Figs. 7 and 8, the data in Table 1 from another study (in review) demonstrates a correlation between hemoglobin saturation measurements from blood gas and optical measurements. Hemoglobin saturation measurements were made on R3230 rat mammary adenocarcinoma microvessels in window chambers on Fischer 344 rats and compared to blood gas measurements (1640 oximeter coupled to a 482 co-oximeter, Instrumentation Laboratories, Lexington, Massachusetts) on blood samples from the femoral artery and femoral vein. Measurements were taken with rats breathing room air and 100% oxygen. The data in Table 1 are reported as the mean ± SEM. The optical measurements show excellent agreement with the blood gas measurements. The tumor arterioles were expected to have a lower hemoglobin saturation than samples taken from the femoral artery, given that the tumor arterioles are more distally located along the blood distribution pathway than the femoral arteries.44 Table 1Comparison of blood gas and optical measurements of hemoglobin saturation.
Figure 9 shows classification results of fluorescent protein expression in a 4T1 tumor. An area of hypoxic cells appeared in the central tumor region four days after cell implantation and continued to expand outward so that by day eight, most of the visible tumor cells were hypoxic (expressing GFP). By day three, a margin of angiogenic vessels was observed surrounding the tumor mass. This pattern of growth has been reported previously for this tumor line45 and represents a proangiogenic border stimulated by vascular endothelial growth factor (VEGF) and basic fibroblast growth factor (bFGF).46 The growth pattern is most likely the result of angiogenesis at the tumor center lagging behind tumor mass expansion at the periphery. In addition, vessel remodeling in the tumor center may contribute to lower vascular density.47 Figure 10 demonstrates the utility of the combined maps showing hypoxia development and hemoglobin saturation. Ubiquitous GFP expression, despite expansion of the microvascular network with blood vessels that are relatively well oxygenated, indicate that reasons other than chronically poor oxygen delivery may be responsible for HIF-1 upregulation. Unstable blood flow leading to fluctuating hypoxic episodes is one such possibility. 5.SummaryWe describe the application of our microscope-based hyperspectral imaging system for tumor oxygen transport studies. Using unique tumor cell lines with molecular reporters as markers of tumor physiology, we will use the system to study the effects of drugs and treatment protocols on oxygen transport in tumor microvasculature, angiogenesis, tumor growth, and development of hypoxia. Our system is designed for tumors grown in dorsal skin-fold window chambers. Hemoglobin saturation maps are generated from transillumination images to image vessels in the -diam range. A spectral angle-mapping algorithm will be used to identify fluorescent protein expression in the tumors and distinguish the expression of fluorescent proteins from endogenous tissue fluorophores. The temporal and spatial information gathered from the images may provide unique insights into oxygen transport and tumor physiology at the microvascular level. AcknowledgmentsThe authors thank Joseph Bonaventura (University of Puerto Rico-Mayagüez) for helpful suggestions in preparing fresh solutions of hemoglobin, and Jonathan Stamler (Duke University Medical Center) for use of the spectrophotometer. Pierre Sonveaux (Duke University Medical Center) generously shared data that provided useful information regarding results obtained in this study. The authors also thank Ross Shonat (Worcester Polytechnic Institute, Worcester, Massachusetts) and Timothy Secomb (University of Arizona, Tuscon) for insightful discussions on processing of the hemoglobin saturation data. Funding for this project was provided in part by NIH grants R01 CA 40355 (NCI), P50 CA 068438 (NCI), and T32 EB01630 (NIBIB). ReferencesE. G. Hall,
“The oxygen effect and reoxygenation,”
Radiobiology for the Radiologist, 133
–152 4th ed.J. B. Lippincott Company, Philadelphia (1994). Google Scholar
M. W. Dewhirst,
“Concepts of oxygen transport at the microcirculatory level,”
Semin. Radiat. Oncol., 8 143
–150
(1998). 1053-4296 Google Scholar
C. J. Gulledge and
M. W. Dewhirst,
“Tumor oxygenation: a matter of supply and demand,”
Anticancer Res., 16 741
–749
(1996). 0250-7005 Google Scholar
D. M. Brizel,
G. S. Sibley,
L. R. Prosnitz,
R. L. Scher, and
M. W. Dewhirst,
“Tumor hypoxia adversely affects the prognosis of carcinoma of the head and neck,”
Int. J. Radiat. Oncol., Biol., Phys., 38 285
–289
(1997). https://doi.org/10.1016/S0360-3016(97)00101-6 0360-3016 Google Scholar
D. M. Brizel,
R. K. Dodge,
R. W. Clough, and
M. W. Dewhirst,
“Oxygenation of head and neck cancer: changes during radiotherapy and impact on treatment outcome,”
Radiother. Oncol., 53 113
–117
(1999). https://doi.org/10.1016/S0167-8140(99)00102-4 0167-8140 Google Scholar
M. Nordsmark and
J. A. Overgaard,
“Confirmatory prognostic study on oxygenation status and loco-regional control in advanced head and neck squamous cell carcinoma treated by radiation therapy,”
Radiother. Oncol., 57 39
–43
(2000). https://doi.org/10.1016/S0167-8140(00)00223-1 0167-8140 Google Scholar
M. Hockel,
K. Schlenger,
B. Aral,
M. Mitze,
U. Schaffer, and
P. Vaupel,
“Association between tumor hypoxia and malignant progression in advanced cancer of the uterine cervix,”
Cancer Res., 56 4509
–4515
(1996). 0008-5472 Google Scholar
M. Hockel,
K. Schlenger,
S. Hockel,
B. Aral,
U. Schaffer, and
P. Vaupel,
“Tumor hypoxia in pelvic recurrences of cervical cancer,”
Int. J. Cancer, 79 365
–369
(1998). 0020-7136 Google Scholar
G. Pitson,
A. Fyles,
M. Milosevic,
J. Wylie,
M. Pintilie, and
R. Hill,
“Tumor size and oxygenation are independent predictors of nodal diseases in patients with cervix cancer,”
Int. J. Radiat. Oncol., Biol., Phys., 51 699
–703
(2001). https://doi.org/10.1016/S0360-3016(01)01662-5 0360-3016 Google Scholar
A. J. Giaccia,
“Hypoxic stress proteins: survival of the fittest,”
Semin. Radiat. Oncol., 6 46
–58
(1996). 1053-4296 Google Scholar
J. M. Brown and
A. J. Giaccia,
“The unique physiology of solid tumors: opportunities (and problems) for cancer therapy,”
Cancer Res., 58 1408
–1416
(1998). 0008-5472 Google Scholar
M. W. Dewhirst,
B. Klitzman,
R. D. Braun,
D. M. Brizel,
Z. A. Haroon, and
T. W. Secomb,
“Review of methods used to study oxygen transport at the microcirculatory level,”
Int. J. Cancer, 90 237
–255
(2000). https://doi.org/10.1002/1097-0215(20001020)90:5<237::AID-IJC1>3.3.CO;2-K 0020-7136 Google Scholar
S. P. Nighswander-Rempel,
R. A. Shaw,
J. R. Mansfield,
M. Hewko,
V. V. Kupriyanov, and
H. H. Mantsch,
“Regional variations in myocardial tissue oxygenation mapped by near-infrared spectroscopic imaging,”
J. Mol. Cell. Cardiol., 34 1195
–1203
(2002). https://doi.org/10.1006/jmcc.2002.2058 0022-2828 Google Scholar
K. J. Zuzak,
M. D. Schaeberle,
E. N. Lewis, and
I. W. Levin,
“Visible reflectance and hyperspectral imaging: characterization of a noninvasive, in vivo system for determining tissue perfusion,”
Anal. Chem., 74 2021
–2028
(2002). https://doi.org/10.1021/ac011275f 0003-2700 Google Scholar
R. D. Shonat,
E. S. Wachman,
W. H. Niu,
A. P. Koretsky, and
D. L. Farkas,
“Near-simultaneous hemoglobin saturation and oxygen tension maps in mouse brain using an AOTF microscope,”
Biophys. J., 73 1223
–1231
(1997). 0006-3495 Google Scholar
N. Billinton and
A. W. Knight,
“Seeing the wood through the trees: a review of techniques for distinguishing green fluorescent protein from endogenous autofluorescence,”
Anal. Biochem., 291 175
–197
(2001). https://doi.org/10.1006/abio.2000.5006 0003-2697 Google Scholar
D. L. Farkas,
C. Du,
G. W. Fisher,
C. Lau,
W. Niu,
E. S. Wachman, and
R. M. Levenson,
“Non-invasive image acquisition and advanced processing in optical bioimaging,”
Comput. Med. Imaging Graph., 22 89
–102
(1998). 0895-6111 Google Scholar
R. Lansford,
G. Bearman, and
S. L. Fraser,
“Resolution of multiple green fluorescent protein color variants and dyes using two-photon microscopy and imaging spectroscopy,”
J. Biomed. Opt., 6
(3), 311
–318
(2001). https://doi.org/10.1117/1.1383780 1083-3668 Google Scholar
B. J. Moeller,
Y. Cao,
C. Y. Li, and
M. W. Dewhirst,
“Radiation activates HIF-1 to regulate vascular radiosensitivity in tumors: role of reoxygenation, free radicals, and stress granules,”
Cancer Cells, 5 429
–441
(2004). 1042-2196 Google Scholar
R. A. Mailinuskas,
“Plasma hemoglobin measurement techniques for the in vitro evaluation of blood damage caused by medical devices,”
Artif. Organs, 21 1255
–1267
(1997). 0160-564X Google Scholar
R. Pittman,
“Microvessel blood oxygen measurement techniques,”
Microcirculatory Technology, 367
–389 Academic Press, Orlando (1986). Google Scholar
D. Shotton,
“An introduction to digital image processing and image display in electronic light microscopy,”
Electronic Light Microscopy—Techniques in Modern Biomedical Microscopy, 39
–70 Wiley-Liss, New York (1993). Google Scholar
A. Roggan,
M. Friebel,
K. Dörschel,
A. Hahn, and
G. Müller,
“Optical properties of circulating human blood in the wavelength range ,”
J. Biomed. Opt., 4
(1), 36
–46
(1999). https://doi.org/10.1117/1.429919 1083-3668 Google Scholar
D. C. Montgomery and
E. A. Peck, Introduction to Linear Regression Analysis, 1
–132 2nd ed.Wiley-Liss, New York (1992). Google Scholar
A. A. Nielsen,
“Spectral mixture analysis: Linear and semi-parametric full and iterated partial unmixing in multi- and hyperspectral image data,”
Int. J. Comput. Vis., 42 17
–37
(2001). https://doi.org/10.1023/A:1011181216297 0920-5691 Google Scholar
R. Sümpelmann,
T. Schürholz,
G. Marx, and
R. Zander,
“Protective effects of plasma replacement fluids on erythrocytes exposed to mechanical stress,”
Anaesthesia, 55 976
–979
(2000). 0003-2409 Google Scholar
A. S. Popel and
R. N. Pittman,
“Mechanics and transport in the microcirculation,”
The Biomedical Engineering Handbook: Second Edition, CRC Press, Boca Raton, FL (2000). Google Scholar
R. K. Jain,
“Determinants of tumor blood flow: a review,”
Cancer Res., 48 2647
–2658
(1988). 0008-5472 Google Scholar
M. W. Dewhirst,
E. T. Ong,
B. Klitzman,
T. W. Secomb,
R. Z. Vinuya,
R. Dodge,
D. Brizel, and
J. F. Gross,
“Perivascular oxygen tensions in a transplantable mammary tumor growing in a dorsal flap window chamber,”
Radiat. Res., 130 171
–182
(1992). 0033-7587 Google Scholar
T. W. Secomb,
R. Hsu,
R. D. Braun,
J. R. Ross,
J. F. Gross, and
M. W. Dewhirst,
“Theoretical simulation of oxygen transport to tumors by three-dimensional networks of microvessels,”
Oxygen Transport to Tissue XX, 629
–634 Plenum Press, New York (1998). Google Scholar
H. Kimura,
R. D. Braun,
E. T. Ong,
R. Hsu,
T. W. Secomb,
D. Papahadjopoulos,
K. Hong, and
M. W. Dewhirst,
“Fluctuations in red cell flux in tumor microvessels can lead to transient hypoxia and reoxygenation in tumor parenchyma,”
Cancer Res., 56 5522
–5528
(1996). 0008-5472 Google Scholar
M. W. Dewhirst,
T. W. Secomb,
E. T. Ong,
R. Hsu, and
J. F. Gross,
“Determination of local oxygen consumption rates in tumors,”
Cancer Res., 54 3333
–3336
(1994). 0008-5472 Google Scholar
M. W. Dewhirst,
E. T. Ong,
R. D. Braun,
B. Smith,
B. Klitzman,
S. M. Evans, and
D. Wilson,
“Quantification of longitudinal tissue gradients in window chamber tumours: impact on tumour hypoxia,”
Br. J. Cancer, 79 1717
–1722
(1999). https://doi.org/10.1038/sj.bjc.6690273 0007-0920 Google Scholar
D. M. Brizel,
B. Klitzman,
J. M. Cook,
J. Edwards,
G. Rosner, and
M. W. Dewhirst,
“A comparison of tumor and normal tissue microvascular hematocrits and red cell fluxes in a rat window chamber model,”
Int. J. Radiat. Oncol., Biol., Phys., 25 269
–276
(1993). 0360-3016 Google Scholar
T. Suzuki,
K. Yanagi,
K. Ookawa,
K. Hatakeyama, and
N. Ohshima,
“Flow visualization of microcirculation in solid tumor tissues: intravital microscopic observation of blood circulation by use of a confocal laser scanning microscope,”
Front Med. Biol. Eng., 7 253
–263
(1996). 0921-3775 Google Scholar
O. W. Van Assendelft, Spectrophotometry of Haemoglobin Derivatives, 55
–57 Charles C. Thomas, Springfield (1970). Google Scholar
R. Pittman and
B. R. Duling,
“Measurement of percent oxyhemoglobin in the microvasculature,”
J. Appl. Phys., 38 321
–327
(1975). 0021-8979 Google Scholar
S. Patel and
R. N. Pittman,
“Impact of microscope numerical aperture on microspectrophotometric measurements of hemoglobin in microvessels,”
Microvasc. Res., 64 198
–206
(2002). 0026-2862 Google Scholar
K. R. Beebe and
B. R. Kowalski,
“An introduction to multivariate calibration and analysis,”
Anal. Chem., 59 1007A
–1017A
(1987). 0003-2700 Google Scholar
D. Vordemark,
T. Shibata, and
J. M. Brown,
“Green fluorescent protein is a suitable reporter of tumor hypoxia despite and oxygen requirement for chromophore formation,”
Neoplasia, 3 1
–8
(2001). 1522-8002 Google Scholar
M. Yang,
E. Baranov,
A. R. Moossa,
S. Penman, and
R. M. Hoffman,
“Visualizing gene expression by whole-body fluorescence imaging,”
Proc. Natl. Acad. Sci. U.S.A., 97 12278
–12282
(2000). https://doi.org/10.1073/pnas.97.22.12278 0027-8424 Google Scholar
N. Kishava and
J. F. Mustard,
“Spectral unmixing,”
IEEE Signal Process. Mag., 19 44
–57
(2002). 1053-5888 Google Scholar
M. Intaglieta,
P. C. Johnson, and
R. M. Winslow,
“Microvascular and tissue oxygen distribution,”
Cardiovasc. Res., 32 632
–643
(1996). 0008-6363 Google Scholar
B. R. Duling and
R. M. Berne,
“Longitudinal gradients in periarteriolar oxygen tension. A possible mechanism for the participation of oxygen in local regulation of blood flow,”
Circ. Res., 27 669
–678
(1970). 0009-7330 Google Scholar
S. Shan,
B. Sorg, and
M. W. Dewhirst,
“A novel rodent mammary window of orthotopic breast cancer for intravital microscopy,”
Microvasc. Res., 65 109
–117
(2003). 0026-2862 Google Scholar
C.-Y. Li,
S. Shan,
Q. Huang,
R. D. Braun,
J. Lanzen,
K. Hu,
P. Lin, and
M. W. Dewhirst,
“Initial stages of tumor cell-induced angiogenesis: evaluation via skin window chambers in rodent models,”
J. Natl. Cancer Inst., 92 143
–147
(2000). https://doi.org/10.1093/jnci/92.2.143 0027-8874 Google Scholar
M. W. Dewhirst,
R. Richardson,
I. Cardenas-Navia, and
Y. Cao,
“The relationship between the tumor physiologic microenvironment and angiogenesis,”
Hematol. Oncol. Clin. North Am., 18 973
–990
(2004). https://doi.org/10.1016/0167-8191(92)90011-U 0889-8588 Google Scholar
|
|||||||||||||||||||