
|
|
1.Background and MotivationOptical coherence tomography (OCT) is a noncontact, nondestructive imaging modality that acquires depth-resolved 2- and 3-D images of biological tissue.1 Since its introduction in 1991, the vast majority of OCT imaging systems have employed the principles of time domain (TD) low coherence interferometry. In low coherence interferometry, an interferometric signal is generated if and only if the pathlength of a sample reflector matches that of the scanning reference reflector. In this approach, spectral information is integrated at a single photodiode, and the interferometric signal for a single sample reflector is given by: where is the optical wavenumber, is the pathlength mismatch between the reference and sample reflectors, is the source spectral density, and and are the reference and sample arm reflectivities, respectively. The inefficiency presented by the approach arises because, while all depths of a sample are illuminated, signal is generated in a serial manner by scanning of the reference arm. The magnitude of the inefficiency is on the order of the ratio of the scan depth to the coherence length , which is typically to . In this context, coherence length refers to the width of the axial coherence function (i.e., axial point spread function).In 1995, Fercher et al.2 proposed the use of spectral domain interferometric techniques for the generation of depth-resolved reflectivity profiles (i.e., A scans) in scattering tissues. Two spectral domain techniques were presented. The first technique, which we call Fourier domain (FD) OCT, uses a broadband light source and collects the spectrally resolved interference signal in a detector-arm dispersive spectrometer. The second, which we call swept source (SS) OCT, time encodes spectral information by sweeping a narrow linewidth laser through a broad optical bandwidth. As in time domain OCT, swept source OCT uses a single photodiode detector. The detector responses for swept source and Fourier domain OCT are Eqs. 2, 3, respectively: The swept source OCT signal is a photocurrent integrated over the linewidth of the swept laser source, while the Fourier domain OCT signal is the quantity of photoelectrons collected over the duration of an A scan in a charge accumulation detector such as a charge-coupled device or photodiode array.Although the initial work by Fercher et al. described the fundamental physical similarities between Fourier domain and swept source OCT, the sensitivities of spectral domain OCT compared to time domain OCT remained an open issue. In 1998, Andretzky et al.3 derived an expression for the sensitivity of Fourier domain OCT that showed its theoretical superior sensitivity to time domain OCT. This expression was later independently rederived and experimentally verified in 1999 by Mitsui4 and in 2003 by Leitgeb, Hitzenberger, and Fercher,5 and de Boer.6 These works, however, overlooked the underlying similarities between swept source and Fourier domain OCT that Fercher et al. recognized. These similarities were exploited by Choma et al.7 to provide a unified theoretical and experimental sensitivity analysis of all spectral domain OCT techniques that demonstrates the general sensitivity advantage of spectral domain OCT over time domain OCT. This analysis is summarized by two key points. First, the shot noise-limited signal-to-noise ration (SNR) of an individual spectral domain pixel is given by where is the wavenumber measured , is the sample power at , is the sample reflectivity, is the A-scan time, is the detector responsivity, and is the electronic charge. It should be noted that each is comparable to the standard time domain SNR expression given by Swanson et al.8 The second key point is that, while signal adds coherently during Fourier transformation from the spectral to the time domain, noise adds incoherently. This leads to a sensitivity advantage of spectral domain OCT on the order of to (Fig. 1 ). The SNR of spectral domain OCT is thus:where is the total power incident on the sample.Fig. 1Sensitivity advantage of spectral domain OCT. Each pixel of the SD-OCT signal has an SNR comparable to that of an entire TD-OCT A scan. When is Fourier transformed to retrieve the depth-resolved A scan, the signal adds coherently, while the noise adds incoherently, yielding an SNR that is times greater than the -domain pixel SNR. Further, is proportional to the ratio of the scan depth and the source coherence length . In this context, coherence length refers to the width of the axial coherence function (i.e., axial point spread function). The gray-scale intensity of the lines drawn from the spectral to the time domain represents the relative phase of the Fourier components.  One of the impediments to the development of robust swept source OCT systems has been the availability of stable, rapidly tunable swept laser sources. Previously swept sources have included grating9 and prism10 tuned external cavity lasers and current tuning of a laser diode.11 Recently, we7 and others12 have demonstrated a rapidly tunable swept laser source that employs a fiber ring laser configuration with an intracavity wavelength tuning mechanism. This general cavity configuration was first demonstrated in the mid-1990s,13, 14, 15 and commercial devices with an erbium-doped fiber ring that use the fiber Fabry Perot tuning mechanism shown in this work have been commercially deployed.16 We describe the design and operation of a swept source OCT system based on a modified version of this commercially available swept laser source. We demonstrate a novel optoelectronic wavenumber linearization technique that eliminates the need for resampling spectral domain data in software. We show high-quality SS-OCT images of the cornea and anterior segment, and discuss aliasing as a source of image artifact in spectral domain OCT. 2.Swept Source OCT System DesignA schematic of the novel all-fiber swept laser source is shown in Fig. 2 . The fiber ring cavity has two important elements. First, the gain medium is a semiconductor optical amplifier (SOA) that achieves population inversion via current pumping. We used a standard polarization-insensitive SOA from InPhenix, Inc. (Livermore, California) (peak wavelength of , small signal gain of , a polarization dependent ratio of , and a saturation power of ). Second, addressable wavelength (mode) selection is achieved with a fiber Fabry-Perot tunable filter (FFP-TF), a completely in-fiber device with a insertion loss. The FFP-TF is an all-fiber device having a cavity formed by two dielectric mirrors deposited directly onto fiber ends. A thin air-gap within the cavity is used for wavelength tuning and control by a piezoelectric actuator with positioning resolution of atomic dimensions. The key to the stable, high-performance characteristics of the FFP-TF is the incorporation of an intrinsic beam shaping mechanism that provides intracavity waveguiding, elimination of extraneous cavity modes, and ease of mirror alignment required for high-finesse and low-loss operation. The high-performance parameters and features attained with the FFP-TFs in the spectral range include wide FSR , high finesse , low loss , high contrast , robust signal tracking and locking capability, smooth and continuous tuning, conformance to the theoretical Airy function, and compact and rugged design. For this experiment the filter parameters include a free spectral range of , a finesse of , a bandwidth of , and a loss of . The FFP-TF is actuated by a piezoelectric element that changes the passband of the FFP-TF by lengthening or shortening the FFP-TF. This intracavity FFP-TF has a free spectral range that exceeds the gain medium bandwidth. The stacked piezo actuator (PZT) operates in a low voltage range and requires only to tune over the entire free spectral range. Numerous FFP-TFs from Micron Optics, Inc. (Atlanta, Georgia) have been deployed in optical communications over a decade, and the PZT durability is expected to be robust under present operation. The finesse of the FFP-TF allows tens of cavity modes to simultaneously lase within the static linewidth of the laser output. Fig. 2Right: Schematic of swept laser source. Addressable cavity mode selection is performed by the fiber Fabry-Perot tunable filter (FFP-TF). A small portion of the laser output is fed to a fixed fiber Fabry Perot interferometer (FFPI), which is monitored by a photodiode (PD). The electrical comb output of this photodiode serves as the pixel clock for the analog-to-digital converter. The large arrows in the cavity represent isolators. The ring laser has a 40% output coupling ratio. SMF: single-mode fiber, SOA: semiconductor optical amplifier. Left: Schematic of FFP-TF. PZT: piezoelectric tuning element.  The piezoelectric element in the FFP-TF is driven with a triangle wave, which generates a forward and backward sweep. The swept laser source power as a function of wavelength and sweep direction is shown in Fig. 3 . During the forward sweep, an increasing voltage ramp is applied to the piezoelectric element, which sweeps the source output from shorter to longer wavelengths. During the backward sweep, a decreasing voltage ramp is applied to the piezoelectric element, which sweeps the source output from longer to shorter wavelengths (Fig. 3). This laser achieves a sweep range centered at , of output power, and full-width half-maximum bandwidth of . It should be noted that the source output is different on the forward and backward sweep. This is caused by a frequency downshift in the SOA, which is believed to be due to intraband four-wave mixing via carrier-density modulation in the SOA.17, 18, 19 Only the higher-intensity forward sweep was used for imaging. We have demonstrated that the sweep rate is scalable into the kilohertz regime.20 Fig. 3Output spectrum of swept laser source. The piezoelectric element in the FFP-TF is driven with a triangle wave, which generates a forward (F) and a backward (B) sweep. During the forward sweep, an increasing voltage ramp is applied to the piezoelectric element, which sweeps the source output from shorter to longer wavelengths. During the backward sweep, a decreasing voltage ramp is applied to the piezoelectric element, which sweeps the source output from longer to shorter wavelengths. The source intensity as a function of time is shown in the inset. This recording was evenly sampled in wavenumber using the pixel trigger mechanism described in Fig. 4 and in Sec. 2 of the text. By using the minimum and maximum source wavelengths measured using an optical spectrum analyzer, the intensity versus time recording was replotted as intensity versus wavelength.  Fig. 4Schematic of the SS-OCT imaging system. The source sweep function ( , optical wavenumber) is paramatized by time with the expression , where is the wavenumber at and is taken modulo the total sweep time. The interferometer employs dual-balanced detection, which allows for the hardware removal of noninterferometric and autocorrelation terms. An antialiasing filter sets the system noise equivalent bandwidth and mitigates the effect of high-frequency interferometric (i.e., structural) information aliased to lower frequencies. We employed a four-pole Bessel filter with a falloff of . The analog-to-digital converter (National Instruments, maximum sampling frequency ) has two trigger inputs. The first is a line trigger, provided by the function generator that drives the intracavity fiber Fabry-Perot tunable filter. The second is a pixel clock generated by a photodetector that monitored the output of a fixed fiber Fabry-Perot interferometer that is fed a small portion of the laser output. Every time the source sweeps through the free spectral range of the FFP-I, the photodetector output spikes, and a sample is taken by the A∕D. This allows for even sampling of the signal in space. Since the free spectral range of the FFP-I is , each linescan consists of 1298 samples. The axial point spread function (PSF) of the SS-OCT system had a full-width half-maximum of in air and in tissue.  To achieve maximal SNR and axial imaging resolution, the digitally sampled SS-OCT data must be evenly spaced in the domain before Fourier transformation into an A scan. We have implemented an optoelectronic method that eliminates the need for the computationally intense software resampling needed in Fourier domain OCT. A small portion of the laser output is fed into a fixed fiber Fabry Perot interferometer (FFPI) with a free spectral range . The output of this FFP is monitored with a photodiode. Every time the laser sweeps through , the photodiode output spikes.21 Since these spikes are evenly spaced in wavenumber, this signal was processed in analog electronics for use of the pixel clock for analog-to-digital conversion of the interferometric signal. Since is broader than the linewidth of the laser, determines the maximum scan depth The nominal noise equivalent bandwidth (NEB) of the SS-OCT system is thus7 where is the center wavelength, is the laser sweep bandwidth, is expressed in wavelength, and is the A-scan line rate. Due to nonlinearities in the wavenumber scan, the actual NEB will be greater than that given by Eq. 7. In other words, since the FFPI-based trigger forces even sampling in wavenumber, it necessarily forces uneven sampling in time when the source wavenumber sweep is nonlinear. Since the NEB is inversely proportional to the analog-to-digital sampling interval, nonlinear sampling in time increases the NEB due to the presence of sampling intervals shorter than those assumed in Eqs. 6, 7. This broadening degrades the system SNR, and is analogous to the broadening observed when a sinusoidal resonant scanner is used in a rapid scanning optical delay line in a time domain OCT system.22Our system schematic is shown in Fig. 4 . The interferometer employs dual-balanced detection,23 which allows for the hardware removal of noninterferometric and autocorrelation terms. Dual-balanced detection extinguishes tens of decibels of autocorrelation and source spectral shape terms. Unfortunately, the fiber optic couplers used by us and others are not achromatic. As a consequence, the coupler splitting ratio is a function of wavelength, which renders complete extinction of autocorrection and source spectral terms not possible by dual balancing alone. The measured system sensitivity was as measured with a reflector. The sensitivity is arrived at by adding the reflectivity of the sample reflector (in decibels) to the dynamic range (in decibels). The dynamic range in decibels was calculated as 20 times the base-10 logarithm of the ratio of the A-scan peak height to the standard deviation of the noise floor. The noise floor standard deviation was taken at the location of the A-scan peak by blocking the sample arm. The measured sensitivity compares well with the theoretical SNR of ( , , and ). With , the imaging scan depth was . The measured coherence length (i.e., axial resolution) was in air (tissue), which compared favorably with a predicted coherence length of in air. Importantly, the coherence length remained constant throughout the entire scan depth (Fig. 5 ). Further, the amplitude falloff at was owing to the antialiasing filter. Each -domain A scan contains 649 points. Fig. 5A-scans of a calibrated reflector taken at increments over a scan depth. The falloff in peak intensity from was . Further, there was no increase in peak width over the scan range. Each A scan contains . Peaks marked with are echoes from a neutral density filter in the reference arm. Each peak in an echo pair is separated by a distance corresponding to the thickness of the ND filter. The echoes wrap around owing to aliasing. Tilting the sample arm ND filter minimizes but does not completely eliminate the echo.  3.In Vivo Swept Source OCT ImagingOCT imaging of the cornea and anterior segment of the eye has important potential applications in glaucoma evaluation and refractive surgery (e.g., LASIK).24 Compared to ultrasound biomicroscopy, OCT is noncontact and achieves higher spatial resolutions.24 In terms of imaging the anterior chamber angle with gonioscopy,25 it has the advantage of being able to visualize structures behind the iris. OCT also has the potential to evaluate in detail the response of the angle structures to light an accommodation, which is an important part of the glaucoma workup. The window is particularly well suited for imaging these anatomical regions because, compared to the window, it has deeper penetration into scattering tissue and less penetration into the vitreous. To this end we performed in vivo imaging of the human cornea and anterior segment using slit-lamp biomicroscope adapted optics. Details of this setup are in Patil et al.24 The image in Fig. 6 contains 300 A scans. Major anatomic features were visualized, including the iris stroma, iris pigment epithelium, ciliary body, angle of anterior chamber, aqueous, corneal stroma, sclera, and scleral spur. The corneal epithelium was visualized in Fig. 7 . Fig. 6SS-OCT image of cornea angle region. Note the significant contrast between the iris stroma (IS) and the iris pigment epithelium (IPE), as well as the sharply defined ciliary body (CB). The image contains 300 A scans. A: angle of anterior chamber, AQ: aqueous, CS: corneal stroma, S: sclera, and SS: scleral spur. 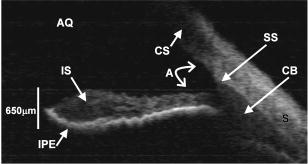 Fig. 7Effect of aliasing on imaging the cornea and anterior segment. Aliased features are noted by dashed arrows, and and denote anterior and posterior, respectively. The irides (I) and lens (L) are anatomically posterior to termination of the scan, but they are aliased anterior to this termination. Furthermore, aliasing creates mirror images of the irides and lens around the posterior border of the image, consistent with Eq. 8. AC, autocorrelation and spectral shape terms; CE, corneal epithelium; and CS, corneal stroma.  OCT imaging of the skin is an emerging technology for subsurface assessment of structure, collagen birefringence, and blood flow.26 Its resolution is superior to that of ultrasound biomicroscopy.27 Morphologic changes such as blistering and inflammatory changes such as psoriasis have been visualized using OCT.28, 29 As with imaging of the anterior segment and cornea, the window is the preferred wavelength range of operation due to deeper tissue penetration. For our study, a hand-held probe was used to perform imaging of the in-vivo human skin pad. Details of the hand-held probe design are in Radhakrishnan et al.30 The image in Fig. 8 contains 500 A scans. The dermis, dermal-epidermal junction, and stratum corneum were well visualized. 4.Aliasing Artifact in Spectral Domain OCTSources of artifact in spectral domain OCT is a topic of high interest.31, 32 There have been two widely discussed sources of static artifact and ambiguity in spectral domain OCT, complex conjugate ambiguity, and DC artifacts.31 The first, complex conjugate ambiguity, arises because reflectors at are superimposed over those at , owing to the fact that the spectral domain signal is real valued. Complex conjugate ambiguity also reduces the laser linewidth (or spectrometer resolution) limited scan depth by a factor of 2. The second source of artifact arises because autocorrelation and source spectral shape terms are centered around . A third source of ambiguity arises when spectral domain fringes from depths greater than are aliased down to depths less than (Fig. 7). The apparent or aliased depth of an object is given by: where yields modulo . This phenomenon has been discussed in Fourier transform spectral interferometry,33 and a similar effect occurs in magnetic resonance imaging.34 Aliasing can be mitigated by passing the photodetector output through the noise equivalent bandwidth-limiting antialiasing filter (Fig. 4).7 Aliasing is a difficult problem to eliminate, because analog filters have finite impulse response transfer functions and, as such, cannot act as perfect brickwall filters with a cutoff frequency corresponding to the system noise equivalent bandwidth dicated by . Doubling the scan depth through by resolving complex conjugate ambiguity reduces the likelihood of aliasing. Oversampling and subsequent processing with an infinite impulse response digital filter is another potential solution.5.ConclusionsWe present a swept source OCT system with an all-fiber, turnkey swept laser source. We demonstrate a novel optoelectronic wavenumber linearization technique that yielded a near-transform-limited point spread function performance over the entire scan range, which had not previously been convincingly demonstrated with either Fourier domain or swept source OCT. We obtained excellent in-vivo images of the human cornea and anterior segment, and are currently scaling this system into the kilohertz regime for real-time imaging. ReferencesD. Huang,
E. A. Swanson,
C. P. Lin,
J. S. Schuman,
W. G. Stinson,
W. Chang,
M. R. Hee,
T. Flotte,
K. Gregory,
C. A. Puliafito, and
J. G. Fujimoto,
“Optical coherence tomography,”
Science, 254
(5035), 1178
–1181
(1991). 0036-8075 Google Scholar
A. F. Fercher,
C. K. Hitzenberger,
G. Kamp, and
S. Y. Elzaiat,
“Measurement of intraocular distances by backscattering spectral interferometry,”
Opt. Commun., 117
(1–2), 43
–48
(1995). https://doi.org/10.1016/0030-4018(95)00119-S 0030-4018 Google Scholar
P. Andretzky,
M. W. Lindner,
J. Herrmann,
A. Schutz,
M. Konzog,
F. Kiesewetter, and
G. Hausler,
“Optical coherence tomography by spectral radar, dynamic range estimation and in vivo measurements of skin,”
Proc. SPIE, 3567 78
–87
(1998). 0277-786X Google Scholar
T. Mitsui,
“Dynamic range of optical reflectometry with spectral interferometry,”
Jpn. J. Appl. Phys., Part 1, 38
(10), 6133
–6137
(1999). https://doi.org/10.1143/JJAP.38.6133 0021-4922 Google Scholar
R. Leitgeb,
C. K. Hitzenberger, and
A. F. Fercher,
“Performance of fourier domain vs. time domain optical coherence tomography,”
Opt. Express, 11
(8), 889
–894
(2003). 1094-4087 Google Scholar
J. F. de Boer,
B. Cense,
B. Hyle Park,
M. C. Pierce,
G. J. Tearney, and
B. E. Bouma,
“Improved signal-to-noise ratio in spectral-domain compared with time-domain optical coherence tomography,”
Opt. Lett., 28
(21), 2067
(2003). 0146-9592 Google Scholar
M. A. Choma,
M. V. Sarunic,
C. Yang, and
J. A. Izatt,
“Sensitivity advantage of swept-source and Fourier-domain optical coherence tomography,”
Opt. Express, 11
(18), 2183
–2189
(2003). 1094-4087 Google Scholar
E. A. Swanson,
D. Huang,
M. R. Hee,
J. G. Fujimoto,
C. P. Lin, and
C. A. Puliafito,
“High-speed optical coherence domain reflectometry,”
Opt. Lett., 17
(2), 151
–153
(1992). 0146-9592 Google Scholar
S. R. Chinn,
E. A. Swanson, and
J. G. Fujimoto,
“Optical coherence tomography using a frequency-tunable optical source,”
Opt. Lett., 22
(5), 340
–342
(1997). 0146-9592 Google Scholar
B. Golubovic,
B. E. Bouma,
G. J. Tearney, and
J. G. Fujimoto,
“Optical frequency-domain reflectometry using rapid wavelength tuning of a Cr4+:forsterite laser,”
Opt. Lett., 22
(22), 1704
–1706
(1997). 0146-9592 Google Scholar
U. H. P. Haberland,
V. Blazek, and
H. J. Schmitt,
“Chirp optical coherence tomography of layered scattering media,”
J. Biomed. Opt., 3
(3), 259
–266
(1998). https://doi.org/10.1117/1.429889 1083-3668 Google Scholar
S. H. Yun,
G. J. Tearney,
J. F. de Boer,
N. Iftimia, and
B. E. Bouma,
“High-speed optical frequency-domain imaging,”
Opt. Express, 11
(22), 2953
–2963
(2003). 1094-4087 Google Scholar
H. Porte,
T. Frison,
P. Mollier, and
J. P. Doedgebuer,
“Electrooptic tuning of a fiber ring semiconductor laser,”
IEEE Photonics Technol. Lett., 7 700
–702
(1995). https://doi.org/10.1109/68.393178 1041-1135 Google Scholar
D. Y. Zhou,
P. R. Prucnal, and
I. Glesk,
“A widely tunable narrow linewidth semiconductor fiber ring laser,”
IEEE Photonics Technol. Lett., 10
(6), 781
–783
(1998). https://doi.org/10.1109/68.681482 1041-1135 Google Scholar
S. H. Yun,
D. J. Richardson, and
B. Y. Kim,
“Interrogation of fibergrating sensor arrays with a wavelength-swept fiberlaser,”
Opt. Lett., 23
(11), 843
–845
(1998). 0146-9592 Google Scholar
K. Hsu,
P. J. Santangelo, and
S. Y. Set,
“Swept-wavelength laser measurement systems enable real-time monitoring and in-process control during optical manufacturing,”
129
(2002). Google Scholar
S. H. Yun,
C. Boudoux,
M. C. Pierce,
J. F. de Boer,
G. J. Tearney, and
B. E. Bouma,
“Extended-cavity semiconductor wavelength-swept laser for biomedical imaging,”
IEEE Photonics Technol. Lett., 16
(1), 293
–295
(2004). https://doi.org/10.1109/LPT.2003.820096 1041-1135 Google Scholar
G. P. Agrawal,
“Population pulsations and nondegenerate 4-wave mixing in semiconductor-lasers and amplifiers,”
J. Opt. Soc. Am. B, 5
(1), 147
–159
(1988). 0740-3224 Google Scholar
K. Inoue,
T. Mukai, and
T. Saitoh,
“Nearly degenerate 4-wave-mixing in a traveling-wave semiconductor-laser amplifier,”
Appl. Phys. Lett., 51
(14), 1051
–1053
(1987). https://doi.org/10.1063/1.99004 0003-6951 Google Scholar
K. Hsu,
T. Haber,
J. Mock,
J. Volcy, and
T. W. Graver,
“High-speed swept-laser interrogation system for vibrational monitoring,”
1043
–1050
(2003). Google Scholar
M. Froggatt and
J. Moore,
“Distributed measurement of static strain in an optical fiber with multiple Bragg gratings at nominally equal wavelengths,”
Appl. Opt., 37
(10), 1741
–1746
(1998). 0003-6935 Google Scholar
A. M. Rollins,
M. D. Kulkarni,
S. Yazdanfar,
R. Ung-arunyawee, and
J. A. Izatt,
“In vivo video rate optical coherence tomography,”
Opt. Express, 3
(6), 219
–229
(1998). 1094-4087 Google Scholar
A. M. Rollins and
J. A. Izatt,
“Optimal interferometer designs for optical coherence tomography,”
Opt. Lett., 24
(21), 1484
–1486
(1999). 0146-9592 Google Scholar
A. M. Rollins,
M. V. Sivak,
S. Radhakrishnan,
J. H. Lass,
D. Huang,
K. D. Cooper, and
J. A. Izatt,
“Emerging clinical applications of optical coherence tomography,”
Opt. Photonics News, 13
(4), 36
–41
(2002). 1047-6938 Google Scholar
A. Karandish,
C. Wirbelauer,
H. Haberle, and
D. T. Pham,
“Reproducibility of goniometry with slitlamp-adapted optical coherence tomography,”
Ophthalmologe, 101
(6), 608
–613
(2004). 0941-293X Google Scholar
M. C. Pierce,
J. Strasswimmer,
B. H. Park,
B. Cense, and
J. F. d. Boer,
“Advances in optical coherence tomography imaging for dermatology,”
J. Invest. Dermatol., 123
(3), 458
–463
(2004). https://doi.org/10.1111/j.0022-202X.2004.23404.x 0022-202X Google Scholar
M. Vogt,
A. Knuttel,
K. Hoffmann,
P. Altmeyer, and
H. Ermert,
“Comparison of high frequency ultrasound and optical coherence tomography as modalities for high resolution and non invasive skin imaging,”
Biomed. Tech., 48
(5), 116
–121
(2003). 0013-5585 Google Scholar
J. Welzel,
C. Reinhardt,
E. Lankenau,
C. Winter, and
H. H. Wolff,
“Changes in function and morphology of normal human skin: evaluation using optical coherence tomography,”
Br. J. Dermatol., 150
(2), 220
–225
(2004). 0007-0963 Google Scholar
J. Welzel,
M. Bruhns, and
H. H. Wolff,
“Optical coherence tomography in contact dermatitis and psoriasis,”
Arch. Dermatol. Res., 295
(2), 50
–55
(2003). 0340-3696 Google Scholar
S. Radhakrishnan,
A. M. Rollins,
J. E. Roth,
S. Yazdanfar,
V. Westphal,
D. S. Bardenstein, and
J. A. Izatt,
“Real-time optical coherence tomography of the anterior segment at ,”
Arch. Ophthalmol. (Chicago), 119
(8), 1179
–1185
(2001). 0003-9950 Google Scholar
M. Wojtkowski,
A. Kowalczyk,
R. Leitgeb, and
A. F. Fercher,
“Full range complex spectral optical coherence tomography technique in eye imaging,”
Opt. Lett., 27
(16), 1415
–1417
(2002). 0146-9592 Google Scholar
S. H. Yun,
G. J. Tearney,
J. F. deBoer, and
B. E. Bouma,
“Motion artifacts in optical coherence tomography with frequency-domain ranging,”
Opt. Express, 12
(13), 2977
–2998
(2004). https://doi.org/10.1364/OPEX.12.002977 1094-4087 Google Scholar
C. Dorrer,
N. Belabas,
J. P. Likforman, and
M. Joffre,
“Spectral resolution and sampling issues in Fourier-transform spectral interferometry,”
J. Opt. Soc. Am. B, 17
(10), 1795
–1802
(2000). 0740-3224 Google Scholar
A. L. Horowitz, MRI Physics for Radiologists: A Visual Approach, 192 3rd ed.Springer-Verlag, New York (1995). Google Scholar
|


