|
|
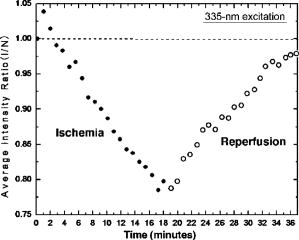
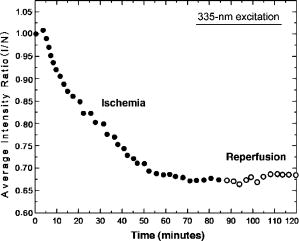
1.IntroductionTransplant surgeons often face the difficult question of whether organs from a marginal cadaveric donor are suitable for transplantation. It is currently difficult to quantify how much warm ischemic organ damage has occurred, especially if the donor has experienced significant hemodynamic instability. Organ procurement in brain-dead and nonheartbeating donors also causes a variable amount of additional warm ischemia. Transplanting organs that have sustained significant preimplantation warm ischemic damage may leave the recipient with unacceptably poor allograft function and adversely affect graft and patient survival. On the other hand, as transplant waiting lists continue to grow, it becomes increasingly important to maximize utilization of viable organs from marginal donors. A number of physiological tests have been devised to answer the question of how much warm ischemic organ damage has occurred,1, 2, 3 but these tests are hindered by clinical practicality as well as hypothermic preservation. Posttransplant monitoring is currently the only reliable way of assessing ischemic organ damage; unfortunately, at that stage the organ is already in the recipient and may have to be removed if found to be nonviable. Three fundamental questions regarding ischemia in a transplanted organ are apparent. First, how much ischemic damage has an organ sustained? Second, how does the organ respond to intervention aimed at halting or reversing ischemic damage? Third, how will the organ function after it is transplanted? The ideal method for analyzing organ ischemia and answering these questions should be employable at any stage of transplantation—while the organ is still in the donor, after it has been removed (during hypothermic preservation), while it is being implanted, and after reperfusion. The method should also be capable of yielding real-time, nearly instantaneous results so that clinical decisions can be made in a timely fashion. We have previously demonstrated the efficacy of optical spectroscopy in quantifying prepreservation warm ischemia ex vivo in hypothermically preserved rat kidneys.4 In this study, our aim was to explore optical spectroscopic methods for in vivo real-time assessment of warm ischemia in rat kidneys. Rather than analyzing a small portion of the kidney surface, we utilized spectroscopic imaging methods to capture changes occurring over the entire surface of the kidney. Our specific goals were as follows: 1. to demonstrate that optical spectroscopy, utilizing laser autofluorescence imaging, is a feasible means of in vivo real-time monitoring of both ischemia and reperfusion in rat kidneys; 2. to investigate whether these methods might eventually be able to predict an inability to recover from extended ischemic injury; 3. to explore the effects of different laser excitation wavelengths, as well as hemoglobin absorption, on spectroscopic measurements; and 4. to determine whether changes in tissue fluorophore identity versus quantity are responsible for the changes observed during ischemia∕reperfusion. 2.Methods2.1.Renal IschemiaAll animal procedures were approved by the University of California, Davis Animal Use and Care Committee. Adult male Wistar rats weighing were anesthetized using sodium pentobarbital injected intraperitoneally. Laparotomy was performed through a midline abdominal incision. Both kidneys and their respective vascular pedicles were then dissected free of surrounding fascia and fatty tissue, and mobilized anteriorly into the laparotomy wound so they could be imaged by an external camera. Care was taken to avoid twisting the vascular pedicle and causing premature ischemia in either kidney. Unilateral warm renal ischemia was induced by left renovascular pedicle clamping and then studied by analyzing tissue autofluorescence under excitation with laser light of different wavelengths. Reperfusion was studied in vivo after unclamping of the renovascular pedicle. In all groups, the right kidneys were left uninjured and used as internal controls. At the conclusion of the imaging studies, all rats were sacrificed. Ischemia times in the experimental groups were chosen based on the previous demonstration by Calman and Bell that rat kidneys clamped for less than recovered, while those clamped for greater than did not.5 Renal ischemia time in group 1 ( rats) was , followed by unclamping and a reperfusion phase of . Images were acquired under a laser excitation wavelength of . Renal ischemia in group 2 ( rats) was , followed by unclamping and a reperfusion phase. Images were acquired under a laser excitation wavelength of . Renal ischemia time in group 3 ( rats) was , followed by unclamping and of reperfusion. Images were acquired under both 335- and excitation during the warm ischemia and reperfusion phase. In group 4( rats), we monitored the autofluorescence intensity under excitation during of renal ischemia, followed by a reperfusion phase. In group 5 ( rats), we perform cross-polarized light scattering imaging measurements at to monitor the change of hemoglobin absorption during of ischemia time, followed by of reperfusion. In group 6 ( rats), we studied kidney autofluorescence spectra using 335- and excitation at the time of clamping and at of warm ischemia. 2.2.Optical Spectroscopy MethodsIn each experimental rat, both kidneys were exposed and a black, nonfluorescing cloth was used to cover the remainder of the rat’s body and viscera to avoid autofluorescence from other tissues. The anterior surfaces of both kidneys were simultaneously excited. The kidneys in groups 1 and 2 were imaged using their native autofluorescence under exposure to laser illumination. A set of lenses was used to enlarge the laser beam and its central portion was used to provide nearly uniform illumination of the kidneys. The laser illumination wavelength was obtained by second harmonic conversion of the output of an optical parametric oscillator (Opotek, Incorporated, Carlsbad, California) tuned at . Excitation with is known to penetrate tissue to a depth on the order of a few hundred , depending on tissue type.6 Resulting autofluorescent images from each pair of kidneys were captured by a liquid nitrogen cooled charge-coupled device (CCD) array detector ( , Roper Scientific, Trenton, New Jersey). A camera lens was used to project the images to the CCD detector through a long wavelength pass filter placed in front of the camera. This combination of filter and detector captures images using the autofluorescence from the kidneys in the spectral region. This range was selected to optimize signal-to-noise ratio and enable short image acquisition times. Both excitation and emission spectral bands for image acquisition were chosen based on our previous experience using excitation with multiple narrow band and long pass filters.4 Starting from the time of left renal vascular pedicle clamping, images were taken every for the duration of the ischemia and reperfusion phases. The intensity of the captured images was normalized to the intensity map of the photoexcitation beam, which was recorded by acquiring the fluorescence image of the beam imprint on a fluorescing paper. Normalization was performed by pixel-by-pixel division of autofluorescence images by the images of the beam profile on the fluorescing paper. Images were analyzed using commercially available computer software (Roper Scientific) to calculate the ratio of autofluorescence intensity of the ischemic to control kidneys. The software calculates the average pixel intensity over a rectangular area of the image. We used this feature to obtain the average intensity of the kidneys by covering as many pixels as possible of the digitized image of each kidney. In groups 3 and 4, the same imaging system described above for groups 1 and 2 was used. Group 3 kidneys were imaged with 260- and excitation, at 0, 18, and of ischemia. The laser illumination wavelength was obtained from the same optical parametric oscillator (OPO) laser system. The goal of this set of experiments was to compare the optical spectroscopic properties of ischemic kidneys when imaged under different excitation wavelengths. We used the same spectral band imaging filter ( -long wavelength pass) for both excitation wavelengths to facilitate their near-simultaneous use during the execution of the experiment. Our previous experience with probing different excitation wavelengths demonstrated that excitation of hypothermically preserved rat kidneys ex vivo with a laser tuned at resulted in no changes (within experimental error) in intensity ratio between a normal kidney and a kidney that had undergone of warm ischemia prior to hypothermic preservation.7 In the current study, we examined whether ischemic kidneys, during in vivo measurements under excitation, would display similar spectroscopic properties. To examine the same effect at shorter ischemia times, group 4 experiments utilized excitation to monitor the autofluorescence from normal and injured kidneys during of renal ischemia time, followed by of reperfusion. To monitor any changes in the absorption by hemoglobin during of ischemia and of reperfusion, normal and injured rat kidneys in group 5 were studied using the same experimental setup, with the exception that images were obtained with cross-polarized light scattering at . The illumination was delivered to the kidneys using a fiber bundle that was coupled to a white light source. Both a linear polarized and a ( bandwidth) narrow band interference filter were positioned at the output of the illumination fiber to deliver polarized and nearly monochromatic illumination. A second polarizer with its polarization orientation orthogonal to that of the illumination was positioned in front of the imaging lens to capture cross-polarized images of the kidneys.4 Images were captured every , starting from the time of left renal vascular pedicle clamping, for the duration of the ischemia and reperfusion phases. Images were analyzed using the same methods described earlier. During ischemic injury, the absorption spectrum of hemoglobin changes due to transition from oxy- to deoxyhemoglobin. A reverse change is expected during reperfusion when fresh, oxygenated blood recirculates through the injured kidney. Cross-polarized imaging was used to: 1. eliminate the specular reflection component (which remains mostly polarized and bears no information from below the surface of the imaged organ); and 2. obtain images of kidneys generated by photons that have penetrated the tissue, thus offering optimal information regarding changes in the absorption within the substance of the kidney.8 We chose for imaging because there is a large difference in the absorption coefficient between oxy- and deoxyhemoglobin in this part of the spectrum, allowing for visualization of the effect in an imaging mode. Increased deoxyhemoglobin concentration leads to more absorption of the light and, if occurring during these experiments, would be expected to result in decreased intensity of the kidney images. The autofluorescence spectra of kidneys from group 6 were recorded at and after of warm ischemia using a back-illuminated CCD detector ( , Roper Scientific, Trenton, New Jersey) after the emission was spectrally analyzed using a single-gating spectrometer (TRIAX 320, Jobin Yvon Incorporated, Edison, New Jersey). The tunable output of the OPO laser was used for excitation with the laser wavelength alternately tuned at 335 or to capture the spectra for various ischemia times at both these excitations. The autofluorescence was collected and focused into the slit of the spectrometer using reflective optical elements. To monitor spectral change independently of autofluorescence intensity, spectral profiles were normalized by dividing each by its peak intensity. 3.Results3.1.Group 1: Imaging During of Ischemia and of Reperfusion ( Excitation)Figure 1 shows a representative example of our experimental observations in group 1, depicting the injured-to-normal autofluorescence image intensity ratio over of warm ischemia, followed by an reperfusion phase. In this figure, the intensity ratio of one out of every three images is plotted over ischemia time. The intensity ratios rose slightly from 1.0 to 1.04 during approximately the first minute of ischemia, and then declined steadily to 0.78 at the time of unclamping. Intensity ratios for the other three injured kidneys at the time of unclamping were 0.76, 0.78, and 0.78. During the reperfusion phase, the intensity ratios rose with a slightly lesser slope than that observed during their decline with ischemia, finally reaching 0.98 after (Fig. 1). Intensity ratios for the other three injured kidneys at the end of the reperfusion phase were 0.97, 0.93, and 0.98. 3.2.Group 2: Imaging During of Ischemia and of Reperfusion ( Excitation)Figure 2 illustrates a representative example of the injured-to-normal autofluorescence image intensity ratio over of warm ischemia, followed by a reperfusion phase. In this figure, the intensity ratio of one out of every nine images is plotted. Intensity ratios rose during the first minute of ischemia, and then declined steadily. Between 50 and of ischemia time, the intensity ratios leveled off at 0.68, with no further decline observed for the remaining of ischemia. Intensity ratios for the other three injured kidneys at the time of unclamping were 0.62, 0.64, and 0.65. During the reperfusion phase, the intensity ratios did not change notably for any of the kidneys in group 2, remaining between 0.62 and 0.70. 3.3.Group 3: Imaging During of Ischemia and of Reperfusion Using 335- and ExcitationFigure 3 shows representative autofluorescence images of kidneys in group 3 that were subjected to ischemic injury for 18 [Figs. 3(a) and 3(b)] and (Figs. 3(c) and 3(d)), with their respective controls. Each pair of kidneys was imaged using both 335- excitation [Figs. 3(a) and 3(c)] and excitation [Figs. 3(b) and 3(d)] through a long pass filter. Under excitation, we observed notable differences in autofluorescence intensity between the injured and control kidneys at of ischemia, and these differences were more pronounced at of ischemia. However, under excitation, we observed no notable differences at 18 and of ischemia. Furthermore, no notable changes were observed during the reperfusion phase following of warm ischemia with 335- or excitation (data not shown). Fig. 3Autofluorescence in vivo images from the same pair of injured and control kidneys at (a and b) and (c and d) of warm ischemic injury. The top images (a and c) were obtained by using laser excitation. The bottom images (b and d) were obtained using laser excitation. All images were obtained using a long-pass filter.  3.4.Group 4: Imaging of the Kidneys During of Ischemia and of Reperfusion Under ExcitationThe observation of almost no change in the autofluorescence intensity of kidneys undergoing ischemic injury and reperfusion under excitation was further studied in the group 4 experiments. Autofluorescence images of the kidneys were recorded in real time under excitation for of injury followed by of reperfusion. Figure 4 illustrates an example of the injured-to-normal autofluorescence image intensity ratio obtained during this process. Although there was a small decline during the injury phase followed by a recovery of the intensity during the reperfusion phase, the value of the ratio did not decline below 0.95. 3.5.Group 5: Imaging with Cross-Polarized Light Scattering at During Ischemia and ReperfusionFigure 5 demonstrates an example of our experimental results using cross-polarized light scattering with imaging during of ischemia and of reperfusion. The ratio of the intensity of the injured over that of the normal kidney declined to within the first of injury. The decline continued during the following of injury at a much slower pace to reach a minimum value of 0.67. Following reperfusion, the intensity ratio increased very rapidly and its value exceeded 1.0 to reach a maximum value of 1.1. This behavior was in sharp contrast to the measured change of the autofluorescence intensity ratio under excitation (see Fig. 1). A similar behavior was observed in the intensity ratios for the kidneys of the other three rats of group 5—a fast decline of the ratio during the first of injury followed by a slower decline during the remaining of injury. The minimum values of the ratios for these three cases were 0.74, 0.76, and 0.83. Following unclamping, as fresh blood circulated through the kidneys, the recovery of the intensity ratios toward their initial values (1.0) was rapid and almost identical to the case shown in Fig. 5. In one case (the kidney that had minimum value of 0.74), the reperfusion phase led to an overshoot above 1 to a maximum value of 1.3. In the remaining two cases, the ratio reached a maximum value of 1.03 and 1.05. 3.6.Group 6: Emission Spectral Profiles at 335- and ExcitationFigure 4 shows emission spectra, normalized to peak autofluorescence intensity, of injured kidneys in group 6 excited with 335- and laser light. The spectra represent an average from all animals using spectra from five different sites in each kidney. At of ischemia, kidneys excited with demonstrated a peak in autofluorescence at around , whereas those excited with had peak autofluorescence at around . Although image intensity changed with increasing ischemia time for kidneys excited with (see results of groups 1, 2, and 3), the spectral profiles did not change with increasing ischemia time for either excitation wavelength. 4.DiscussionGrowing waiting lists for solid organ transplantation necessitate the development of methods to expand the donor pool. All too frequently, organs from donors having experienced significant hemodynamic instability or prolonged cardiac arrest are discarded because of concerns over irreversible ischemic damage. To date, no reliable and practical means of assessing and quantifying ischemic damage in potentially transplantable organs exists. We previously investigated the ability of laser autofluorescence and light scattering spectroscopy imaging techniques to assess the degree of warm ischemia ex vivo in hypothermically preserved rat kidneys.4 In this series of experiments, we explored optical spectroscopic imaging as a means of quantifying in vivo in real time the degree of warm ischemic injury sustained by rat kidneys. Additionally, we explored the ability of this technique to detect recovery from ischemia following reperfusion. Finally, we tested the wavelength for excitation of the surface of the kidneys to probe for an “inert” wavelength, which might serve as a means of normalizing measurements of ischemic injury, thus eliminating the need for a control kidney. The advantage of using spectral imaging, rather than a single point spectroscopic measurement, as has previously been done,9, 10 is that the intensity from the entire kidney can be analyzed as a single measurement. Thus, meaningful results can be obtained despite clinically frequently observed macroscopic heterogeneity in tissue structure, and differences in the degree of ischemia from point to point on the surface of the kidney. In contrast, spectral point measurements can analyze only a very small area of the kidney at one time. Because of the heterogeneity of ischemia across the kidney, data taken from one small point may not represent the whole surface; as a result, multiple measurements must be taken and averaged. We found that laser autofluorescence imaging of kidneys in live rats was technically feasible, and that such imaging could be accomplished at short enough intervals (i.e., seconds) so that the acquired data could be processed and made available for interpretation in real time. The autofluorescence intensity of the injured kidneys decreased with increasing warm ischemia time. However, isolated, absolute measurements could not be relied on to give accurate, reproducible information, mainly due to variations in the observed absolute autofluorescence intensity between different animals. Therefore, we used each animal’s contralateral, uninjured control kidney to normalize measurements made of the ischemic kidney. The optical spectroscopic measurement of ischemia (and reperfusion) was thus quantified by the injured-to-normal autofluorescence intensity ratio. Clamping the renal vascular pedicle and inducing warm ischemia resulted in an initial slight rise in the injured-to-normal intensity ratio. After about of ischemia, the intensity ratio began a steady decline. The slope of this decline was very consistent between the experimental animals. In our experiments, all injured kidneys that were unclamped after and reperfused, experienced a steady increase of the intensity ratio toward the baseline ratio. Kidneys that continued to experience warm ischemia out to reached an intensity nadir at about , after which almost no change was observed. On unclamping and reperfusion, the intensity ratio of these kidneys did not change either. Previous experiments suggest that rat kidneys subjected to less than of ischemia can usually recover, while those subjected to more than do not. Variable recovery can be expected between 50 and .5 Our results suggest, therefore, that the rebound of intensity ratios observed in the ischemic kidneys after reperfusion may be indicative of physiological recovery, while the lack of such a rebound in the kidneys with of ischemia may reflect the fact that these kidneys did not recover and may have undergone irreversible, significant injury. To confirm our spectroscopic method’s ability to predict physiological recovery, however, it would be necessary to follow the injured kidney’s physiological performance for some time after ischemia. Moreover, it would be important to test our method’s predictive power in kidneys injured between 50 and , where recovery may be variable. Emission spectra at excitation demonstrated a dominant peak at . While increasing ischemia time correlated with changes in autofluorescence intensity, the spectral profile did not change notably. These observations suggest that the quantity of tissue fluorophore excited under these parameters changed with ischemia, but that the identity of the fluorophores involved did not change. The intrinsic mitochondrial fluorophore NADH exhibits a peak in its emission spectrum at when excited at ,11, 12 and is therefore likely the molecule responsible for the changing spectroscopic properties associated with ischemia in our study. During cellular respiration, NAD is reduced to NADH to serve as an electron transporter in the oxygen-dependent process that regenerates the cellular energy unit ATP. Without flow of oxygenated blood, NADH accumulates in tissues and causes an increase in autofluorescence when excited with the appropriate wavelength. We observed an initial increase in autofluorescence intensity over approximately the first minute after the onset of ischemia, possibly corresponding to an increase in NADH levels. This short-term, self-limited increase in NADH has also been observed by others9, 13, 14 and may be due to the finite amount of NAD available for conversion to NADH. However, after this initial relatively small rise, we observed a steady decrease in intensity with increasing ischemia time, coupled with a rise in intensity after reperfusion. These findings suggest that with increasing ischemia, one or more nonfluorescent byproducts of cellular ischemia (e.g., pyruvate, lactate, potassium) may have accumulated steadily and may have interacted with NADH, resulting in a decrease of its fluorescence intensity. The light scattering imaging results under illumination suggest strongly that the changes in the autofluorescence intensity do not arise from, or correlate with, changes in the absorption of the residual blood within the kidney. The pattern of the change in hemoglobin absorption, as illustrated in Fig. 5, is clearly different from the pattern observed with the autofluorescence intensity under excitation (Fig. 1). Within the first five minutes after clamping the vascular pedicles, the rapid change in hemoglobin absorption contrasts with the initial increase, followed by a small decrease, in autofluorescence. Additionally, the hemoglobin absorption returns to and even exceeds its original value within of unclamping, while the autofluorescence increases at a much slower pace during this reperfusion phase. Furthermore, the emission spectra (Fig. 6 ) did not show any significant changes with increasing ischemia time that would be expected if changes were due to enhanced absorption by blood. Fig. 6Autofluorescence spectral profiles from injured and normal kidneys at 0 and of ischemia, normalized to peak intensity. When excited with , the dominant spectral peak occurred at and the spectral profile did not change with increasing ischemia. When excited at , the dominant peak occurred at and the spectral profile changed only minimally during ischemia.  In the setting of clinical transplantation, an uninjured control kidney for normalizing autofluorescence intensity measurements is not available. Figures 3 and 4 demonstrate that virtually no change in autofluorescence intensity is observed with ischemic injury under excitation. The dominant emission peak at with this excitation wavelength suggests tryptophan as the active fluorophore.15 Unlike NADH, tryptophan is not directly involved in aerobic or anaerobic cellular respiration; the spectroscopic properties of tryptophan would therefore be expected to remain “inert” during ischemia. Our results suggest that autofluorescence intensity at , which changes with ischemia, can therefore be normalized to autofluorescence intensity measured at excitation in the same tissue, eliminating the need for a control kidney. This step is crucial in the evolution toward clinical practicality and will be further explored in future experiments. 5.ConclusionOptical spectroscopy utilizing laser autofluorescence is a useful means of monitoring renal ischemia in real time. Spectroscopic measurements during the reperfusion phase following reperfusion appear to correlate with the degree of warm ischemic damage. Therefore, this novel optical spectroscopic technique may be capable of predicting the ability of renal tissue to recover from an ischemic insult. Spectral analysis of injured kidneys suggests that NADH may be the fluorophore responsible for the spectroscopic changes with ischemia. Finally, the “inert” excitation wavelength of may eliminate the need for an uninjured control kidney as a means of normalizing image intensity. AcknowledgmentsThis work has been supported in part by funding from the Center for Biophotonics and the Lawrence Livermore National Laboratory through grant number (UCDRD Proposal LS03-009). The Center for Biophotonics, an NSF Science and Technology Center, is managed by the University of California, Davis, under Cooperative Agreement number PHY 0120999. This work was also supported in part by a research grant from the Transplant Hope Endowment, University of California, Davis, Medical Center, Sacramento. This work was performed in part at Lawrence Livermore National Laboratory under the auspices of the U.S. Department of Energy under contract W-7405-Eng-48. ReferencesS. Inman,
R. Osgood,
W. Plott,
B. Richardson, and
R. Lewis,
“Identification of kidneys subjected to pre-retrieval warm ischemic injury during hypothermic perfusion preservation,”
Transplant. Proc., 30
(5), 2309
–2310
(1998). 0041-1345 Google Scholar
G. Kootstra,
J. K. Kievit, and
E. Heineman,
“The non heart-beating donor,”
Br. Med. Bull., 53
(4), 844
–853
(1997). 0007-1420 Google Scholar
J. K. Kievit,
A. P. Nederstigt,
A. P. Oomen,
M. Janssen,
L. Schoot, and
G. Kootstra,
“Release of alpha-glutathione S-transferase (alpha GST) and pi-glutathione S-transferase (pi GST) from ischemic damaged kidneys into the machine perfusate—relevance to viability assessment,”
Transplant. Proc., 29
(8), 3591
–3593
(1997). 0041-1345 Google Scholar
J. T. Fitzgerald,
S. G. Demos,
A. Michalopoulou,
J. Pierce, and
C. Troppmann,
“Assessment of renal ischemia by optical spectroscopy,”
J. Surg. Res., 122
(1), 21
–28
(2004). 0022-4804 Google Scholar
K. C. Calman and
P. R. Bell,
“The prediction of organ viability,”
Br. J. Surg., 60
(4), 322
(1973). 0007-1323 Google Scholar
V. Tuchin, Tissue Optics: Light Scattering Methods and Instruments for Medical Diagnosis, SPIE Press, Bellingham, WA (2000). Google Scholar
A. Michalopoulou,
J. T. Fitzgerald,
S. G. Demos, and
C. Troppmann,
“Spectroscopic imaging and detection of ischemic injury in rat kidneys using changes in intrinsic optical properties of tissue,”
Appl. Opt., 44
(11), 2024
–2032
(2004). 0003-6935 Google Scholar
S. G. Demos,
A. J. Papadopoulos,
H. Savage,
A. Heerdt,
S. Schantz, and
R. Alfano,
“Polarization filter for biomedical tissue optical imaging,”
Photochem. Photobiol., 66
(6), 821
–825
(1997). 0031-8655 Google Scholar
A. Mayevsky,
R. Nakache,
M. Luger-Hamer,
D. Amran, and
J. Sonn,
“Assessment of transplanted kidney vitality by a multiparametric monitoring system,”
Transplant. Proc., 33
(6), 2933
–2934
(2001). 0041-1345 Google Scholar
A. Mayevsky and
B. Chance,
“Intracellular oxidation-reduction state measured in situ by a multichannel fiber-optic fluorometer,”
Science, 217
(6), 537
–540
(1982). 0036-8075 Google Scholar
S. Ji,
B. Chance,
K. Nishiki,
T. Smith, and
T. Rich,
“Micro-light guides: a new method for measuring tissue fluorescence and reflectance,”
Am. J. Physiol., 236
(3), C144
–156
(1979). 0002-9513 Google Scholar
R. G. Thurman and
J. J. Lemasters,
“New micro-optical methods to study metabolism in periportal and pericentral regions of the liver lobule,”
Drug Metab. Rev., 19
(3–4), 263
–281
(1988). 0360-2532 Google Scholar
C. H. Barlow,
A. H. Harken, and
B. Chance,
“Evaluation of cardiac ischemia by NADH fluroescence photography,”
Ann. Surg., 186
(6), 737
–740
(1977). 0003-4932 Google Scholar
B. Chance and
G. R. Williams,
“Respiratory enzymes in oxidative phosphorylation. 1. Kinetics of oxygen utilization,”
J. Biol. Chem., 217
(1), 383
–393
(1955). 0021-9258 Google Scholar
G. A. Wagnieres,
W. M. Star, and
B. C. Wilson,
“In vivo fluorescence spectroscopy and imaging for oncological applications,”
Photochem. Photobiol., 68
(5), 603
–632
(1998). https://doi.org/10.1562/0031-8655(1998)068<0603:VFSAIF>2.3.CO;2 0031-8655 Google Scholar
|