
|
|
1.IntroductionMore than 85% of all cancers originate in the epithelia lining the internal surfaces of the human body. The majority of such lesions are readily treatable if diagnosed at an early state.1 Apart from conventional methods of cancer diagnosis,2, 3, 4 there is a need to develop new approaches that are simple, objective, and noninvasive. The use of optical techniques for diagnostic purposes relies on the capability to measure the optical properties of healthy and pathological tissues and in appreciating their relative differences. In fact, a degree of contrast must exist between absorption and scattering coefficients for detection of tissue alteration using optical detecting and optical imaging.5 In recent years, an increasing group of researchers has been interested in nonionizing, near-infrared (NIR) approaches for detecting and imaging diseased tissues. The proposed techniques range from continuous wave6, 7 to frequency-domain8, 9 or time-depended measurements of scattered light.10, 11 These techniques are based on the determination of optical properties of scattering media. The optical properties are represented by the absorption coefficient , the scattering coefficient , and the anisotropy factor . Since optical detecting and optical imaging are based on selective differences existing in optical properties of healthy and pathological tissues, it is particularly important for diagnostic purposes. For example, laser-induced autofluorescence (LIAF) spectroscopy has been found to be a promising tool for early cancer diagnosis in colons and other organs.12, 13 Consequently, tissue optical properties of healthy and pathological human colon tissues are important for medical applications in diagnosis and therapy.14 The purpose of the present study is to compare differences in the absorption and scattering properties between normal and adenomatous human colon mucosa/submucosa, and between normal and adenomatous muscle layer/chorion in vitro at 630, 680, 720, 780, 810, 850, and . The results were analyzed and compared from the experimental data we obtained. 2.Materials and Methods2.1.Sample PreparationIn vitro optical properties were investigated for four kinds of tissues: normal and adenomatous human colon mucosa/submucosa, and normal and adenomatous human colon muscle layer/chorion, of which there are two tissue types (namely, human colon mucosa/submucosa and muscle layer/chorion) for four kinds of tissues. Tissue samples were taken from six human colons (six adenomatous, six normal), immediately after excision of the tissues. Each removed colon sample was immediately rinsed briefly in saline to remove surface excess blood and peeled off surface fats, placed in a bottle with saline as soon as possible, stored in a refrigerator at , and then sectioned by microtome before measurement. All tissue samples were respectively clamped between two glass slides 0.16 and thick, and then were placed between the two integrating spheres before tissue samples were measured. From the normal human colons, a total of 12 tissue samples, with a mean thickness of , were used (six from mucosa/submucosa and six from muscle layer/chorion). From the adenomatous human colons, a total of 12 tissue samples, with a mean thickness of , were used (six from mucosa/submucosa and six from muscle layer/chorion). Tissue samples were prepared and measurements were taken within after removal. 2.2.Methods2.2.1.Measurement of tissue optical propertiesAn established method for measuring the optical parameters of turbid materials is the integrating-sphere technique. This technique is widely used for the determination of the optical properties of biological tissues in vitro.15, 16 The experimental setup is schematically shown in Fig. 1 . The colon samples were placed between two identical integrating spheres (Anhui Institute of Optics and Fine Mechanics, Academia Sinica, China, model F4) in diameter with a circular sample port in diameter, and illuminated with collimated light from a beam diameter, 630-, 680-, 720-, 780-, 810-, 850-, Ti:S ring laser (Coherent, USA, model 899-05) operating at . The outputs of all the lasers were collimated and attenuated (to a power at most ) by a pinhole and light attenuators, respectively. The light fluences within each sphere (the diffuse reflectance in the first sphere and the diffuse transmission in the second sphere) and the collimated transmission (at a distance of beyond the second sphere) were measured using standard light measuring techniques.17 The input light beams divergence was approximately , and the light beams were chopped mechanically at using a light chopper (SRS, USA, model SR540). The collimated transmittance , the diffuse reflectance , and the diffuse transmittance were measured by using photodiode detectors (APP, Hamamatsu, Japan, model C5460) at 630, 680, 720, 780, 810, 850, and . The signals were amplified using a lock-in amplifier (SRS, USA, model SR830) and processed by a personal computer. All measurements within the spheres were made relative to the signal when a 99% reflecting plate (Anhui Institute of Optics and Fine Mechanics, Academia Sinica, China, model F4) was placed at the sample aperture, and the collimated transmission measurement was made relative to a measurement with no sample. For a more detailed description of the measurement method of a double integrating-sphere setup, see Pickering, 18, 19, 20 and van Hillegersberg 21 The experiments involved a tissue sample held between two glass slides and submerged in saline. Therefore, the specular reflectance and refraction at the tissue/glass/saline boundary must be corrected. A complete description has been given by Jacques, Alter, and Prahl.22 2.2.2.Calculation of tissue optical parametersInverse Monte Carlo simulation23, 24, 25 was applied to calculate the optical parameters of colon tissue samples from the measured data. The basic concept and implementation of the Monte Carlo technique have been described earlier.26, 27, 28 The Monte Carlo technique allows us to take into account a realistic 3-D geometry of the experimental configuration, including the side losses of light at the edges of the sample. For the present study, the Monte Carlo method has been modified according to the particular geometry of the experimental setup. To calculate the optical parameters with Monte Carlo simulations, an initial set of optical properties has been estimated29 on the basis of the measurements obtained by an analytical model (Kubelka-Munk theory).30, 31, 32 These values were used to calculate the transmission and reflection properties of the samples, assuming the Henyey-Greenstein phase function.33 If the differences between calculated and measured data were within 2%, the estimated optical parameters were regarded to represent the real optical properties of the tissue sample. If the expected data did not match the experimental results, the optical parameters were corrected iteratively until the true optical parameters were found.34 The algorithm accounts for the refractive index of the glass slides and of tissue .35 A student’s test was used to compare the data obtained from the normal and adenomatous human colon tissue samples. 3.ResultsIn this investigation, seven different wavelengths of laser were used for radiating the two incision areas of tissue slices. Each measured value at each wavelength in the same condition of experimentation was the mean value gained by 24 repeated measurements for each kind of tissue sample (a total of six tissue samples at the same wavelength), and each tissue sample was measured twice for each incision area of the tissue slice, respectively. The position of the luminous spot of incident light radiation on the sample was changed after each measured datum was obtained. The two incision areas of samples per tissue type were radiated at each wavelength of laser, respectively, and the measured results were reproducible for a specific sample at a specific wavelength. There were no significant differences in the measured values or and/or of the two incision areas of all samples per tissue type at the same wavelength. Consequently, the mean values of , , and of the two incision areas of all samples per tissue type at the same wavelength were obtained from these measurement data. By the inverse Monte Carlo simulation, we gained the wavelength dependence of the absorption coefficients and the scattering coefficients of the transport theory for these tissues from these measurements. The optical properties are expressed as the deviation for all measurements within one group of samples (e.g., normal colon mucosa/submucosa at ). Figures 2 and 3 show differences in the absorption coefficients between both normal and adenomatous human colon mucosa/submucosa and both normal and adenomatous human colon muscle layer/chorion at seven different wavelengths. Figures 4 and 5 show differences in the scattering coefficients between two kinds of colon mucosa/submucosa and two kinds of colon muscle layer/chorion at seven different wavelengths. Figures 6 and 7 show differences in the absorption A, transmission T, and reflection R between both normal and adenomatous human colon mucosa/submucosa and both normal and adenomatous human colon muscle layer/chorion at seven different wavelengths. Fig. 2The absorption coefficients of normal (◆–◆) and adenomatous (∎–∎) human colon mucosa/submucosa, calculated with inverse Monte Carlo simulation.  Fig. 3The absorption coefficients of normal (◆–◆) and adenomatous (∎–∎) human colon muscle layer/chorion, calculated with inverse Monte Carlo simulation.  Fig. 4The scattering coefficients of normal (◆–◆) and adenomatous (∎–∎) human colon mucosa/submucosa, calculated with inverse Monte Carlo simulation.  Fig. 5The scattering coefficients of normal (◆–◆) and adenomatous (∎–∎) human colon muscle layer/chorion, calculated with inverse Monte Carlo simulation.  Fig. 6The results of a Monte Carlo simulation for normal and adenomatous human colon mucosa/submucosa with the same thickness of : ▴–▴, absorption for normal human colon mucosa/submucosa; ▵–▵, absorption for adenomatous human colon mucosa/submucosa; ◇–◇, transmission for normal human colon mucosa/submucosa; ◆–◆, transmission for adenomatous human colon mucosa/submucosa; ◻–◻, reflection for normal human colon mucosa/submucosa; and ∎–∎, reflection for adenomatous human colon mucosa/submucosa.  Fig. 7The results of a Monte Carlo simulation for normal and adenomatous human colon muscle layer/chorion with the same thickness of : ▴–▴, absorption for normal human colon muscle layer/chorion; ▵–▵, absorption for adenomatous human colon muscle layer/chorion; ◇–◇, transmission for normal human colon muscle layer/chorion; ◆–◆, transmission for adenomatous human colon muscle layer/chorion; ◻–◻, reflection for normal human colon muscle layer/chorion; and ∎–∎, reflection for adenomatous human colon muscle layer/chorion. 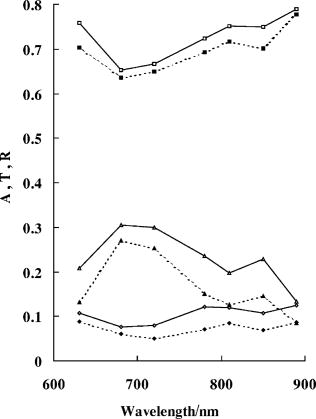 Tables 1, 2 summarize the results of our measurements for four kinds of tissues at the seven different wavelengths, where , , , , and represent the differences of the absorption coefficients, scattering coefficients, absorption, transmission, and reflection, respectively. Table 1The μa and μs were determined for normal and adenomatous human colon mucosa/submucosa by the inverse Monte Carlo simulation from these measurements, and A, T, and R were determined by Monte Carlo simulation.
Table 2The μa and μs were determined for normal and adenomatous human colon muscle layer/chorion by the inverse Monte Carlo simulation from these measurements, and A, T, and R were determined by Monte Carlo simulation.
4.Discussion and ConclusionIn vitro optical properties of normal and adenomatous human colon mucosa/submucosa, and normal and adenomatous human colon muscle layer/chorion, were determined at 630, 680, 720, 780, 810, 850, and . The measurements were performed using a double-integrating-sphere setup, and the optical properties were assessed from these measurements using inverse Monte Carlo simulation. In our study, it is interesting to note the differences in absorption and scattering properties measured between normal and adenomatous human colon tissues at seven different laser wavelengths. We believe these differences in absorption and scattering properties should help to differentiate diagnosis for human colon tissues by using optical methods. For normal and adenomatous colon mucosa/submucosa, the results of this study show that the optical properties and their differences vary with a change of laser wavelength, as shown in Table 1. The maximum absorption coefficient for normal colon mucosa/submucosa is at , and for adenomatous colon mucosa/submucosa is at . The difference of the absorption coefficients between both colon mucosa/submucosa is only 18%, and the difference is also the minimum difference. The minimum absorption coefficient for normal colon mucosa/submucosa is at , and for adenomatous colon mucosa/submucosa is at . The difference of the absorption coefficients between both is 52.8%, whereas the maximum difference of the absorption coefficients between both is 56.8% at . Figure 2 shows the laser wavelength dependence of the absorption coefficients of normal and adenomatous colon mucosa/submucosa. The maximum scattering coefficient for normal colon mucosa/submucosa is at , and for adenomatous colon mucosa/submucosa is at . The difference of the scattering coefficients between both is only 7.52%. The minimum scattering coefficient for normal colon mucosa/submucosa is at , and for adenomatous colon mucosa/submucosa is at . The difference of the scattering coefficients between both is 10.6%. It is obvious that the difference at is also the maximum difference, and the minimum difference of the scattering coefficients between both is 5.46% at . Figure 4 shows the laser wavelength dependence of the scattering coefficients of normal and adenomatous colon mucosa/submucosa. The maximum absorption for normal colon mucosa/submucosa is 0.310 at , and for adenomatous colon mucosa/submucosa is 0.337 at . The difference of the absorption between both is only 8.01%, whereas the difference at is also the minimum difference. The minimum absorption for normal colon mucosa/submucosa is 0.0982 at , and for adenomatous colon mucosa/submucosa is 0.194 at . The difference of the absorption between both is 49.4%, whereas the maximum difference of the absorption between both is 50% at . Figure 6 shows the laser wavelength dependence of the absorption of normal and adenomatous colon mucosa/submucosa. The maximum transmission for normal colon mucosa/submucosa is 0.118 at 780 and , respectively, and for adenomatous colon mucosa/submucosa is 0.0929 at . The difference of the transmission between both at is 21.8%, whereas the difference at is also the minimum difference. The minimum transmission for normal colon mucosa/submucosa is 0.0608 at , and for adenomatous colon mucosa/submucosa is 0.0420 at . The difference of the transmission between both is 30.9%, and the maximum difference of the transmission between both is 40.8% at . Figure 6 also shows the laser wavelength dependence of the transmission of normal and adenomatous colon mucosa/submucosa. The maximum reflection for normal colon mucosa/submucosa is 0.781 at , and for adenomatous colon mucosa/submucosa is 0.712 at . The differences of the reflection between both is 8.84%. The minimum reflection for normal colon mucosa/submucosa is 0.629 at , and for adenomatous colon mucosa/submucosa is 0.621 at . The differences of the reflection between both is 1.27%, and the difference at is also the minimum difference, whereas the maximum difference of the reflection between both is 10.8% at . Figure 6 also shows the laser wavelength dependence of the reflection of normal and adenomatous colon mucosa/submucosa. For normal and adenomatous colon muscle layer/chorion, the results of this study show that the optical properties and their differences also vary with a change of laser wavelength, as shown in Table 2. The maximum absorption coefficient for normal colon muscle layer/chorion is at , and for adenomatous colon muscle layer/chorion is at . The difference of the absorption coefficients between both is 19.8%, whereas the difference at is the minimum difference. The minimum absorption coefficient for normal colon muscle layer/chorion is at , and for adenomatous colon muscle layer/chorion is at . The difference of the absorption coefficients between both is 46.4%. The maximum difference of the absorption coefficients between both is 47.9% at . Figure 3 shows the laser wavelength dependence of the absorption coefficients of normal and adenomatous colon muscle layer/chorion. The maximum of the scattering coefficient for normal colon muscle layer/chorion is at , and for adenomatous colon muscle layer/chorion is at . The difference of the scattering coefficients between both is 8.23%. The minimum scattering coefficient for normal colon muscle layer/chorion is at , and for adenomatous colon muscle layer/chorion is at . The difference of the scattering coefficients between both is 5.88%, whereas the difference at is also the minimum difference, and the maximum difference of the scattering coefficients between both is 9.61% at . Figure 5 shows the laser wavelength dependence of the scattering coefficients of normal and adenomatous colon muscle layer/chorion. The maximum absorption for normal colon muscle layer/chorion is 0.270 at , and for adenomatous colon muscle layer/chorion is 0.305 at . The difference of the absorption between both is 11.5%, whereas the difference at is also the minimum difference. The minimum absorption for normal colon muscle layer/chorion is 0.0843 at , and for adenomatous colon muscle layer/chorion is 0.133 at . The difference of the absorption between both is 36.6%. The maximum difference of the absorption between both is 37% at . Figure 7 shows the laser wavelength dependence of the absorption of normal and adenomatous colon muscle layer/chorion. The maximum transmission for normal colon muscle layer/chorion is 0.125 at , and for adenomatous colon muscle layer/chorion is 0.0878 at . The minimum transmission for normal colon muscle layer/chorion is 0.0769 at , and for adenomatous colon muscle layer/chorion is 0.0502 at . The maximum difference of the transmission between both is 47.4% at , and the minimum difference is 18.7% at . Figure 7 also shows the laser wavelength dependence of the transmission of normal and adenomatous colon muscle layer/chorion. The maximum reflection for normal colon muscle layer/chorion is 0.789 at , and for adenomatous colon muscle layer/chorion is 0.777 at . The difference of the reflection between both is 1.52%, whereas the difference at is also the minimum difference. The minimum reflection for normal colon muscle layer/chorion is 0.653 at , and for adenomatous colon muscle layer/chorion is 0.635 at . The difference of the reflection between both is 2.76%. The maximum difference of the reflection between both is 7.38% at . Figure 7 also shows the laser wavelength dependence of the reflection of normal and adenomatous colon muscle layer/chorion. It is obvious that there were large differences in the absorption coefficients between normal and adenomatous colon mucosa/submucosa, and between normal and adenomatous colon muscle layer/chorion at the same laser wavelength. There were also obvious differences in the scattering coefficients between normal and adenomatous colon mucosa/submucosa, and between normal and adenomatous colon muscle layer/chorion at the same laser wavelength. There were large differences in absorption and transmission between normal and adenomatous colon mucosa/submucosa, and between normal and adenomatous colon muscle layer/chorion at the same laser wavelength. There were also obvious differences in reflection between normal and adenomatous colon mucosa/submucosa, and between normal and adenomatous colon muscle layer/chorion at the same laser wavelength. The differences in absorption coefficients between normal and adenomatous tissues are more significant than those in scattering coefficients. The result was due to tumors and cancerous tissues exhibiting increased microvasculature, and hence increased blood content.36 In conclusion, the optical properties and their differences of normal and adenomatous human colon tissues in vitro at 630-, 680-, 720-, 780-, 810-, 850-, and wavelengths of a Ti:sapphire laser have been investigated. It is shown that the optical properties and their differences vary with a change of laser wavelength for normal and adenomatous colon mucosa/submucosa and normal and adenomatous colon muscle layer/chorion. The maximum absorption coefficients for normal and adenomatous human colon mucosa/submucosa were , and the minimum absorption coefficients for both were . The maximum difference of the absorption coefficients between both is 56.8% at . The maximum scattering coefficients for normal and adenomatous colon mucosa/submucosa were , and the minimum scattering coefficients for both were . The maximum difference of the scattering coefficients between both is 10.6% at . The maximum absorption coefficients for normal and adenomatous colon muscle layer/chorion was , and the minimum absorption coefficients for both were . The maximum difference of the absorption coefficients between both is 47.9% at . The maximum scattering coefficients for normal and adenomatous colon muscle layer/chorion were , and the minimum scattering coefficients for both were . The maximum difference of the scattering coefficients between both is 9.61% at . The differences in absorption coefficients between normal and adenomatous tissues are more significant than those in scattering coefficients. Tissues of various pathologies have differing absorption and scattering properties, and all these differences would be helpful in clinical applications of lasers. AcknowledgmentsThe authors gratefully acknowledge the development of the Monte Carlo technique by L. H. Wang. The authors would like to acknowledge the National Natural Science Foundation of China (item number 60378043), and the Research-Team Project of the Natural Science Foundation of Guangdong Province (item number 015012) for supporting this work. ReferencesY. L. Kim,
Y. Liu,
R. K. Wali,
H. K. Roy,
M. J. Goldberg,
A. K. Kromin,
K. Chen, and
V. Backman,
“Simultaneous measurement of angular and spectral properties of light scattering for characterization of tissue microarchitecture and its alteration in early precancer,”
IEEE J. Sel. Top. Quantum Electron., 9 243
–256
(2003). https://doi.org/10.1109/JSTQE.2003.814183 1077-260X Google Scholar
S. Argov,
J. Ramesh,
A. Salman,
I. Sinelnikov,
J. Goldstein,
H. Guterman, and
S. Mordechai,
“Diagnostic potential of Fourier-transform infrared microspectroscopy and advanced computational methods in colon cancer patients,”
J. Biomed. Opt., 7
(2), 248
–254
(2002). https://doi.org/10.1117/1.1463051 1083-3668 Google Scholar
D. K. Rex,
“Colon tumors and colonoscopy,”
Endoscopy, 32 874
–883
(2000). https://doi.org/10.1055/s-2000-8086 0013-726X Google Scholar
H. Miyoshi,
M. Oka,
K. Sugi,
O. Saitob,
K. Katsu, and
K. Uchida,
“Accuracy of detection of colorectal neoplasia using an immunochemical occult blood test in symptomatic referred patients: Comparison of retrospective and prospective studies,”
Intern Med., 39 701
–706
(2000). 0918-2918 Google Scholar
M. D. Falco,
M. Lepore, and
P. L. Indovina,
“Differences in optical properties of normal and tumoral tissues: a comparison to accuracy limits in laser techniques for optical imaging,”
Proc. SPIE, 4160 245
–253
(2000). 0277-786X Google Scholar
J. R. Mourant,
A. H. Hielscher,
A. A. Eick,
T. M. Johnson, and
J. P. Freyer,
“Evidence of intrinsic differences in the light scattering properties of tumorigenic and nontumorigenic cells,”
Cancer Cytopathol., 84 366
–374
(1998). Google Scholar
J. Swartling,
J. S. Dam, and
S. Andersson-Engels,
“Comparison of spatially and temporally resolved diffuse-reflectance measurement systems for determination of biomedical properties,”
Appl. Opt., 42 4612
–4620
(2003). 0003-6935 Google Scholar
N. Shah,
A. Cerussi,
C. Eker,
J. Espinoza,
J. Butler,
J. Fishkin,
R. Hornung, and
B. Tromberg,
“Noninvasive functional optical spectroscopy of human breast tissue,”
Proc. Natl. Acad. Sci. U.S.A., 98 4420
–4425
(2001). https://doi.org/10.1073/pnas.071511098 0027-8424 Google Scholar
N. Shah,
A. E. Cerussi,
D. Jakubowski,
D. Hsiang,
J. Butler, and
B. J. Tromberg,
“Spatial variations in optical and physiological properties of healthy breast tissue,”
J. Biomed. Opt., 9
(3), 534
–540
(2004). https://doi.org/10.1117/1.1695560 1083-3668 Google Scholar
A. Alwin Kienle and
T. Glanzmann,
“In vivo determination of the optical properties of muscle with time-resolved reflectance using a layered model,”
Phys. Med. Biol., 44 2689
–2702
(1999). https://doi.org/10.1088/0031-9155/44/11/301 0031-9155 Google Scholar
P. Yu,
L. Peng,
M. Mustata,
J. J. Turek,
M. R. Melloch, and
D. D. Nolte,
“Time-dependent speckle in holographic optical coherence imaging and the health of tumor tissue,”
Opt. Lett., 29 68
–70
(2004). https://doi.org/10.1364/OL.29.000068 0146-9592 Google Scholar
Z. W. Huang,
W. Zheng,
S. S. Xie,
R. Chen,
H. S. Zeng,
D. I. McLean, and
H. Lui,
“Laser-induced autofluorescence microscopy of normal and tumor human colonic tissue,”
Int. J. Oncol., 24 59
–63
(2004). 1019-6439 Google Scholar
R. Marchesini,
M. Brambilla,
E. Pignoli,
G. Bottiroli,
A. C. Croce,
M. Dal Fante,
P. Spinelli, and
S. di Palma,
“Light-induced fluorescence spectroscopy of adenomas, adenocarcinomas and non-neoplastic mucosa in human colon. I. In vitro measurements,”
J. Photochem. Photobiol., B, 14 219
–230
(1992). https://doi.org/10.1016/1011-1344(92)85100-9 1011-1344 Google Scholar
C. Pitris,
C. Jesser,
S. A. Boppart,
D. Stamper,
M. E. Brezinski, and
J. G. Fujimoto,
“Feasibility of optical coherence tomography for high-resolution imaging of human gastrointestinal tract malignancies,”
J. Gastroenterol., 35 87
–92
(2000). 0944-1174 Google Scholar
N. Ugryumova,
S. J. Matcher, and
D. P. Attenburrow,
“Measurement of bone mineral density via light scattering,”
Phys. Med. Biol., 49 469
–483
(2004). https://doi.org/10.1088/0031-9155/49/3/009 0031-9155 Google Scholar
D. Zhu,
Q. M. Luo, and
J. Cen,
“Effects of dehydration on the optical properties of in vitro porcine liver,”
Lasers Surg. Med., 33 226
–231
(2003). https://doi.org/10.1002/lsm.10215 0196-8092 Google Scholar
J. F. Beek,
P. Blokland,
P. Posthumus,
M. Aalders,
J. W. Pickering,
H. J. C. M. Sterenborg, and
M. J. C. van Gemert,
“In vitro double-integrating-sphere optical properties of tissues between 630 and ,”
Phys. Med. Biol., 42 2255
–2261
(1997). https://doi.org/10.1088/0031-9155/42/11/017 0031-9155 Google Scholar
J. W. Pickering,
C. J. M. Moes,
H. J. C. M. Sterenborg,
S. A. Prahl, and
M. J. C. van Gemert,
“Two integrating spheres with an intervening scattering sample,”
J. Opt. Soc. Am. A, 9 621
–631
(1992). 0740-3232 Google Scholar
J. W. Pickering,
S. Bosman,
P. Posthumus,
P. Blokland,
J. F. Beek, and
M. J. C. van Gemert,
“Changes in the optical properties of slowly heated myocardium,”
Appl. Opt., 32 367
–371
(1993). 0003-6935 Google Scholar
J. W. Pickering,
S. A. Prahl,
N. van Wieringen,
J. F. Beek, and
M. J. C. van Gemert,
“Double-integrating-sphere system for measuring the optical properties of tissue,”
Appl. Opt., 32 399
–410
(1993). 0003-6935 Google Scholar
R. van Hillegersberg,
J. W. Pickering,
M. Aalders, and
J. F. Beek,
“Optical properties of rat liver and tumor at and : Photofrin enhances scattering,”
Lasers Surg. Med., 13 31
–39
(1993). 0196-8092 Google Scholar
S. L. Jacques,
C. A. Alter, and
S. A. Prahl,
“Angular dependence of HeNe laser light scattering by human dermis,”
Lasers Life Sci., 1 309
–334
(1987). https://doi.org/10.1023/A:1010013106294 0886-0467 Google Scholar
L. H. Wang and
S. L. Jacques,
“Monte Carlo modeling of light transport in multi-layered tissues in standard C,”
(1992) Google Scholar
C. J. Hourdakis and
A. Perris,
“A Monte-Carlo estimation of tissue optical properties for use in laser dosimetry,”
Phys. Med. Biol., 40 351
–364
(1995). https://doi.org/10.1088/0031-9155/40/3/002 0031-9155 Google Scholar
A. Roggan,
D. Schädel,
U. Netz,
J. P. Ritz,
C. T. Germer, and
G. Müller,
“The effect of preparation technique on the optical parameters of biological tissue,”
Appl. Phys. B, 69 445
–453
(1999). https://doi.org/10.1007/s003400050833 0946-2171 Google Scholar
B. C. Wilson and
G. Adam,
“A Monte Carlo model for the absorption and flux distributions of light in tissue,”
Med. Phys., 10 824
–830
(1983). https://doi.org/10.1118/1.595361 0094-2405 Google Scholar
S. A. Prahl,
M. Keijzer,
S. L. Jacques, and
A. J. Welch,
“A Monte Carlo model of light propagation in tissue,”
Proc. SPIE, 1035 102
–111
(1989). 0277-786X Google Scholar
V. V. Tuchin,
S. R. Utz, and
I. V. Yaroslavsky,
“Tissue optics, light distribution and spectroscopy,”
Opt. Eng., 33
(10), 3178
–3188
(1994). 0091-3286 Google Scholar
M. J. C. van Gemert and
W. M. Star,
“Relations between the Kubelka-Munk and the transport equation models for anisotropic scattering,”
Lasers Life Sci., 1 287
–298
(1987). https://doi.org/10.1088/1742-2132/1/4/007 0886-0467 Google Scholar
P. Kubelka and
F. Munk,
“Ein Beitrag zur Optik der Farbanstriche,”
Z. Tech. Phys. (Leipzig), 11 593
–601
(1931). 0373-0093 Google Scholar
P. Kubelka,
“New contributions to the optics of intensely light-scattering materials, Part I,”
J. Opt. Soc. Am., 38 448
–457
(1948). 0030-3941 Google Scholar
P. Kubelka,
“New contributions to the optics of intensely light-scattering materials, Part II,”
J. Opt. Soc. Am., 44 330
–335
(1954). 0030-3941 Google Scholar
S. A. Prahl,
“Light transport in tissue,”
Univ. Texas at Austin,
(1988). Google Scholar
M. Hammer,
A. Roggan,
D. Schweitzer, and
G. Muller,
“Optical properties of ocular fundus tissues—an in vitro study using the double-integrating-sphere technique and inverse Monte Carlo simulation,”
Phys. Med. Biol., 40 963
–978
(1995). https://doi.org/10.1088/0031-9155/40/6/001 0031-9155 Google Scholar
F. P. Bolin,
L. E. Preuss,
R. C. Taylor, and
R. J. Ference,
“Refractive index of some mammalian tissues using a fiber optic cladding method,”
Appl. Opt., 28 2297
–2303
(1989). 0003-6935 Google Scholar
R. K. Jain,
“Determinants of tumor blood flow: a review,”
Cancer Res., 48 2641
–2658
(1988). 0008-5472 Google Scholar
|
||||||||||||||||||||||||||||||||||||||||||||||||||||||||||||||||||||||||||||||||||||||||||||||||||||||||||||||||||||||||||||||||||||||||||||||||||||||||||||||||||||||||||||||||||||||||||||||||||||||||||||||||||||||||||||||||||||||||||||||||||||||||||||||||||||||||||||||||||||


