|
|
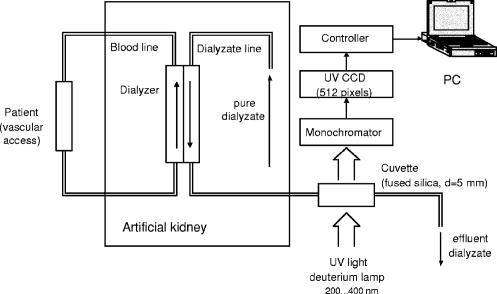
1.IntroductionOn-line monitoring of extracorporal detoxication processes, including hemodialysis (HD) and continuous ambulatory peritoneal dialysis (CAPD), is vital for practical medicine. Today HD and CAPD are the only ways to support the life of patients with terminal stage of chronic renal failure (CRF). Despite an obvious progress in HD equipment technology, there are no effective and economically justified methods to control HD sessions on-line, which is key to achieve the prescribed level of dialysis adequacy. Devices containing urease-based urea sensors like Baxter Biostat 1000 ® (Tampa Bay, FL) or Ureascan P2 Hospal ® (Stockholm, Sweeden) are not widely used in clinical practice, as the cost of disposable materials is comparable to the cost of dialysis itself.1, 2, 3, 4, 5 Several attempts to develop methods for on-line hemodialysis monitoring that are based on UV and IR absorption spectrometry have been made.6, 7, 8, 9, 10, 11 We have been carrying out the research for several years and have developed equipment and techniques to monitor body fluids using UV extinction spectra.12, 13, 14, 15 Realizing such monitoring was proved in papers.12, 15, 16 The study of many hemodialysis and peritoneal dialysis sessions has shown that there is a certain correlation between low molecular weight components, including creatinine, uric acid and urea, and concentration changes in effluent dialyzate, and corresponding UV extinction spectra changes in the 200 to 400-nm spectral region. It is necessary to mention that the ultraviolet spectra of body fluids do not have narrow isolated absorption bands that could be linked to a certain chromophore. Furthermore, component concentrations are rather high, which lead to a significant deviation from the classical linear Beer’s law.17 Therefore, standard methods of spectrophotometric analysis based on the measurement of the extinction factor at one to two wavelengths and subsequent calculation of the concentration with the help of calibrations curves or tables is not applicable to biological fluids. For each given fluid, it is necessary to develop a complex nontrivial technique, taking into account fluid characteristics and using the entire absorption curve in to informative spectral range. While solving the problem, we found that dialyzate extinction spectra obtained from different patients are quite similar but at the same time have distinctive individual features, which should be taken into account in the algorithm of spectrophotometric analysis. In the work, the results of the studies of the individual features of dialyzate extinction spectra obtained from a large group of patients suffering from CRF are given, quantitative parameters describing the shape of spectra in the informative wavelength region are determined, statistical analysis of the spectral curve shape is carried out, classification of spectra is offered, and a possible correlation between the shape of the spectrum and blood plasma individual features is considered. 2.InstrumentationThe novel system for monitoring hemodialysis sessions shown in Fig. 1 was used to register dialyzate extinction spectra.14 The core of the system is a multichannel spectrophotometer constructed according to Rowland’s scheme with a concave diffraction grating. The registration is carried out with an UV sensitive CCD linear sensor containing 512 pixels; the signal from the sensor processed by the controller is directed to a PC. Minimal time of registration of one spectrum is 8 ms; the signal to noise ratio is . The source of UV light was a deuterium-neon lamp. The error of measurements is no more than . The spectrophotometer is equipped with a flow-through fused silica cuvette with optical length . The cuvette is connected to the effluent line of a dialysis machine. It makes automatic spectra registration in the course of a HD session possible. Such connection completely excludes any influence of the equipment on the functioning of the dialysis machine and is absolutely safe for the patient. Specially designed software provides the standard set of functions: choosing a registration mode, compensation of a dark signal, direct calculation of a transmission spectrum using previously saved 100% transmission reference [Eq. 1, as well as fully automatic on-line spectrum registration and processing for the determination of dialyzate composition changes during HD sessions. Spectral transmissions are calculated as follows: where is the signal corresponding to effluent dialyzate, is the signal corresponding to 100% transmission reference, is the dark signal, and is the pixel number in the CCD sensor. The pixel number is subsequently translated into the wavelength using the built-in calibration.3.Results and Discussion3.1.Study of UV Dialyzate Fluid Extinction Spectra in the Process of HD and CAPDThe research revealed that the shape of dialyzate transmission spectra in the informative UV region has clear individual character, i.e., it greatly varies from one patient to another. At the same time, the shape of the spectrum for a certain patient remains virtually invariable in the course of the HD session, whereas the overall absorption level is decreasing. Moreover, prolonged observations of the group of patients have shown that for each given patient the shape of the spectra, measured during several sessions some months or weeks apart, is almost unchanged. Some characteristic types of transmission curves have been specified; they are referentially called A, B, and C types (see Fig. 2 ). On A spectra, the distinguished minimum in transmission is close to 265 nm; on C spectra the monotonous growth of transmission with increase of wavelength is observed; and on B spectra in the 265- to 285-nm range transmission weakly depends on wavelength. Figure 2 shows dialyzate UV transmission spectra of various types at different moments during dialysis sessions. The patients on HD were treated with a Fresenius 4000 - 8F machine, dialyzer F60 (Bad Homburg, Germany); for CAPD, the Stay-Safe set from Baxter (Tampa Bay, FL) was used. The time when the sample was taken is given on the diagrams (10, 30, 90, and 180 min in the course of a HD session; and for CAPD, the duration of a peritoneal exchange was 2, 3, 4, 5, and 10 h). Fig. 2Dialyzate transmission spectra of different types for HD (on the left) and CAPD (on the right).  The individual character and the temporal stability of the spectrum shape can be caused by at least two different factors. First, it is possible to assume that UV absorbing components are present in patient’s blood in constant proportions that do not change for a long time. Second, various HD modes and types of dialyzers with a set of parameters (blood flow, dialyzate flow, properties of semipermeable membrane, dialyzate concentrate) that are most suitable for a particular patient are used. It can also influence the effluent dialyzate composition and, hence, spectrum shape. The most of these factors can easily be excluded by comparing the shape of dialyzate transmission curves of the patients undergoing different treatment modalities—HD and CAPD. In this connection, the spectra of dialyzate obtained from two groups of patients suffering CRF of various stages were studied. The first group (78 people) consisted of patients on HD, second group (42 people) included patients who received CAPD. The measurements were carried out in City Hospital 12, Hemocorrection Center, Saint Petersburg, Russia. The technique of the experiment was as follows.!
The research has confirmed that the spectrum shape and overall transmission level are not the same for each patient, i.e., they have individual character. On the other hand, no considerable differences between HD and CAPD groups have been revealed at this stage. Hence, the processes of UV absorbing uremic toxin elimination by HD (artificial membranes) and CAPD (natural membrane) are virtually identical. Thus, the individual features of dialyzate spectra are not related to the properties of dialysis membranes, but reflect the peculiarities of plasma composition. It is known that dialysis is carried out to remove from the patient’s body low molecular weight uremic toxins—urea, creatinine, uric acid and a number of other substances—whose molecular weight does not exceed 500 Da. The rate of the process depends on the concentration gradient in the dialyzer, component’s molecular weight, blood flow velocity and dialyzate flow velocity, parameters of dialysis membrane, and a number of other, less important factors. The shape of the transmission spectrum depends on the position of absorption bands and concentration of UV absorbing substances, which are contained in human blood and dialyzate. Only a few substances with high specific extinction in the working spectral region are informative, i.e., could make a substantial contribution to the overall absorption and, hence, influence the shape of the spectrum. The fact that the shape of the spectrum in the course of a session remains constant shows that the concentrations of such substances in patients’ blood decrease proportionally. It has been partly proved earlier by experimental estimations of variations of uremic toxin concentrations (urea, creatinine, uric acid, and others) in plasma and dialyzate in the course of a dialysis session using rigorous biochemical methods including HPLC.18 Toward the end of a session, concentrations of removing substances decrease 3 to 5 times, which accounts for the lowering of an overall absorption level. If there was only one informative component, dialyzate transmission spectra taken from many patients would be identical in shape. The differences that can be seen in Fig. 2 could be explained if we assume that there are at least two informative components. The ratio of concentrations of these components in plasma is individual and determines the shape of the spectrum. As a dialysis membrane does not influence the spectrum shape, this phenomenon may be related to age, sex, stage of CRF, dialysis dose ( parameter), or accompanying diseases. Also, the genetic origin cannot be disregarded. To exclude some of the previously stated reasons, it is necessary to carry out the statistical analysis of the spectrum shape probability distribution for a large group of patients. 3.2.Statistical Analysis of Dialyzate Spectra Distribution Through the Shape of the Spectral CurveTo statistically process the results obtained on the previous stage, it is necessary to introduce a quantitative parameter describing the spectrum shape. It can be made in two ways. In the first way, such parameter was the ratio of integral extinctions in the - to 265-nm and - to 298-nm spectral regions. The ratio was calculated for dialyzate extinction spectra of each patient included in the studied group (77 for HD and 41 for CAPD). The shape of dialyzate spectra for two patients (one in each group) greatly differed from others and is considered separately. The parameter varied from 0.5 to 1.7. This range was divided into intervals with a 0.2 step. Then the number of patients for each interval was counted up (see Table 1 ) and the histograms for HD and CAPD groups were plotted (see Fig. 3 ). Fig. 3Histograms of the patient distribution by parameter for HD (on the left) and CAPD (on the right) groups based on experimental data and corresponding Gaussian distribution.  Table 1Experimental distribution of HD and CAPD patients by F1∕F2 parameter.
Statistical analysis has shown that the distribution of patients by the parameter both for HD and CAPD can be mathematically described by the normal law (Gauss distribution): As stated before, spectra of dialyzate can be visually classified into three groups A, B, or C by the shape of a transmission curve. In the terms of the parameter, each group corresponds to the specific range of values: group A, range , mean insight the group 0.78 group B, range , mean insight the group 1.18 group C, range , mean insight the group 1.58. Parameter is the ratio of integral extinction in two selected spectral regions, each of them embraces no less than 25 discrete wavelengths (polychromator channels). The error of determination for the given spectrum depends on the absorption level and the shape of the curve, and does not exceed . For the group of patients characterizing different spectrum types (12 HD patients and 8 CAPD patients), prolonged observations have been carried out to determine long-term variations. Table 2 shows for hemodialyzate samples obtained at the 60th minute of several HD sessions conducted at intervals in weeks or months (see Fig. 4 ). Table 3 shows the same data for CAPD sessions; duration of peritoneal exchanges is 2 h. Fig. 4Transmission spectra of dialyzate samples taken from two patients at the 60th minute of several HD sessions.  Table 2Variations of F1∕F2 parameter for HD patients in the course of prolonged observations.
Table 3Variations of F1∕F2 parameter for CAPD patients in the course of prolonged observations.
Summarizing the results of the experimental data analysis is as follows. The shape of the spectrum remains virtually unchanged in the course of a HD or CAPD session for every given patient. Differences between the spectra of different patients surely exceed variations within a session for one patient and the error of measurement. The shape of the spectrum remains almost constant for every given patient in the course of prolong observations during several HD or CAPD sessions some month or weeks apart. Differences between the spectra of different patients surely exceed long-term variations for a given patient. Spectra of one patient on HD and one patient receiving CAPD do not fall into intervals and cardinally differ in shape from the spectra of other patients. There is a strong absorption in all working spectral ranges. Such spectra could not be described by the offered classification; a special group–conditional CC type—should be specified (see Fig. 5 ). Most likely there is one more informative component characterized by at least two absorption bands in the spectral regions shorter than 260 nm and larger than 280 nm, respectively. In the second approach, the coefficient of similarity in relation to a reference spectrum was used as the parameter describing the shape of dialyzate spectra. It makes it possible to estimate spectrum shape variations in a wide wavelength range regardless of any absorption bands. To do this, a working spectrum and a reference spectrum should be presented as an N-dimensional vector of absorption coefficients in to wavelength range. At first, similarity coefficients for all measured spectra in relation to the B type reference spectrum were calculated. It appeared that it is unpractical to use it directly, as its absolute value for all spectra is close to unity. More informative is the difference of similarity coefficients in the wavelength region 240 to 320 nm, calculated relatively to C and A type reference spectra, characterized by the greatest and the least values in the sample, respectively. Then values were calculated for patients from both groups. Statistical analysis (reference spectra were excluded from the sample) has shown that patients are also distributed by parameter under the normal law: for the HD (sample ), and for CAPD (sample ). Moreover, there is a strong correlation between and for CAPD and for HD. Statistical analysis has shown that there is no correlation between the shape of spectra ( parameter) and patients’ sex, age, stage of CRF, the time since the beginning of dialysis therapy, dialysis doze, azotemia severity, hemoglobin, or general protein levels. Therefore, determination of the diagnostic and prognostic importance of the spectrum shape is a subject of future research. Thus, the research shows that in the 250- to 300-nm wavelength interval in dialyzate spectra there are indications of at least two informative components. Their relative concentrations determine the shape of the spectral curve. Analysis of the absorption spectra of known dialyzate constituents allows us to assume that the absorption band in the 280- to 300-nm spectral range can be attributed to uric acid. This substance freely penetrates through the dialysis membrane, and its presence in dialyzate has been confirmed by chromatographic measurements.18, 19 The second absorption band in the 250- to 270-nm spectral range can be attributed to many low molecular weight substances. It is necessary to take into account that analyzed dialyzate samples were obtained from patients suffering CRF of various stages with different accompanying diseases, and many such substances are retained in plasma in concentrations much higher than normal ones. The study of plasma, urine, and dialysate by HPLC before and after HD sessions18 shows that the following components have strong ultraviolet absorption at 254 nm: uric acid, hippuric acid, creatinine, hypoxanthine, xanthine, pseudouridine, uracyl, adenosine, and p-hydroxyhippuric acid. Considering the characteristic features of the absorption spectra (positions of absorption minimum and maximum, curve shape) of these substances in the wavelength region 250 to 300 nm, it can be concluded that uracyl, pseudouridine, uridine, and adenosine match the spectral criteria for unknown components. Only adenosine takes part in the purine metabolic chain, which ends up with uric acid. But by now the second component is not reliably identified and also could be related to other metabolic chains. 4.ConclusionThus, the comparative analysis of hemodialyzate and peritoneal dialyzate UV extinction spectra shows that there are distinctive individual features unique to each patient. The shape of the spectrum remains virtually invariable for a given subject during the whole period of the study (more than a year), and does not depend on the treatment modality (HD or CAPD) or other factors like sex, age, the stage of chronic renal failure, or concomitant illnesses. It allows us to assume that the revealed spectra peculiarities are mainly caused by the differences of blood plasma composition and do not directly depend on dialysis membrane properties. The ratio of dialyzate integral extinction in two specified spectral regions could be used as a quantitative parameter, reflecting individual features of plasma composition. It has been revealed that for both groups (HD and CAPD treatment), patients statistically distributed by this parameter according to the normal law. The research proves that in the spectral range of 240 to 320 nm in dialyzate transmission spectra, there are indications of at least two components. One of them is most likely uric acid. The other is not biochemically identified, but there are indirect evidences that it is one of the purines or pyrimidine derivatives, presumably adenosine. In any case, individual features of plasma need to be taken into account while conducting peritoneal or hemodialysis. AcknowledgmentsThe work was partly financed through the Ministry of Education of Russian Federation grant A03-3.20-68 (grant for supporting PhD research). The authors acknowledge K. Y. Gurevich, the chief of City Hospital 12, Hemocorrection Center, Saint Petersburg, Russia, for assistance in the practical realization of hemodialysis monitoring and obtaining peritoneal dialyzate samples. ReferencesP. R. Keshaviah,
J. P. Ebben, and
P. F. Emerson,
“On-line monitoring of the delivery of the hemodialysis prescription,”
Pediatr. Nephrol., 9 S2
–S8
(1995). 0931-041X Google Scholar
L. Chiari,
A. Cappello,
R. Tartarini,
F. Paolini, and
P. Calzavara,
“Model based dialysis adequacy prediction by continuous dialysate urea monitoring,”
Int. J. Artif. Organs, 21 526
–534
(1998). 0391-3988 Google Scholar
M. R. Marshall,
P. Santamaria, and
J. F. Collins,
“Biostat 1000 and Daugirdas blood-based hemodialysis quantification: agreement and reproducibility,”
Am. J. Kidney Dis., 31 1011
–1018
(1998). 0272-6386 Google Scholar
G. Arrigo,
G. Tetta,
A. Santoro,
P. Ghezzi,
C. Ronco,
G. Colasant,
G. La Greca,
P. Zucchelli, and
G. D’Amico,
“Continuous urea monitoring in hemodialysis: a model approach to forecast dialytic performance. Results of a multicenter study,”
Am. J. Nephrol., 14 481
–487
(2001). 0250-8095 Google Scholar
C. Ronco,
P. M. Ghezzi, and
G. La Greca,
“The role of technology in hemodialysis,”
Am. J. Nephrol., 12 68
–81
(1999). https://doi.org/10.1002/1522-2586(200007)12:1<68::AID-JMRI7>3.0.CO;2-2 0250-8095 Google Scholar
G. Gal and
J. Grof,
“Continuous UV photometric monitoring of the efficiency of hemodialysis,”
Int. J. Artif. Organs, 3 338
–341
(1980). 0391-3988 Google Scholar
G. Gal,
J. Grof, and
E. Kiss,
“Continuous monitoring of the efficiency of haemodialysis by recording the UV transmittance of the dialysis solution,”
Acta Chir. Hung., 24 231
–239
(1983). 0231-4614 Google Scholar
I. Fridolin,
M. Magnusson, and
L. G. Lindberg,
“On-line monitoring of solutes in dialysate using absorption of ultraviolet radiation: technique description,”
Int. J. Artif. Organs, 25 748
–761
(2002). 0391-3988 Google Scholar
F. Uhlin,
I. Fridolin,
M. Magnusson, and
L. G. Lindberg,
“Estimation of delivered dialysis dose by on-line monitoring of the ultraviolet absorbance in the spent dialysate,”
Am. J. Kidney Dis., 41 1026
–1036
(2003). 0272-6386 Google Scholar
I. Fridolin and
L. G. Lindberg,
“On-line monitoring of solutes in dialysate using wavelength-dependent absorption of ultraviolet radiation,”
Med. Biol. Eng. Comput., 41 263
–270
(2003). 0140-0118 Google Scholar
J. T. Olesberg,
B. Armitage,
M. A. Arnold, and
M. J. Flanigan,
“On-line measurement of urea concentration in spent dialysate during hemodialysis,”
Proc. SPIE, 4624 95
–105
(2002). 0277-786X Google Scholar
A. M. Vasilevsky and
N. V. Kornilov,
“Monitoring the dialysis liquid during hemodialysis from the extinction spectra in the UV region,”
J. Opt. Technol., 66 692
–695
(1999). 1070-9762 Google Scholar
K. Ya. Gurevich,
A. M. Vasilevsky,
A. A. Sokolov,
A. L. Shavkin,
A. K. Gurevich, and
U. V. Konstantinov,
“Dialysis monitoring by the spectrophotometrically analysis of dialyzate,”
J. Am. Soc. Nephrol., 12 266
(2001). 1046-6673 Google Scholar
A. M. Vasilevsky and
N. V. Kornilov,
“Device to monitor liquid biological medium,”
(1998) Google Scholar
A. M. Vasilevsky,
N. V. Kornilov,
K. Y. Gurevich, and
A. A. Sokolov,
“Way of analysis of liquid biological medium in process of monitoring,”
(2001) Google Scholar
A. M. Vasilevsky and
G. A. Konoplyov,
“Using UV spectrophotometry to analyze peritoneal dialyzate,”
J. Opt. Technol., 71 180
–182
(2004). 1070-9762 Google Scholar
A. M. Vasilevsky,
G. A. Konoplyov, and
N. V. Kornilov,
“Study of the absorption spectra of albumin and uric acid in the UV region,”
J. Opt. Technol., 68 928
–930
(2001). 1070-9762 Google Scholar
R. C. Vanholder,
R. V. Smet, and
S. D. Ringoir,
“Assessment of urea and other uremic markers for quantification of dialysis efficacy,”
Clin. Chem., 38 1429
–1436
(1992). 0009-9147 Google Scholar
E. J. Knudson,
Y. C. Lau,
H. Veening, and
D. A. Dayton,
“Time-concentration studies by high-performance liquid chromatography of metabolites removed during hemodialisis,”
Clin. Chem., 24 686
–691
(1978). 0009-9147 Google Scholar
|
||||||||||||||||||||||||||||||||||||||||||||||||||||||||||||||||||||||||||||||||||||||||||