
|
|
|
Diffuse optical fluorescence tomography (DOFT) is an emerging technology to image fluorophore spatial distributions in deep tissues or other structures that are dominated by elastic scattering. The modality involves both a complex theoretical framework1, 2, 3, 4 as well as advanced experimental systems.5, 6, 7 Several studies have shown evidence of successful fluorescence tomography in both phantom and animal models.8 Case examples have been presented to illustrate the accuracy and precision of select images, but few studies have addressed the limits of imaging performance in a systematic manner, following the conventions of standard medical imaging practice. Graves examined the limits of detectable contrast for a particular sized object and the spatial resolution limits for a particular contrast level for their system configuration.8 The natural extension of this work is to fully consider the known trade-off between an object’s size and contrast, in terms of detectability. Contrast-detail analysis can be used to systematically define three imaging performance regimes; a spatial-resolution-limited regime, a signal-to-noise (SNR)-limited regime, and a transitional regime that describes the trade-off between object size and contrast. In this letter, an optimized DOFT reconstruction algorithm is evaluated in the context of size-contrast analysis, and the expected limits of image recovery are discussed. Contrast-detail analysis is commonly used to determinethe performance of a medical imaging system9, 10, 11 and hasbeen previously adapted to near-infrared (NIR) diffuse tomography.12, 13 Such performance measurements seek to determine the contrast thresholds for an imaging system, providing quality assurance, optimization, and intersystem comparisons. Determining the detection threshold for a given range of object diameters can generate limits on minimum detectable object size and contrast. The diffuse nature of NIR photon propagation in biological tissue is the foundation of the model system used. In this regime, the initial excitation source and the fluorescence emission photon field can be described by a system of coupled diffusion equations, as presented in Ref. 1. The imaging algorithm used here incorporates a finite element solution of these coupled equations, and the inverse problem is solved iteratively for the spatial distribution of fluorescence yield, , where η is the fluorescence quantum yield and is the fluorophores absorption at the excitation wavelength. Simulated data was generated by solving the model system using typical tissue optical property parameters of and , and extracting the boundary data at each simulated detector position. To compare the influence of domain size on contrast-detail characteristics, two circular test fields were used; one in diameter and the other in diameter. The smaller test field approximates a domain expected to be encountered in small animal imaging and the test field mimics larger imaging fields such as a human breast. Each test field was simulated as a 10,000-node circular mesh circumscribed by 16 source/detector fiber positions and used to generate 240 data points, matching our experimental fluorescence tomography design. The system is similar to our automated tomography system currently in clinical trials.14 Random noise was added to each transmission data point with 1% mean error. Image reconstruction was performed with a nonlinear Newton-Raphson type algorithm, which was stopped when the projection error changed by less than 2% between iterations. Intrinsic optical properties , , , and were held constant, as were the fluorophore lifetime and quantum yield . The algorithm recovered the fluorescence yield only, , as a best-case scenario for how accurately the images can be formed. The homogeneous background fluorescence yield, , was used as an initial estimate for the iterative algorithm. Figure 1 shows an example of a reconstructed image and compares the estimated property values with the true values for an object near the edge of the phantom. The regularization parameter was selected empirically and weighted at each iteration by the maximum of the diagonal of , where is the Jacobian matrix . The algorithm in this example converged after 12 iterations. Fig. 1Typical reconstructed image (a) in the test field showing the value of for simulated data with 1% random noise and set to 0.1. Reconstructed and actual values are compared (b) along the vertical transect through the object superimposed on the image.  The contrast parameter, fluorophore absorption , was varied for a single object, or region of interest (ROI), while the background fluorophore absorption was held constant at . Contrast was calculated as where the absorption coefficient values were the true values used to simulate the data. Images were recovered for each contrast and test object diameter combination. For both test fields, and , these calculations were repeated for two different object positions, one near the edge of the phantom (object edge from the boundary), and one near the center (object center from the test field center). At least 2,000 images (similar to the image shown in Fig. 1) for each of the four test cases were used in the analysis.Contrast-detail studies for clinical systems often use trained readers to determine the threshold for detectable contrast and size. In the current study, CNR is specified as a surrogate parameter of detectability, which provides an objective threshold measure. CNR was calculated directly from the reconstructed images following the approach outlined in Song 13 where and are weighting factors compensating for the relative area of the ROI and the background, as a fraction of the total test field area. The values and are the standard deviations in the ROI and background regions of the reconstructed image, respectively. The ROI size and location are assumed known, which is common for contrast-detail analyses where the objective is to determine system performance for a known test field.CNR is plotted as a function of both ROI diameter and true contrast for an object just off-center in the test field edge (Fig. 2 ). Similar plots were generated for the other three cases examined. By specifying a minimum CNR value required to “detect” an object, the contrast threshold for visibility is determined for each object diameter. The choice of a minimum CNR value is somewhat arbitrary since it represents the threshold of object detection in the images. Evaluating human detection of objects is more complicated than CNR analysis and intra- and interhuman observer variability can result in a range of CNR threshold values. However, empirical observations indicate human detection thresholds are reasonably well approximated with , which is the value used in the current analysis.15 Fig. 2Calculated CNR ratio for a range of object diameters and contrast levels. In this case, the object is near the test field center ( from the center of a phantom). In this analysis, objects that are reconstructed with a CNR value below 3.0 are thought to be undetectable by human perception, illustrating that there are regions of size and contrast that are not feasible to image with the algorithm. 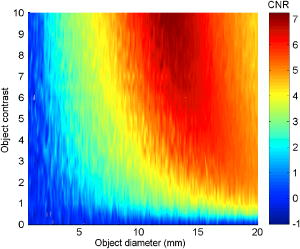 The contrast-detail results for a threshold limit of are plotted in Fig. 3 for the two test fields and object positions. Objects that are recovered with greater than have contrast-detail characteristics that are above and to the right of the line shown in Fig. 3, while those below and to the left are too small or have too little contrast to be recovered with in the image. Accordingly, the limiting diameter for an object near the edge of the field is approximately for both test field diameters. There seems to be little influence of test field diameter on CNR limits for high-contrast objects near the edge. Above an object contrast of about 8, the continued decrease in the minimum size for is very small with increasing contrast, indicating that this size is a fundamental limit of the imaging algorithm for this geometry. It does not appear that the fundamental limits have been reached for objects near the center of either test field for the contrast range studied and expected to be encountered experimentally. Furthermore, CNR value of objects near the center is strongly influenced by the test field size. For a test object, the limiting diameter is approximately , for the maximum object contrast (10). This increases to approximately for the larger test field. These results indicate the dramatic decrease in sensitivity for objects deeper in the test field. Fig. 3Contrast-detail curve showing the CNR of 3 to approximate limits of detectable contrast and diameter for two anomaly positions in (dashed lines) and (solid lines) diameter test fields. In this analysis, objects above and to the right of each line are in the region where and “detection” is considered possible.  The horizontal asymptotes of these lines represent the SNR limitations of the imaging system. These correspond to the low-contrast large-detail portion of the curve where small changes in contrast result in large changes in the diameter for the threshold. For objects near the phantom edge, the minimum contrast for is less than 0.5, though this limit is reached for smaller object sizes in the test field, indicating slightly better imaging performance. This same contrast limit applies to objects near the center of the smaller test field, though again, it is not reached until the object diameter is larger than on the edge. Due to the poor sensitivity to objects in the center of the test field, SNR limits are outside of the test range. The SNR limits determined in this study will likely vary with the noise level in the system. In addition to fundamental limits of the imaging system, the contrast-detail curve provides information on the trade-off between object size and contrast. This “transition” zone lies between the vertical (spatial-resolution-limited) and horizontal (SNR-limited) asymptotes and defines system imaging performance for objects mostly likely to be encountered experimentally. Algorithms based on the photon migration equation are considered to be more sensitive closer to the source/detectors and this nonlinear sensitivity is manifested as a nonuniform image response across the field of view. The contrast-detail curves shown in Fig. 3 demonstrate the significance of this effect. For the smaller test field, the minimum object diameter for the best-case high-contrast regime differs by 150% between an object at the edge and one centered in the test field. In a larger field, that difference increases to 360%. Thus, objects closer to the center will need to be larger in order to be detected. Further contrast-detail studies may be used to investigate image reconstruction parameters in addition to object position, such as adaptive meshing techniques16 and the effect of intrinsic optical properties. The results provide a best-case analysis for imaging tissue containing fluorophore in vivo with this algorithm. A number of factors will increase the contrast and size required to detect an anomaly in an experimental or clinical setting, thus shifting the contrast-detail curves up and to the right, including:
Contrast-detail analyses may also be used to track imaging performance as system improvements/adjustments are implemented. Future work will explore some of the factors expected to degrade performance in practice, especially cases where the intrinsic optical parameters are unknown. These analyses may also be used to compare reconstruction techniques now beginning to emerge within the research community, thus offering an efficient and systematic approach to intersystem comparison. AcknowledgementsThis work was funded by the National Institutes of Health grants RO1CA69544, RO1CA109558, and U54CA105480, as well as Department of Defense grant DAMD17-03-1-0405. ReferencesD. Y. Paithankar,
A. U. Chen,
B. W. Pogue,
M. S. Patterson, E. M. Sevick-Muraca,
“Imaging of fluorescent yeild and lifetime from multiply scattered light reemitted from random media,”
Appl. Opt., 36
(10), 2260
–2272
(1997). 0003-6935 Google Scholar
M. J. Eppstein,
D. J. Hawrysz,
A. Godavarty, and
E. M. Sevick-Muraca,
“Three-dimensional, Bayesian image reconstruction from sparse and noisy data sets: near-infrared fluorescence tomography,”
Proc. Natl. Acad. Sci. U.S.A., 99
(15), 9619
–9624
(2002). https://doi.org/10.1073/pnas.112217899 0027-8424 Google Scholar
J. Ripoll,
V. Ntziachristos,
J. P. Culver,
D. N. Pattanayak,
A. G. Yodh, and
M. Nieto-Vesperinas,
“Recovery of optical parameters in multiple-layered diffusive media: theory and experiments,”
J. Opt. Soc. Am. A Opt. Image Sci. Vis, 18
(4), 821
–830
(2001). 1084-7529 Google Scholar
A. B. Milstein,
O. Seungseok,
K. J. Webb,
C. A. Bouman,
Q. Zhang,
D. A. Boas, and
R. P. Millane,
“Fluorescence optical diffusion tomograhy,”
Appl. Opt., 42
(16), 3081
–3094
(2003). 0003-6935 Google Scholar
D. J. Hawrysz and
E. M. Sevick-Muraca,
“Developments toward diagnostic breast cancer imaging using near-infrared optical measurements and fluorescent contrast agents,”
Neoplasia, 2
(5), 388
–417
(2000). https://doi.org/10.1038/sj/neo/7900118 1522-8002 Google Scholar
V. Ntziachristos and
R. Weissleder,
“Experimental three-dimensional fluorescence reconstruction of diffuse media by use of a normalized Born approximation,”
Opt. Lett., 26
(12), 893
–895
(2001). 0146-9592 Google Scholar
V. Ntziachristos and
R. Weissleder,
“Charge-coupled-device based scanner for tomography of fluorescent near-infrared probes in turbid media,”
Med. Phys., 29
(5), 803
–809
(2002). https://doi.org/10.1118/1.1470209 0094-2405 Google Scholar
E. Graves,
J. Ripoll,
R. Weissleder, and
V. Ntziachristos,
“A submillimeter resolution fluorescence molecular imaging system for small animal imaging,”
Med. Phys., 30
(5), 901
–911
(2003). https://doi.org/10.1118/1.1568977 0094-2405 Google Scholar
R. Hendrick and
E. Berns,
“Optimizing mammographic techniques,”
RSNA Categorical Course in Breast Imaging, Google Scholar
G. Cohen,
“Contrast-detail-dose analysis of six different computed tomographic scanners,”
J. Comput. Assist. Tomogr., 3
(2), 197
–203
(1979). 0363-8715 Google Scholar
K. J. Robson,
C. J. Kotre, and
K. Faulkner,
“The use of a contrast-detail test object in the optimization of optical density in mammography,”
Br. J. Radiol., 68
(807), 277
–282
(1995). 0007-1285 Google Scholar
B. W. Pogue,
C. Willscher,
T. O. McBride,
U. L. Osterberg, and
K. D. Paulsen,
“Contrast-detail analysis for detection and characterization with near-infrared diffuse tomography,”
Med. Phys., 27
(12), 2693
–2700
(2000). https://doi.org/10.1118/1.1323984 0094-2405 Google Scholar
X. Song,
B. W. Pogue,
S. Jiang,
M. M. Doyley,
H. Dehghani,
T. D. Tosteson, and
K. D. Paulsen,
“Automated region detection based on the contrast-to-noise ratio in near-infrared tomography,”
Appl. Opt., 43
(5), 1053
–1062
(2004). https://doi.org/10.1364/AO.43.001053 0003-6935 Google Scholar
T. O. McBride,
B. W. Pogue,
S. Jiang,
U. L. Osterberg, and
K. D. Paulsen,
“A parallel-detection frequency-domain near-infrared tomograhy system for hemoglobin imaging of the breast in vivo,”
Rev. Sci. Instrum., 72
(3), 1817
–1824
(2001). https://doi.org/10.1063/1.1344180 0034-6748 Google Scholar
X. Song,
“Statistical analysis and evaluation of near infrared tomographic imaging system,”
Dartmouth College,
(2005). Google Scholar
A. Joshi,
B. Wolfgang, and
E. M. Sevick-Muraca,
“Adaptive finiter element based tomograpy for fluorescence optical imaging in tissue,”
Opt. Express, 12
(22), 5402
–5417
(2004). 1094-4087 Google Scholar
|


