|
|
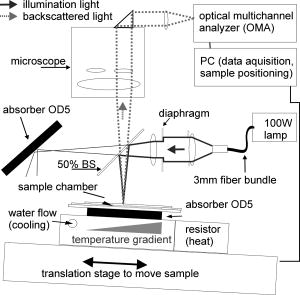
1.IntroductionTransformations of the organelles under conditions of cellular stress are known very little because of their small sizes and low optical contrast. Multiphoton imaging techniques1 can resolve subcellular structures but require staining to improve the contrast, which often affects cellular metabolism.2 Electron microscopy provides high resolution but is incompatible with imaging of live cells. Recently, light scattering spectroscopy3 (LSS) was introduced for noninvasive sizing of organelles in large populations of cells.4 The metabolic responses of cells to various stress factors are of great interest to biology and medicine and have been extensively studied. One of the best known responses of cells to stress is the expression of heat shock proteins5 (HSPs). The HSP expression after thermal stress is the metabolic reaction induced by misaggregation and denaturation of proteins, changes in membrane permeability, and disruption of cytoskeletal components.6 Initial expression of the heat shock factors7 (HSFs) regulates the HSP expression, which peaks several hours after the thermal shock.8 Several noninvasive techniques have been developed for monitoring cellular metabolism. They rely either on autofluorescence properties,9 on nonlinear optical polarization,10, 11 or on the scattering properties12, 13, 14, 15 of cells or organelles. Cellular organelles and cell boundaries scatter light with angular and spectral characteristics dependent on the sizes and relative refractive indices of the scattering particles. In general, there are two different approaches to characterize cells by their light scattering. First, the angular distribution of scattering intensity is measured with a goniometer at a fixed wavelength.16, 17, 18, 19 The challenge in this approach is that the signal intensity varies over 5 orders of magnitude, which necessitates the use of a lock-in amplifier. Angular scanning and lock-in techniques are time consuming—typical acquisition times are on the order of several minutes. The second approach, called LSS, measures the back-reflected scattering spectra under well-characterised angles, typically . The dynamic range of the spectral modulation is typically within one order of magnitude. The amount of reflected light, the integration time of the spectrometer, and its readout limit the acquisition time to typically several hundred milliseconds. Both the goniometer-based approach17, 19 and LSS (Refs. 3, 4) can extract information about sizes and density of the cellular organelles from the light-scattering data. This information can be used for noninvasive monitoring of the metabolic transformations in cells under any type of cellular stress. As we describe in this paper, the fast data acquisition of LSS enables us to monitor the cellular and subcellular metabolic effects in real time. Using LSS we studied the reaction of the retinal pigment epithelial (RPE) and NIH-3T3 cells to thermal stress. Motivation for this study comes from the fact that melanosomes within the RPE cells strongly absorb light,20 and thus the RPE is the hottest layer of cells during laser treatments of the retina.21 In retinal laser therapies involving prolonged heating, such as transpupillary thermal therapy,22 the temperature rise in the retina strongly varies from patient to patient due to variation in pigmentation and blood perfusion. Strong differences in temperature result in large variability and poor predictability of the clinical outcomes. A noninvasive on-line dosimetry method is highly desirable to improve this treatment modality. 2.Material and Methods2.1.SetupA sketch of the setup is shown in Fig. 1 . Light from a broadband halogen lamp was coupled into a 3-mm fiber bundle. The fiber tip was imaged 1:1 through a 50% beamsplitter (BS) onto a sample illuminating approximately 10,000 RPE cells within a 3-mm spot. The back-scattered light from the sample passing through the 50% BS was directed via an upright microscope (Leica, MZ16) into an optical multichannel analyzer (Ocean Optics, USB2000). A spectrum ranging from 350 to and containing 2048 points was typically acquired during . The sample chamber was placed on a black light absorbing glass (optical density 5) with glycerine as an index-matching material. To avoid specular reflections from the sample chamber, the whole mount was tilted off the optical axis by several degrees. The sample mount was heated on one side and cooled on the other side to produce a temperature gradient of about 10°C over a 10-cm distance across the sample. Temperature-time courses for different locations in the sample chamber were measured with a microthermocouple. To measure cellular responses at different temperature courses within the sample the whole mount was moved under the stationary optical setup using a stepper motor. The scattering spectra were acquired every . The setup was controlled by LabView on a PC. 2.2.Sample PreparationsTo verify precision in assessment of the sizes and concentrations of the light-scattering particles based on their scattering spectrum, a mixture of polystyrene (PS) beads (Polysciences) of 5 different sizes (291, 585, 737, 1053, and in diameter) was diluted in water at concentration ratio of 5:5:1:1:1, respectively. The light-scattering spectrum was measured and the data were analyzed by the inverse light-scattering fitting algorithm (see Sec. 2(C)). For spectroscopic measurements the human RPE cell line ATCC and the NIH-3T3 cells were confluently grown on glass slides. The NIH-3T3 cells were transfected with a luciferus gene linked to HSP (Ref. 8). The HSP expression from these cells can be detected by imaging (IVIS, Xenogen Corp., Alameda, California, USA) the bioluminescence due to the luciferase activity. During the measurements, the cells were covered with phosphate-buffered solution to avoid light absorption within the colored cell medium, and the sample was covered with a cover slip. To study the reaction of organelles to thermal stress the sample slides were placed on a mount with a temperature gradient ranging from 40 to . The mount was heated for and then cooled to room temperature. The scattering spectra were measured at five locations on the slides corresponding to five different temperatures within this range. After the experiments, all cells were alive as indicated by the live/dead calceinAM and ethidium homodimer fluorescent assay.23 For histological study with transmission electron microscopy (TEM) the RPE cells were grown on a Mylar film. After fixation with 2.5% glutaraldehyde/1% paraformaldehyde, embedding in LX-112, and staining in uranyl acetate/lead citrate, the 200-nm-thick sections were examined under TEM. The distribution of sizes of different organelles in the TEM photographs were analyzed using the ImageJ software.24 2.3.Inverse Light-Scattering Fitting AlgorithmIn a single scattering approximation, the scatterer size density distributions were extracted from the measured scattering spectra using the following Mie theory-based approach. If incident light is scattered by the particles of various diameters , the scattered light intensity can be expressed as an integral over all diameters: where is the intensity of the incident wave; is the apparatus constant of the system; is the delivery/collection angle of the system; is the scattering angle, which depends on the angles of incoming light , , and the angles of the scattered light and ; and and are diagonal elements of the scattering matrix at given wavelength and relative refractive index , where is the refractive index of the scatterer and is the refractive index of the surrounding medium. The elements of the scattering matrix are calculated using Mie theory.25Equation 1 relates the intensity spectrum of scattered light to the scattering amplitudes and . In backscattering direction, the spectrum of a submicrometer particle with the relative refractive index close to unity has unique modulations, which depend on the scatterer diameter and scales proportionally to . The light scattering spectra of particles smaller than are featureless, and Mie theory approximates to a classical Rayleigh scattering.26 The scatterer size density distribution for sizes larger than can thus be extracted by fitting27 the predictions of the model to the measured scattering spectrum. We developed such automated inversion procedure, which extracts the size density histogram of the scatterers that best fit the measured light scattering spectrum.4 The relative refractive index of subcellular organelles used for these calculations28 was , and for the PS beads, . The code is written in Fortran and runs reasonably fast on a conventional PC (Pentium, , Windows). 3.Results3.1.Measurements on Polystyrene Bead MixturesTo verify precision in assessment of the sizes and relative scatterer concentrations the sample cuvette was filled with the PS beads mixture and the light scattering spectrum was measured [Fig. 2(a) ]. The histogram of sizes in the PS bead mixture was extracted from this spectrum [Fig. 2(b)] by the inverse light-scattering fitting algorithm. Scatterer density in the histogram represents a product of the (where is relative refractive index of the particle) and the number of scatterers.4 Fig. 2(a) Light-scattering spectra of a mixture of PS beads with five different sizes ranging from 300 nm to , and (b) bead size histogram extracted from the measured scattering spectra. Scatterer density in the histogram represents a product of the and the number of scatterers ( is the relative refractive index of the particle). Since the refractive index is the same for all beads, the plot represents the relative number of particles. The diamonds in (b) depict the real composition of the PS bead mixture. The bead sizes can be determined far below the optical resolution of a conventional microscope—down to . 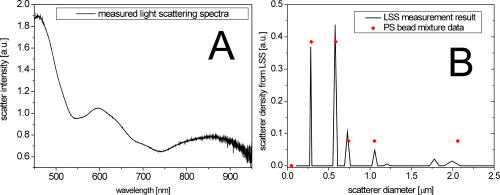 3.2.Sizing of Cellular OrganellesTo validate the LSS assessment of the sizes of cellular organelles, the light-scattering spectrum of RPE cells was measured at [Fig. 3(a) ], and the scatterer density histogram was extracted from this spectrum using the inverse light scattering algorithm (Sec. 2(C)). To make the results of LSS comparable to the size distribution observed in histological sections, the scatterer density histogram was converted into a histogram representing a statistical distribution of cross sections of organelles in the arbitrarily oriented sections of in thickness. The area under this transformed histogram was normalized to 1 [full circular symbols in Fig. 3(b)]. Fig. 3(a) Light-scattering spectrum of RPE cells and the spectrum fitted with the inverse light-scattering algorithm and (b) the maximum and minimum dimension of the different types of organelles was determined on histological sections ( thick) of RPE cells. The area under the organelle size histogram was normalized to 1 (hatched areas). The line with the circular symbols represents the data extracted from the light scattering spectrum. The histogram was transformed from a 3-D particle size distribution into a histogram of arbitrarily oriented slices of in thickness.  The maximum and minimum dimensions of the different organelles were determined in sections ( thickness) of RPE cells using ImageJ software. The resulting organelle size histogram was then normalized to an area of one [hatched area in Fig. 3(b)]. It is important to keep in mind that the conversion of the histograms from 3-D particles into a histogram of 2-D slices resulted in a slight shift of their maxima to smaller sizes. The actual sizes of the 3-D organelles peak at 170 and rather than 150 and , respectively. 3.3.Optical Detection of Cellular StressIn experiments with cells, the spectral changes appeared within after the onset of heating. The heat-induced changes in the scattering spectra [Fig. 4(a) ] were more pronounced in the long-wavelength region. The scatterer density histograms [Fig. 4(b)] extracted from the measured spectra [shown in Fig. 4(a)] demonstrate that the scattering density of the 170-nm mitochondria increased very significantly (up to 50%) and the distribution slightly shifts (up to ) toward the larger sizes. Fig. 4(a) Light-scattering spectra of the RPE cells at different moments of time under thermal stress of , where the temperature-induced spectral changes are more pronounced in the long-wavelength region, and (b) corresponding histograms of the scatterer density extracted from the spectra. Amplitude of the 160-nm peak in the histogram strongly increases during heating, while its position slightly shifts toward larger sizes. Increase in the amplitude represents the rise of the refractive index of the organelles probably due to the enhanced metabolic activity.  Figure 5(a) shows the time course of the maximum scattering density for different temperatures. The dashed line indicates the heating time course; in this case, for . The scattering density starts increasing at and exhibits strongest response at , reaching its maximum at about . After the heat is turned off, the scattering intensity does not decrease to its original value [Fig. 5(a)]. At a higher temperature, , the organelles react faster, reaching the peak at about , but after that the scattering density is decreasing. At , the scattering density increase is even smaller than at 45 and . Starting at temperatures of , the density peak shifts up to toward larger sizes [Fig. 5(b)] and the width of the distribution increases (not shown). Both of these effects become most pronounced at the highest temperature of . All cells were still viable immediately after the heating, as proved by the live/dead fluorescent assay.23 Fig. 5(a) Time course of the maximum scatterer density (i.e., relative refractive index) of the RPE organelles at different maximal temperatures. The temperature course of the point on the sample is plotted as a dashed line with the temperature scale on the right. A slight increase of the scattering density can be seen for , and it reaches its maximum at . The increase starts earlier at higher temperatures. Interestingly, at the increase in scattering density is less pronounced than at 47.5 and , indicating that metabolic response is suppressed. (b) Time course of the mitochondrial width at different maximal temperatures. The width increases with time by about at temperatures of 47.5 to .  The extracted scatterer density histograms of the NIH-3T3 cells were similar to the histograms obtained with the RPE cells [shown in Fig. 3(b)]. Figure 6(a) shows the temporal course of the scattering density at the 170-nm position of the peak. The time course of the actual temperature on a sample in a position corresponding to the maximal temperature of is shown as a dashed line. The NIH-3T3 cells respond differently than RPE cells: they start reacting at lower temperatures, , and have much slower rise of the scattering density reaching its maximum only by the end of the heating cycle, at for all the temperatures above . At higher temperatures (43 and ), they react a little faster, but as opposed to the RPE cells, for all temperatures the scattering density decreases by the end of the cooling phase. No size shift of the maximum scattering density or broadening of the size distribution was found with NIH-3T3 cells in the examined temperature range up to . Fig. 6(a) Time course of the scatterer density of the 170-nm organelles in the NIH-3T3 cells for different maximal temperatures. The time course of the point is plotted with a dashed line (temperature scale on the right). Significant increase of the scattering density starts at . The onset of this effect is earlier at higher temperatures. No significant changes of the scatterer sizes were observed at these temperatures. (b) Expression of HSP measured by light emission of luciferase after the exposure. The dots mark the areas with different temperatures where the scattering spectra were acquired. The HSP expression peaks at .  To compare our findings regarding response of organelles to thermal stress we studied expression of the HSP in the NIH-3T3 cells under the same experimental conditions. Figure 6(b) shows the light emission by the luciferase linked to HSP after heating. The peak of the HSP expression was observed at . 4.Discussion4.1.Assessment of Diameters and Concentrations of PS Beads in MixturePS beads are a commonly used model system for light-scattering experiments. Their optical properties and spherical shape is well defined and they can be purchased in sizes ranging from to hundreds of micrometers. Several authors describe the successful extraction of PS bead diameters using only one size at a time. In previous studies, either arbitrary chosen normal3, 4, 13 or a log-normal Gaussian19 size distribution were assumed to reduce the number of free parameters during the fit. In our experiments, we used a mixture of PS beads with sizes ranging from to up to , imitating the fact that cells contain organelles with a broad range of sizes. Therefore, we did not assume any specific type of size distribution in our inverse light-scattering code. Figure 2(b) demonstrates a good correspondence between the actual mixture composition (filled diamonds) and the size distribution (solid line) extracted from the scattering spectra shown in Fig. 2(a). It is remarkable that small particles are clearly resolved with this technique far beyond the optical resolution of a conventional light microscope. The extracted sizes of the beads correspond to actual sizes with precision of , except for one broadened peak in the proximity of . Scattering from the larger particles, which has the fastest spectral modulation, are optically suppressed in our cuvette: 0.43% of the transmitted light is reflected back from the bottom of the cuvette. To prevent specular reflection from entering the microscope objective the sample holder was slightly tilted. However, the forward scattering of this light in the sample is quite strong, especially for large particles, and it was collected into the spectrometer. The forward-scattering spectrum does not exhibit any significant spectral modulation, and this signal lowers the sensitivity of the technique for larger particles. This effect is reflected in nonprecise determination of the particle sizes around , as shown in Fig. 2(b). The precision of LSS in absolute measurement of sizes and its ability to monitor small relative changes are not the same. The absolute precision of sizing is defined as the deviation of the reconstructed size from the bead size data provided by a manufacturer. However, three types of the errors can affect this: the model-related error, the error of the size determination by the manufacturer, and the error related to the experimental SNR. Precision in detecting the relative size changes [e.g., Fig. 5(b)] should be much higher than the precision of absolute size determination since it is not affected only by the model-related error and depends only on the SNR. In fact, precision in determination of the relative change in organelle sizes is equal to the SNR. For 200-nm particles and a 100:1 SNR the relative accuracy will thus be around . 4.2.Assessment of Cellular Organelle Size DistributionThere is no “gold standard” technique for sizing of cellular organelles. In general, only TEM provides the necessary resolution, but it comes at a cost of complete disruption of the cellular metabolism due to fixation, embedding, and cutting. Some changes in organelle sizes and shape during fixation and embedding cannot be excluded. The peak around in Fig. 3(b) corresponds primarily to a of mitochondria, with sizes ranging from 90 to . The mean width of the mitochondria found in this study is slightly smaller than the reported in the literature.19 Other types of organelles such as multivesicular granules (polysomes, intermediate filaments, microtubules, secondary lysosomes29), membrane-bound granules (lysosomes29), and dense granules (phagosomes in the end-stage of hydrolic digestion29) are also found in the size range from 160 to with a peak around . The scatterer size distribution [filled dots in Fig. 3(b)] extracted from the scattering spectra also has two distinct peaks at 170 and . The good agreement between the extracted scatterer density histogram and the TEM analysis for cellular organelles, which generally are not spherical, supports the validity of the spherical approximation for this type of scatterers. A more complex modeling that can include different shapes, such as the T-Matix method,30 could lead to more precise results, but will also add some free parameters. In the past, we studied contributions of large organelles, such as cell nuclei3 and smaller, submicrometer organelles such as peroxisomes and lysosomes.4 In an intact biological cell, both large and small organelles contribute to the overall LSS spectrum. However, those contributions have distinct characteristics that make it relatively simple to analyze large and small organelles separately. The nucleus, being a larger particle, has a stronger oscillatory component in the LSS spectrum, which is preserved even after averaging over a large number of nuclei of different sizes present in the illuminated volume. Smaller organelles have a significantly smoother spectrum with no prominent oscillations present. The LSS scattering spectrum from epithelial cells in vivo 31 is dominated by a strong diffuse background coming from multiple scattering in the underlying tissue. This component can be removed to reveal features related to the cell nuclei. However, since it is rather difficult to differentiate the smooth spectrum generated by small organelles from the equally smooth diffuse background spectrum, both components are normally removed in the same procedure. In the individual cells on a glass slide, there is no diffuse background and contribution of the small organelles is much easier to observe. Thus, not only the nuclear sizes but also the sizes of the small organelles can be extracted. In this study, contributions from the nuclei are very small because of the particular geometry chosen for the measurements. The RPE and NIH-3T3 cells used in the experiments were confluently grown on a glass slide. The TEM photographs revealed that their height is only around , but the width is around 10 to . To prevent specular reflection from entering the microscope objective the sample was slightly tilted. This also drastically reduced the contribution from the “flat” surfaces of the nuclei, which have the same orientation as a glass slide. As a result, modulations with high spectral frequency produced by nuclei have very low intensity and can hardly be seen as a residual from our LSS fit in Fig. 3(a). At the same time, the reconstruction algorithm when applied to this residual reveals two peaks at around 1.5 and . 4.3.Detection of Cellular StressThe light scattering properties of cells are known to change during cell proliferation,17 apoptosis,14 toxic stress,32, 33 and osmotic shock.34 Using LSS, the subcellular origin and the specific organelles associated with these effects can now be identified and monitored in real time. As shown in Fig. 4(a), the spectral response for RPE cells is smooth and more pronounced at the longer wavelengths. The size histograms [Fig. 4(b)] extracted from these data show a strong increase in scattering density of the 170-nm organelles. The scatterer density represents a product of the (where is a relative refractive index of the particle) times the number of particles.4 Since organelles cannot multiply on such a short time scale, this increase in the scatterer density is due to the rise of the refractive indices of the organelles. This reaction can be associated with the histologically known “mitochondrial pyknosis,”35, 36 an increase in optical density of the mitochondria matrix37 due to the thermal stress. As shown in Fig. 5(a), the onset and the temporal behavior of this reaction can now be followed in real time. For RPE cells, the changes begin around and are strongest at . The earlier but lower response at 47.5 and probably indicate at suppressed metabolism at higher temperatures. In the NIH-3T3 cells [Fig. 6(a)], an increase of scattering density has already begun at , but these cells react much more slowly than RPE cells—the onset was delayed by 5 to , and similarly for RPE cells, it begins earlier at higher temperatures. The fact that these reactions do not follow the temperature history in the sample indicates that we observe the effects of cellular metabolic activity rather than just the temperature dependence of the refractive indices of the organelles. As shown in Fig. 6(b), the HSP expression on the heated sample slide peaked at the location heated to . An increase of the mitochondria scattering density in the same sample was found at . Thus, in addition to ability of detecting cellular stress noninvasively and in real time, the mitochondrial pyknosis seems to be an even earlier indicator than the expression of HSP. Figure 5(b) shows that swelling of the RPE mitochondria begins at . This effect corresponds to histological observations of the swelling of the mitochondrial matrix at the beginning of apoptosis,35 which is expected at these temperatures.38, 39, 40 5.ConclusionsThis paper demonstrated that LSS enables the noninvasive sizing of cellular organelles, and can be successfully used for rapid and noninvasive monitoring of the early subcellular transformations in living cells under thermal stress. With LSS, the subcellular origin and the specific organelles associated with these effects can now be identified and monitored in real time. This technique can be applied to organelles with dimensions down to , and opens doors to quantitative real-time assessment of the organelle reactions to various types of cellular stress without exogenous staining or labeling. An increase of mitochondrial scattering density with temperature (correlating with histological observation of “mitochondrial pyknosis”) begins below the temperatures corresponding to maximal expression of HSP, and can probably be used as an early indicator of thermal stress. Swelling of the mitochondria was found at temperatures above the HSP expression threshold, and can be associated with the onset of cellular apoptosis. Noninvasive monitoring of cellular stress with LSS can be used for a real-time dosimetry in a wide variety of medical applications that have no immediate observable outcome, such as transpupillary thermal therapy, photodynamic therapy, and electroporation. It might also be useful for environmental monitoring of toxins, drug screening, and others biotechnological purposes. Future studies must prove the specificity and sensitivity of this technique in each application. ReferencesS. W. Hell,
“Toward fluorescence nanoscopy,”
Nat. Biotechnol., 21
(11), 1347
–1355
(2003). https://doi.org/10.1038/nbt895 1087-0156 Google Scholar
W. T. Mason, Fluorescent and Luminescent Probes for Biological Activity,
(1999) Google Scholar
L. T. Perelman,
V. Backman,
M. Wallace,
G. Zonios,
R. Manoharan,
A. Nusrat,
S. Shields,
M. Seiler,
C. Lima,
T. Hamano,
I. Itzkan,
J. Van Dam,
J. M. Crawford, and
M. S. Feld,
“Observation of periodic fine structure in reflectance from biological tissue: a new technique for measuring nuclear size distribution,”
Phys. Rev. Lett., 80
(3), 627
–630
(1998). https://doi.org/10.1103/PhysRevLett.80.627 0031-9007 Google Scholar
H. Fang,
M. Ollero,
E. Vitkin,
L. M. Kimerer,
P. B. Cipolloni,
M. M. Zaman,
S. D. Freedman,
I. J. Bigio,
I. Itzkan,
E. B. Hanlon, and
L. T. Perelman,
“Noninvasive sizing of subcellular organelles with light scattering spectroscopy,”
IEEE J. Sel. Top. Quantum Electron., 9
(2), 267
–276
(2003). 1077-260X Google Scholar
J. G. Kiang, and
G. C. Tsokos,
“Heat shock protein 70 kDa: molecular biology, biochemistry, and physiology,”
Pharmacol. Ther., 80
(2), 183
–201
(1998). https://doi.org/10.1016/S0163-7258(98)00028-X 0163-7258 Google Scholar
L. A. Sonna,
J. Fujita,
S. L. Gaffin, and
C. M. Lilly,
“Invited review: effects of heat and cold stress on mammalian gene expression,”
J. Appl. Physiol., 92
(4), 1725
–1742
(2002). 8750-7587 Google Scholar
L. Pirkkala,
P. Nykanen, and
L. Sistonen,
“Roles of the heat shock transcription factors in regulation of the heat shock response and beyond,”
FASEB J., 15
(7), 1118
–1131
(2001). https://doi.org/10.1096/fj00-0294rev 0892-6638 Google Scholar
C. E. O’Connell-Rodwell,
D. Shriver,
D. M. Simanovskii,
C. McClure,
Y. A. Cao,
W. Zhang,
M. H. Bachmann,
J. T. Beckham,
E. D. Jansen,
D. Palanker,
H. A. Schwettman, and
C. H. Contag,
“A genetic reporter of thermal stress defines physiologic zones over a defined temperature range,”
FASEB J., 18
(2), 264
–271
(2004). 0892-6638 Google Scholar
B. Chance,
“Mitochondrial NADH redox state, monitoring discovery and deployment in tissue,”
Methods Enzymol., 385 361
–370
(2004). 0076-6879 Google Scholar
P. J. Campagnola,
H. A. Clark,
W. A. Mohler,
A. Lewis, and
L. M. Loew,
“Second-harmonic imaging microscopy of living cells,”
J. Biomed. Opt., 6
(3), 277
–286
(2001). https://doi.org/10.1117/1.1383294 1083-3668 Google Scholar
J.- X. Cheng and
X. S. Xie,
“Coherent anti-stokes Raman scattering microscopy: instrumentation, theory, and applications,”
J. Phys. Chem. B, 108 827
–840
(2004). https://doi.org/10.1021/jp035693v 1089-5647 Google Scholar
E. Sobol,
A. Sviridov,
M. Kitai,
J. M. Gilligan,
N. H. Tolk, and
G. S. Edwards,
“Time-resolved, light scattering measurements of cartilage and cornea denaturation due to free electron laser radiation,”
J. Biomed. Opt., 8
(2), 216
–222
(2003). https://doi.org/10.1117/1.1559996 1083-3668 Google Scholar
V. Backman,
M. B. Wallace,
L. T. Perelman,
J. T. Arendt,
R. Gurjar,
M. G. Muller,
Q. Zhang,
G. Zonios,
E. Kline,
J. A. McGilligan,
S. Shapshay,
T. Valdez,
K. Badizadegan,
J. M. Crawford,
M. Fitzmaurice,
S. Kabani,
H. S. Levin,
M. Seiler,
R. R. Dasari,
I. Itzkan,
J. Van Dam,
M. S. Feld, and
T. McGillican,
“Detection of preinvasive cancer cells,”
Nature (London), 406
(6791), 35
–36
(2000). https://doi.org/10.1038/35017638 0028-0836 Google Scholar
Z. Shiffer,
N. Zurgil,
Y. Shafran, and
M. Deutsch,
“Analysis of laser scattering pattern as an early measure of apoptosis,”
Biochem. Biophys. Res. Commun., 289
(5), 1320
–1327
(2001). https://doi.org/10.1006/bbrc.2001.6127 0006-291X Google Scholar
N. N. Boustany,
R. Drezek, and
N. V. Thakor,
“Calcium-induced alterations in mitochondrial morphology quantified in situ with optical scatter imaging,”
Biophys. J., 83
(3), 1691
–1700
(2002). 0006-3495 Google Scholar
J. R. Mourant,
J. P. Freyer,
A. H. Hielscher,
A. A. Eick,
A. Shen, and
T. M. Johnson,
“Mechanisms of light scattering from biological cells relevant to noninvasive optical-tissue diagnostics,”
Appl. Opt., 37
(16), 3586
–3593
(1998). 0003-6935 Google Scholar
J. R. Mourant,
M. Canpolat,
C. Brocker,
O. Esponda-Ramos,
T. M. Johnson,
A. Matanock,
K. Stetter, and
J. P. Freyer,
“Light scattering from cells: the contribution of the nucleus and the effects of proliferative status,”
J. Biomed. Opt., 5
(2), 131
–137
(2000). https://doi.org/10.1117/1.429979 1083-3668 Google Scholar
J. R. Mourant,
T. M. Johnson,
V. Doddi, and
J. P. Freyer,
“Angular dependent light scattering from multicellular spheroids,”
J. Biomed. Opt., 7
(1), 93
–99
(2002). https://doi.org/10.1117/1.1427053 1083-3668 Google Scholar
J. D. Wilson,
C. E. Bigelow,
D. J. Calkins, and
T. H. Foster,
“Light scattering from intact cells reports oxidative-stress-induced mitochondrial swelling,”
Biophys. J., 88 2929
–2938
(2005). https://doi.org/10.1529/biophysj.104.054528 0006-3495 Google Scholar
“Macular Photocoagulation Study Group, “Laser photocoagulation of subfoveal recurrent neovascular lesions in age-related macular degeneration. Results of a randomized clinical trial,”
Arch. Ophthalmol. (Chicago), 109
(9), 1232
–1241
(1991). 0003-9950 Google Scholar
M. A. Mainster,
T. J. White,
J. H. Tips, and
P. W. Wilson,
“Retinal-temperature increases produced by intense light sources,”
J. Opt. Soc. Am., 60
(2), 264
–270
(1970). 0030-3941 Google Scholar
M. A. Mainster and
E. Reichel,
“Transpupillary thermotherapy for age-related macular degeneration: long-pulse photocoagulation, apoptosis, and heat shock proteins,”
Ophthalmic Surg. Lasers, 31
(5), 359
–373
(2000). 1082-3069 Google Scholar
Molecular Probes, “
(2001) Google Scholar
W. Rusband, Google Scholar
G. Mie,
“Beitraege zur Optik trueber Medien, speziell kolloidaler Metalloesungen,”
Ann. Phys., 29 377
–445
(1908). 0003-3804 Google Scholar
C. F. Bohren and
D. R. Huffman, Absorption and Scattering of Light by Small Particles,
(1998) Google Scholar
IMSL, “
(2003) Google Scholar
L. T. Perelman and
V. Backman, 675
–724
(2002) Google Scholar
M. Hogan,
J. A. Elvarado, and
J. E. Wedell, Histology of the Human Eye,
(1971) Google Scholar
M. I. Mishchenko,
L. D. Travis, and
D. W. Mackowski,
“T-matrix computations of light scattering by nonspherical particles: a review,”
J. Quant. Spectrosc. Radiat. Transf., 55
(5), 535
–575
(1996). https://doi.org/10.1016/0022-4073(96)00002-7 0022-4073 Google Scholar
V. Backman,
R. Gurjar,
K. Badizadegan,
I. Itzkan,
R. R. Dasari,
L. T. Perelman, and
M. S. Feld,
“Polarized light scattering spectroscopy for quantitative measurement of epithelial cellular structures in situ,”
IEEE J. Sel. Top. Quantum Electron., 5
(4), 1019
–1026
(1999). https://doi.org/10.1109/2944.796325 1077-260X Google Scholar
D. N. Georgieva,
N. Genov,
K. Hristov,
K. Dierks, and
C. Betzel,
“Interactions of the neurotoxin vipoxin in solution studied by dynamic light scattering,”
Biophys. J., 86
(1, Pt.1), 461
–466
(2004). 0006-3495 Google Scholar
B. V. Bronk,
Z. Z. Li, and
J. Czege,
“Polarized light scattering as a rapid and sensitive assay for metal toxicity to bacteria,”
J. Appl. Toxicol., 21
(2), 107
–113
(2001). https://doi.org/10.1002/jat.730 0260-437X Google Scholar
S. P. Srinivas,
J. A. Bonanno,
E. Lariviere,
D. Jans, and
W. Van Driessche,
“Measurement of rapid changes in cell volume by forward light scattering,”
Pfluegers Arch. Gesamte Physiol. Menschen Tiere, 447
(1), 97
–108
(2003). 0365-267X Google Scholar
S. Desagher and
J. C. Martinou,
“Mitochondria as the central control point of apoptosis,”
Trends Cell Biol., 10
(9), 369
–377
(2000). https://doi.org/10.1016/S0962-8924(00)01803-1 0962-8924 Google Scholar
C. R. Hackenbrock,
“Chemical and physical fixation of isolated mitochondria in low-energy and high-energy states,”
Proc. Natl. Acad. Sci. U.S.A., 61
(2), 598
–605
(1968). 0027-8424 Google Scholar
B. A. Scalettar,
J. R. Abney, and
C. R. Hackenbrock,
“Dynamics, structure, and function are coupled in the mitochondrial matrix,”
Proc. Natl. Acad. Sci. U.S.A., 88
(18), 8057
–8061
(1991). 0027-8424 Google Scholar
K. Li,
Y. Li,
J. M. Shelton,
J. A. Richardson,
E. Spencer,
Z. J. Chen,
X. Wang, and
R. S. Williams,
“Cytochrome c deficiency causes embryonic lethality and attenuates stress-induced apoptosis,”
Cell, 101
(4), 389
–399
(2000). https://doi.org/10.1016/S0092-8674(00)80849-1 0092-8674 Google Scholar
M. G. Vander Heiden,
N. S. Chandel,
P. T. Schumacker, and
C. B. Thompson,
“Bcl-xL prevents cell death following growth factor withdrawal by facilitating mitochondrial ATP/ADP exchange,”
Mol. Cell, 3
(2), 159
–167
(1999). https://doi.org/10.1016/S1097-2765(00)80307-X 1097-2765 Google Scholar
G. Kroemer,
“Mitochondrial control of apoptosis: an introduction,”
Biochem. Biophys. Res. Commun., 304
(3), 433
–435
(2003). 0006-291X Google Scholar
|