
|
|
1.Introduction to Optical TechniquesMagnetic resonance imaging (MRI) is well suited to measure the central nervous system (CNS), and it is widely used in evaluation of patients with CNS diseases as it provides greater sensitivity and specificity for the majority of CNS disease states in comparison to other radiological imaging modalities. It has established itself as an important clinical tool and the most common method in the diagnosis of CNS dysfunctions, such as stroke, inflammatory and degenerative diseases, and brain neoplasm, as well as in detection, characterization, and determination of tumor extent.1, 2 Near-infrared (NIR) spectroscopy and imaging, on the other hand, have been widely investigated for a variety of biomedical applications using the wavelength range of , where light scattering is more prominent than light absorption. The differences in light scattering properties between healthy and diseased tissues exist due to the possible changes in cellular and intracellular structures. NIR radiation offers the advantage of being nonionizing, and therefore, repeated doses can be given to the subject. Moreover, optical imaging instrumentation is inexpensive, robust, unobtrusive, and portable. Recently, optical methods have been used to detect both physiological and pathological conditions of tissue, including measurements for blood flow3 and hemoglobin concentration4 as well as for cancer diagnosis5, 6 and tissue distinction.7, 8, 9, 10 In particular, optical properties of human brain tissue measured in the NIR range have been reported for both ex vivo and in vivo data: van der Zee measured the reflectance of gray and white matter in postmortem neonatal and adult human brain tissue and showed that gray matter has a smaller scattering coefficient and larger absorption coefficient than white matter.11 Bevilacqua measured optical properties of brain tissue in children intraoperatively and reported that white matter has a greater scattering coefficient.12 Such differences in light scattering between gray and white matter have resulted in the development of a new optical reflectance methodology that can be used to differentiate white and gray matter in the human brain to guide functional neurosurgery intraoperatively.13, 14, 15 Moreover, the feasibility of using NIR for intraoperative monitoring of spinal cord oxygenation has been recently tested and discussed.16, 17 However, there has been no report on optical properties from the spinal cord of either animals or humans, measured either ex vivo or intraoperatively. The goals of this paper are (1) to report the measurement of reduced light scattering coefficient from the lumbar segment of the rat spinal cord surface intraoperatively using the fiber optic optical reflectance and (2) to demonstrate that differential light-scattering properties in the NIR region can also be used to differentiate healthy and diseased peripheral nerves. One potential application of this study is to utilize the light-scattering parameter as a biosignature for identifying demyelinated legions intraoperatively in the lumbar region of the spinal cord with a low-cost, portable, fiber optic reflectance system. Such a portable, miniaturized technique could be developed for minimally invasive localization of demyelinated legions along the spinal cord, particularly, for detection of certain characteristics of multiple sclerosis (MS) lesions in either animal models or humans in the near future. 2.Central Nervous System and Its Optical PropertiesIn a cross section, the spinal cord is made up of a piece of butterfly-shaped gray matter (Fig. 1 ) that is in the middle of the cord and is completely surrounded by white matter. Gray matter is comprised of nerve cell bodies, dendrites, short interneurons, glia, and large blood volume.18 It is divided into anterior and posterior horns, and the right and left are connected by the gray commissure. White matter is made up of bundles of mostly myelinated axons, which give white color and have less hemoglobin concentration than gray matter. Myelin increases light scattering, so white matter is expected to have a greater degree of scattering. The formation of gray matter in the spinal cord is H-shaped, as shown in Fig. 1. This shape remains the same throughout the cord, though there are regional variations in size and shape of gray and white matter. Fig. 1Cross-sectional view of the lumbar region of the spinal cord. The darker region is gray matter surrounded by the lighter region of white matter, and the diameter of this section of the spinal cord is around . Such formations are prominent throughout the spinal cord, though the conformations are different in each region. The bifurcated fiber optical probe contains two fibers and located above the spinal cord. Both the probe tip and the spinal cord surface were covered with mineral oil. The drawing is not to scale. 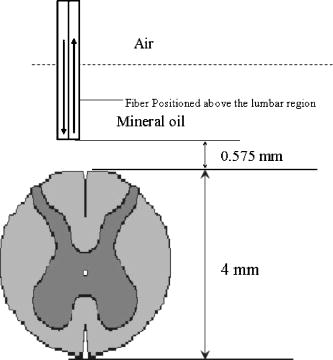 The peripheral nervous system consists of axons that receive sensory input and send motor output. Some peripheral nerves are purely sensory, while others are purely motor in nature. Depending on the location of their paths, most nerves have both components. For example, each segment of the lumbar spinal cord has a dorsal root and a ventral root on each side. A dorsal root receives somatosensory input from a certain area of the body part, whereas a ventral root will innervate certain groups of muscle. Shortly outside the spinal cord, the dorsal root and ventral root will merge to form the spinal nerve; thus, the spinal nerve has both sensory and motor components. Farther down to the periphery, several lumbar spinal nerves form the sciatic nerve. In Sprague-Dawley rats, it is found19, 20 that the sciatic nerve is composed of spinal nerves L4 to L6, while a further study showed that it was only L4 and L5 that made up the major part of the sciatic nerve, and that the contribution of L3 or L6 varied from rat to rat.21 Over the years, a large number of research activities on the spinal cord have been involved with the electrophysiological measurements using microelectrodes to explore fundamental neurophysiological mechanisms in the spinal cord.22, 23, 24 In spite of the advantages the microelectrode technique has, it provides neither a real time imaging map of the spinal cord intraoperatively nor information on the extent of spatial-temporal pattern of neural activity. Other research investigations on detection of neural activities using fluorescent dyes in vitro have been intensively performed and reported,25, 26, 27, 28, 29, 30 while the development in methodology of using optical imaging to detect neural activity in vivo becomes increasingly popular.31 In our study, we have performed our NIR reflectance measurements on both (1) the spinal cord and (2) sciatic nerves of rats. Because of these two regions of measurements, we organize the rest of paper to include two parallel subsections accordingly in each of Secs. 3, 4, 5, i.e., materials and methods, experimental results, and discussions. The spinal nerve is a nerve mixed with sensory and motor axons. Cell bodies of the sensory component are located in the dorsal root ganglion, whereas cell bodies of the motor component are located in the ventral horn of the spinal cord. Both are proximal to the ligation site of the spinal nerve. It is known that damage to the nerve (e.g., tight ligation) will induce axonal degeneration at the distal part because of lack of nutrition from the cell body, further leading to a loss of myelin. It is our hypothesis that either demyelination or degeneration of the axon will lead to a decrease in light scattering of the nerve. A part of this study is to prove our hypothesis and to demonstrate that differential values in the NIR region can be used to differentiate healthy and demyelinated peripheral nerves. Our recent study based on NIR spectral slopes with a large group of animals has been reported.32 3.Materials and Methods3.1.Materials and Methods for Spinal Cord Measurements3.1.1.Subjects and surgical methodsFourteen adult male Sprague-Dawley rats ( , University of Texas at Arlington vivarium) were used. They were initially administered with sodium pentobarbital [ , intra peritoneal (ip)]. The body temperature was continuously monitored at using a heating blanket with a control unit (Harvard Apparatus, Inc., Holliston, Massachusetts). Before preparing the animal for surgery, care was taken to ensure that all reflexes were eliminated. Tail pinches and eye-blinks were assessed. Laminectomy was performed to expose the thoracic and lumbar regions of the spinal cord. For the continuous supply of anesthetic during the course of the experiment, intrajugular canulation was performed. Tracheotomy was performed to allow artificial ventilation. After surgery, the rat was mounted on a stereotaxic frame. Mineral oil ( in height, Fig. 1) was used to prevent the drying of the exposed surface. The vital signs such as heart rate , respiration rate, and partial pressure of carbon dioxide were regularly monitored. During the entire course of study, care was taken to minimize animal suffering and to reduce the number of rats used. All the experiments have been conducted under the strict regulation of IACUC (Institution for Animal Care and Use Committee) of the University of Texas at Arlington and the guidelines of International Association for Study of Pain.33 3.1.2.Experimental setupThe optical reflectance experiments from the rat spinal cord were taken intraoperatively using a light source, a bifurcated fiber optic probe, a spectrometer and a laptop computer, as shown in Fig. 2 , in common with our previous work.10, 13, 15 The incident optical signal was generated by a tungsten-halogen light source (LS-1, Ocean Optics, Inc., Dunedin, Florida) and delivered to the tissue through the probe. The optical reflectance signals from the tissue were collected by the same probe and converted to electrical signals by a portable, real-time display spectrometer (USB 2000, Ocean Optics, Inc.) in the wavelength region of . The bifurcated probe contained two fibers, one acting as the source and the other as a detector, each with a diameter. The two fibers were placed adjacent to one another within a stainless steel probe. The optic fiber probe was placed near lumbar level 5 (LL5) region of the rat spinal cord, which was mounted on a stereotaxic frame to assure a firm position of the animal. With the help of a microdrive (Burleigh 6000 ULN Controller, Burleigh Instruments, New York) the probe was held at a height of above the exposed spinal cord surface, while the surface was covered with mineral oil ( in height, Fig. 1). Since the difference in refractive index between mineral oil and tissue is minimal, the specular reflection from the spinal cord surface could be insignificant. This height was chosen to optimize the reflectance signals.32 Because of the clearness of mineral oil, the height of would not generate any significant difference between the current study and the previous results obtained from Refs. 14, 34. Fig. 2Experimental setup to obtain data from both the spinal cord and sciatic nerves consists of two fibers separated by a distance of , a broadband light source, a universal serial bus (USB) CCD spectrometer, a stereotaxic frame to hold the rat with the probe focused on either the spinal cord or the sciatic nerve, and a laptop computer for data acquisition.  3.1.3.Data acquisition and analysisThe optical reflectance were recorded from three regions of the exposed rat spinal cord, i.e., left lumbar, right lumbar, and the blood vessel running near the center of the cord. From each region, the data were recorded at intervals rostrally starting from LL5. Data were taken at sampling rate with an integration time of for a period of at each point. The raw reflectance data were firstly converted to the spectral slope values between 700 and without calibration,10 followed by further processing to quantify the reduced scattering coefficient , using a calibrated spectrum taken from the standard reflectance (WS-1, Diffuse Reflectance Sample, Ocean Optics, Inc., Dunedin, Florida). The goals of this set of measurements were (1) to show a heterogeneous map of light scattering in the region of rat spinal cord and (2) to quantify values of the rat spinal cord. For purpose (1), an interpolated gray-scale map of the slope values was obtained using Matlab®. Specifically, the slope values at each point were firstly averaged over the sixty seconds, and then the adjoining points were interpolated to generate a smoothed image. For purpose (2), we utilized our newly developed algorithm14, 34 to determine values of the rat spinal cord based on the needle-probe reflectance readings. According to the algorithm, for a range of values between and refractive index , the relationship between and the measured reflectance data taken with a source-detector separation can be approximated by where is the measured reflectance, and is the intensity factor calibrated from the experiments. The unit of is inverse centimeters, and the unit of is the number of photons per unit area (i.e., number of photons per square centimeter). The absorption coefficient was not included in Eq. 1 as Monte Carlo simulations14, 34 showed negligible changes in reflectance for typical tissue values of in the NIR range. After performing multiple tissue-phantom experiments for empirical calibrations,14, 34 we have determined to be equal to 0.0034 and rewritten Eq. 1 aswhere denotes a wavelength within the range of .Notice that the constant term must be determined experimentally, and that Eq. 2 was obtained through the empirical calibration only for the specific probe used for the study. During the algorithm development, it was seen that there was large variation in values due to the small source-detector separations and their similarity to mean free paths. Our solution to this problem was to take 60 reflectance readings for at each point to reduce the noise. In statistical analysis, the slope and values are reported as error of mean. To show significant differences of at different spinal cord regions, we performed a paired test with a confidence level of 95%. 3.2.Materials and Methods for Sciatic Nerve Measurements3.2.1.Spinal nerve ligationWe used the modified spinal nerve ligation model35 to induce demyelination in the sciatic nerve. The difference between the model and our procedure is that we ligated the L4 spinal nerves and not L5 and L6. Demyelination and degeneration should occur following the spinal nerve ligation. On the day of ligation, the rats were anesthetized with isoflurane in 100% oxygen (3% induction, 2.25% maintenance). Before preparing the animal for surgery, care was taken to ensure that all reflexes (tail pinches and eye-blinks) were eliminated. A small cut was made unilaterally on the left side lateral to the L5 to L6 level lamina, and the spinal nerves L4 and L5 were exposed. The L4 spinal nerve was then tightly ligated using a 6-0 silk suture. The exposed area was then washed with antibacterial solution of Betadine, and the wound was stapled. After the surgery, the animal was kept in their habitual environment and maintained in the same conditions as during the preoperative period. More details on postoperative care can be found elsewhere.32 3.2.2.Subjects and surgical methodsFor this set of experiments, 28 adult male Sprague-Dawley rats ( , University of Texas at Arlington vivarium) were used. On the day of the experiment, i.e., 1, 4, 7, or after ligation, the rats were first anesthetized with sodium pentobarbital. All surgical procedures were the same as described in Sec. 3(A) except without laminectomy. The thigh region was dissected to expose of the sciatic nerve on both the left and right sides. After the experiment, the animals were euthanized. 3.2.3.Experimental setupAn experimental setup similar to the one for the spinal cord measurements was used for the sciatic nerve measurements. The optic fiber probe was placed on the distal region of the sciatic nerve of the rat mounted on the stereotaxic frame. The probe tip was held perpendicularly at a height of above the sciatic nerve (Fig. 1). 3.2.4.Data acquisitionThe measurements were taken on the left (ligated) and right (control) sciatic nerves: on each side, five readings were taken starting from the distal side. Similar to the procedures used for the spinal cord readings, the data were recorded for a period of at each point at sampling rate with integration time of . We quantified the slope values for relative comparison between ligated and control nerves, and the slope differences are reported as error of mean. In statistical analysis, to show the differences in light scattering between the ligated and control side, we performed a paired test with a confidence level of 95%. 4.Experimental Results4.1.Results from the Spinal Cord MeasurementsUsing the experimental protocols and data processing procedures, we generated gray-scale maps of the light scattering index, i.e., the slope values, of the spinal cord near left L5. Figure 3(A) shows one example of the maps: the darker regions on the map show lower scattering (with smaller slope values), while the lighter regions show more scattering. The region with lower slopes (0.34 to 0.67) at the center corresponds to a blood vessel; on the spinal cord per se, the slope values read between 1.12 and 3.02. Figure 3(B) shows the gray-level bar for the map. Furthermore, Fig. 4 shows a summarized map of the rat spinal cords taken from all slope values of the 14 rats, and this map has aspects similar to those explained for Fig. 3. The blood vessel region near the center shows a slope value of 0.4 to 0.6, while the rest of the mapped regions on either side of the central blood vessel have slope values ranging from 1.35 to 1.61. We performed several tests to study the light-scattering characteristics on the spinal cord. The left and right lumbar regions showed no significant difference in slope values , while a significant difference existed between the lumbar regions (both left and right) and the central area where the blood vessels were . Fig. 3(A) Spectral-slope map with its gray-scale bar (B) to show differences in spectral slope of the rat spinal cord. The dark region, representing lower slope values, at the center corresponds to the location of the blood vessels; the lighter regions, representing larger slope values, are the lumbar regions of the spinal cord. The example map is taken from a single rat in experiment 6. 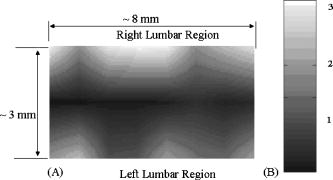 Fig. 4(A) Slope map with its gray-scale bar (B) to show the average values of slope taken from 14 rats.  The more meaningful and quantitative parameter to show tissue properties is the reduced scattering coefficient . Figure 5 shows a plot of values at from one rat, which are obtained using Eq. 2. Pooling the relative groups of data together leads to for the lumbar regions (left and right together since there is no significant difference between them) and for the central blood vessel region. If the data from the 14 rats are considered, we have obtained and for the lumbar regions and the central region containing the blood vessels, respectively. It is evident that the values of are much higher in the nervous regions than the blood vessels. Fig. 5Plot to show variation in values from the left, right, and central lumbar regions of the spinal cord. The values are computed at with the unit of inverse centimeters. The example map was obtained from a single rat in experiment 6. 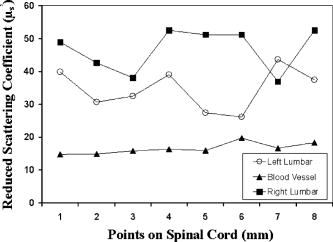 It is known10, 13 that the raw reflectance spectra of brain tissue between 700 and are nearly linear with the maximum located at . Thus, the spectral slopes of tissue reflectance have been used as an index to mark light scattering.13, 14, 15 Equation 1 also clearly indicates that the reflectance is highly correlated with . Figure 6(A) plots average values of map taken from the 14 rats. The similarity seen in Figs. 4(A), 6(A) demonstrates that the two indices, i.e., the slope and , can be used as a marker to differentiate levels of light scattering on the spinal cord. Similarly, a test shows that a significant difference in values exists only between the lumbar regions (both left and right) and the central blood vessel area . Fig. 6(A) A value map with its gray-scale bar (B) to show the average values of (in inverse centimeters) in the lumbar regions of the spinal cord, taken from 14 rats. We see that the map is similar to Fig. 4(A) obtained using slope values.  4.2.Results from the Sciatic Nerve MeasurementsIn this set of experiments, 28 rats were divided into four groups based on postoperative days after L4 ligation ( in each subgroup), i.e., days 1, 4, 7, and 14. For simplicity, we first used the slope values for relative comparison among the left (ligated) and right (control) groups. The slope values for the left sciatic nerve at postoperative days 1, 4, 7, and 14 are , , , and , respectively. The slope values for the right sciatic nerve at postoperative days 1, 4, 7, and 14 are , , , and , respectively. To show the differences in light scattering between the ligated and control side, we performed a paired test with a confidence level of 95%. This gives rise to the following conclusion, as shown in Fig. 7 : (1) there was no significant difference in slope readings between the left and right sciatic nerves on postoperative day one; (2) slopes of the left sciatic nerves were significantly lower than those of the right side on postoperative day 4 , day 7 , and day 14 ; (3) there were no statistical significant changes for the right sciatic nerves along the course of postoperative days; (4) significantly lower slope values of the left sciatic nerves were found on postoperative days 4, 7, and day 14 as comparing with day 1. Fig. 7Mean slope values are obtained on postoperative days 1, 4, 7, and 14 following left L5 spinal nerve ligation. The left sciatic nerves (ligated) show significantly smaller spectral slopes than the right sciatic nerve (control) on days 4, 7, and 14. For each subgroup, .  To be more quantitative, we quantified the values for the sciatic nerve measurements and found that the trend of changes due to ligation followed a similar pattern to the slope, as expected. The average values on the left side on postoperative days 1, 4, 7 and 14 were found to be , , , and , respectively, while the right side had average values of , , , and after postoperative days 1, 4, 7, and 14, respectively (Fig. 8 ). No significant difference in was found between the left and right on postoperative day 1, but values of the left sciatic nerves were all significantly lower than those of the right side on postoperative days 4, 7, and 14. 5.DiscussionThe primary goal of this study was (1) to quantify the reduced scattering coefficient, , of the rat spinal cord intraoperatively and (2) to determine if the optical reflectance and the values could be used to differentiate healthy and demyelined nerves connected directly to the rat spinal cord. We discuss the two kinds of measurements separately first, followed by a joint discussion to address common issues and future work. 5.1.Discussion of the Spinal Cord MeasurementThe results from the spinal cord measurements showed that the quantified values are most likely in a range of in the lumbar regions and near the blood vessels at the center of rat spinal cord. Such differences in values are expected due to the variations of anatomical and hemophysological structures around the spinal cord. Larger scattering signals detected on the lumbar regions of the spinal cord are an indication of the abundance of white matter present in those regions. It has been shown that the values of gray and white matter in the human brain are in the range of and , respectively,14 while for the rat brain the values36 range from . Thus, the results of the rat spinal cord reported here are consistent with the previous finding for the rat brain. There have been a large number of studies using NIR spectroscopy on the assessment of hemoglobin and other chromophore concentrations. Such studies can be mostly benefited if the corresponding values are known. Since the optical measurements of tissues are strongly influenced by both light scattering and absorption, quantification of light scattering will help decouple light scattering from absorption, leading to better interpretation on the optical measurements of tissue and their physiological responses to various stimulations. To our knowledge, this paper is the first report on the light scattering parameters from the rat spinal cord and associated nerves. On the other hand, because of the limitation of fiber optic mapping, the spatial resolution of the scattering coefficient maps is low, lower than what we expected. A possible way to improve the spatial resolution of light scattering mapping is to utilize a CCD camera and to take reflectance images at multiple selected wavelengths. Then, the algorithm to obtain maps of the measured tissue has to be developed and validated accordingly. While we expect that our existing algorithm for the fiber optic probe could be modified and adapted for the CCD camera approach, we require further investigation to validate our expectation. 5.2.Discussion of the Sciatic Nerve MeasurementThe sciatic nerve measurements demonstrated that light scattering from the spinal nerves correlate well with the pathological changes, i.e., demyelination, following peripheral nerve injury. Light scattering in the sciatic nerve depends mainly on the presence or absence of myelin and some other components that might alter the degree of scattering. A higher slope or value shows more scattering due to the presence of myelin, and a lower slope or value results from the lack or decrease of myelin. It is known that damage to nerves (e.g., tight ligation and transection) will induce axonal degeneration at the distal part because of lack of nutritional supply from the cell body. Similarly, ligation and transection of the spinal nerve will lead to degenerative processes distal to the site of lesion. Although it is known that at after ligation, myelin breaks down, and at , there is a loss of axonal continuity,37, 38 we were unable to show such change by the NIR technique on postoperative day 1. We speculated that early inflammatory processes in the sciatic nerve would contribute to the discrepancy on day 1. However, significant changes in light scattering were found on postoperative days 4, 7, and 14, correlating well with the pathological changes. Moreover, the idea that variations in light scattering can be used to identify intraoperatively possible diseases of the spinal cord is novel, and our preliminary finding encourages further exploration in this direction. 5.3.Joint Discussion of Common IssuesA close look at the cross-sectional view of the lumbar region shows a larger H-shaped gray matter area compared to the thoracic spinal cord. A common question often asked is how deep into the white matter we are able to detect, or if we are able to reach gray matter by fiber optic reflectance measurement. To answer this question, we must address the “look-ahead distance” (LAD) for the probe used in the study. Our previous study has demonstrated that LAD is shown as a function of and is approximately around for the current probe15, 36, 39 with values in the range of . The diameter of segments of the lumbar region is about (Fig. 1), and the white matter that covers the dorsal horn is about thick. Taking these values into account, if light was to travel from the surface of the spinal cord∕nerve, it is possible that the fiber optic reflectance may reach gray matter. Variation highly depends on the local anatomy of the spinal cord and dorsal roots. We did not address this issue in this study, and further research could be conducted in this direction. Further inspection on the measured data reveals that there exists a certain variation in the data, which is one of the drawbacks of the technique. Imaging by point measurement in the spinal cord is highly variable as there is no standard measure to ensure the placement of the probe to be at the same point for all experiments. For the spinal cord, subject-to-subject variability could be attributed to various factors, such as anatomical variation of the spinal cord, position of dorsal roots when they enter the spinal cord, number and site of branching of the blood vessel, and slight body movement due to respiration. All these factors played a certain role in causing variability. For the sciatic nerve measurements, the variability could result from probe localization, animal body movements, tension of the sciatic nerve, and inhomogeneous demyelination. While we have not provided any histology support to our findings as it requires the use of trained personnel, our evidence of demyelination induced by ligation lies in the numerous published reports.37, 38, 40, 41 While numerous studies have focused on light-scattering properties of the brain, there is still a large discrepancy of light-scattering coefficients taken between in vivo and in vitro, particularly for values of white matter. Most common values of for the human brain reported through noninvasive, in vivo methods42, 43, 44 are within , whereas those of reported through in vitro measurements11, 45, 46, 47, 48 are in the range of . We attribute the reason of having such large disagreement to the following factors: (1) the noninvasive in vivo measurements using the photon migration approach actually include all the signals from the scalp, skull, and gray matter, resulting in a mean of optical properties of multilayers; and (2) in the case of invasive measurements, it is lack of validated algorithms to quantify when a limited tissue volume is measured with a limited source-detector separation. It was previously shown by our group that the values of gray and white matter in the human brain are in the range of and , respectively,14 while the values from the rat brain36 range from . The values of the rat spinal cord and sciatic nerves given in this paper are highly consistent with those reported values. The primary aim of this study was to investigate light scattering from the spinal nerves and to explore whether light reflectance can be used to detect nerve∕spinal cord demyelination. The NIR reflectance technique is minimally invasive, low-cost, and portable and it can be used in vivo without requirement of separating nerves and spinal cord from the surrounding tissue. Its potential applications may include (1) intraoperative identification of degenerated nerves before nerve grafting, helping locate the degenerated segment along the nerve and decide the length of nerve graft required, and (2) characterization of light scattering under external neuronal or neurological stimulations in vivo to gain insight into functional brain physiology. In summary, both spectral maps and the maps of the rat spinal cord have been generated with higher values in the lumbar regions and lower values at the center of cord near the blood vessels. Either the spectral slopes or the values could be used as a marker to indicate demyelination of the nerves. The results reported in this paper prove the usefulness of the technique, which may have a potential clinical application for minimally invasive, real-time, intraoperative monitoring of subjects suffering from demyelinating CNS diseases. For future work, this method could be utilized to measure scattering differences in the spinal cord when the animals are subject to peripheral nerve stimulations. AcknowledgementsThis work was supported by a Converging BiotechnologyCenter grant and the Research Enhancement Program at theUniversity of Texas at Arlington and PP0872 from NationalMultiple Sclerosis Society. ReferencesC. Rorden and
H. O. Karnath,
“Using human brain lesions to infer function: a relic from a past era in the fMRI age,”
Nat. Rev. Neurosci., 5
(10), 813
–819
(2004). 1471-003X Google Scholar
M. Symms,
H. R. Jager,
K. Schmierer, and
T. A. Yousry,
“A review of structural magnetic resonance neuroimaging,”
J. Neurol., Neurosurg. Psychiatry, 75
(9), 1235
–1244
(2004). https://doi.org/10.1136/jnnp.2003.032714 0022-3050 Google Scholar
A. D. Edwards,
C. Richardson,
P. van der Zee,
C. Elwell,
J. S. Wyatt,
M. Cope,
D. T. Delpy, and
E. O. R. Reynolds,
“Measurement of hemoglobin flow and blood flow by near-infrared spectroscopy,”
J. Appl. Phys., 75 1884
–1889
(1993). 0021-8979 Google Scholar
K. Isobe,
T. Kusaka,
Y. Fujikawa,
M. Kondo,
K. Kawada,
S. Yasuda,
S. Itoh,
K. Hirao, and
S. Onishi,
“Changes in cerebral hemoglobin concentration and oxygen saturation immediately after birth in the human neonate using full-spectrum near infrared spectroscopy,”
J. Biomed. Opt., 5 283
–286
(2000). https://doi.org/10.1117/1.429997 1083-3668 Google Scholar
J. R. Mourant,
I. J. Bigio,
J. Boyer,
R. L. Conn,
T. Johnson, T. Shimada,
“Spectroscopic diagnosis of bladder cancer with elastic light scattering,”
Lasers Surg. Med., 17 350
–357
(1995). 0196-8092 Google Scholar
J. R. Mourant,
A. H. Hielscher,
A. A. Eick,
T. M. Johnson, and
J. P. Freyer,
“Evidence of intrinsic differences in the light scattering properties of tumorigenic and nontumorigenic cells,”
Cancer, 84 366
–374
(1998). 0008-543X Google Scholar
G. Zonios,
L. T. Perelman,
V. Backman,
R. Manoharan,
M. Fitzmaurice,
J. Van Dam, and
M. S. Feld,
“Diffuse reflectance spectroscopy of human adenomatous colon polyps in vivo,”
Appl. Opt., 38
(31), 6628
–6637
(1999). 0003-6935 Google Scholar
J. R. Mourant,
I. J. Bigio,
J. Boyer,
T. M. Johnson,
J. Lacey,
A. G. Bohorhoush, and
M. Mellow,
“Elastic scattering spectroscopy as a diagnostic tool for differentiating pathologies in the gastrointestinal tract: preliminary testing,”
J. Biomed. Opt., 1
(2), 192
–199
(1996). 1083-3668 Google Scholar
A. M. K. Nilsson,
C. Sturesson,
D. L. Liu, and
S. Andersson-Engels,
“Changes in spectral shape of tissue optical properties in conjunction with laser-induced thermotherapy,”
Appl. Opt., 37
(7), 1256
–1267
(1998). 0003-6935 Google Scholar
M. Johns,
C. A. Giller, and
H. Liu,
“Computational and in vivo investigation of optical reflectance from human brain to assist neurosurgery,”
J. Biomed. Opt., 3
(4), 437
–445
(1998). https://doi.org/10.1117/1.429894 1083-3668 Google Scholar
P. van der Zee,
M. Essenpreis, and
D. T. Delpy,
“Optical properties of brain tissue,”
454
–465
(1993). Google Scholar
F. Bevilacqua,
D. Piguet,
P. Marquet,
J. D. Gross, and
B. J. Tromberg,
“In vivo local determination of tissue optical properties: applications to human brain,”
Appl. Opt., 38 4939
–4950
(1999). 0003-6935 Google Scholar
C. A. Giller,
M. Johns, and
H. Liu,
“Use of intracranial near-infrared probe for localization during stereotactic surgery for movement disorders: technical note,”
J. Neurosurg., 93 498
–505
(2000). 0022-3085 Google Scholar
M. Johns,
“Optical properties of living tissues determined in vivo using a thin fiber optic probe,”
University of Texas at Arlington,
(2003). Google Scholar
C. A. Giller,
H. Liu,
P. P. Gurnani,
S. Victor,
U. Yazdani, and
D. C. German,
“Validation of a near-infrared probe for detection of thin intracranial white matter structures,”
J. Neurosurg., 98 1299
–1306
(2003). 0022-3085 Google Scholar
T. Germon,
“Intraoperative monitoring with near-infrared spectroscopy (NIRS),”
Spine, 27
(24), 2850
–2852
(2002). https://doi.org/10.1097/00007632-200212150-00027 0362-2436 Google Scholar
A. J. Macnab,
R. E. Gagnon, and
F. A. Gagnon,
“Near infrared spectroscopy for intraoperative monitoring of the spinal cord,”
Spine, 27
(1), 17
–20
(2002). https://doi.org/10.1097/00007632-200201010-00007 0362-2436 Google Scholar
S. I. Fox, Human Physiology, 4th ed.Wm. C Brown Publishers, Dubuque, IA (1993). Google Scholar
J. B. Gelderd and
S. F. Chopin,
“The vertebral level of origin of spinal nerves in the rat,”
Anat. Rec., 118 45
–47
(1977). 0003-276X Google Scholar
R. Hebel and
M. W. Stromberg, Anatomy and Embryology of the Laboratory Rat, 182
–184
(1986) Google Scholar
F. Asato,
M. Butler,
H. Blomberg, and
T. Gordh,
“Variation in rat sciatic nerve anatomy: implications for a rat model of neuropathic pain,”
J. Peripher Nerv. Syst., 5 19
–21
(2000). 1085-9489 Google Scholar
F. Baldissera,
H. Hultborn, and
M. Illert,
“Integration in spinal neuronal systems,”
Handbook of Physiology: The Nervous System, 509
–595
(1981) Google Scholar
E. Marder and
C. Calbrese,
“Principles of rhythmic motor pattern generation,”
Physiol. Rev., 76 687
–717
(1996). 0031-9333 Google Scholar
E. P. Gardner,
J. H. Martin, and
T. M. Jessel,
“The bodily senses,”
Principles of Neural Science, 430
–450 4th ed.Mcgraw Hill, New York (2000). Google Scholar
Y. Tsau,
P. Wenner,
M. J. O’Donovan,
L. B. Cohen,
L. M. Loew, and
J. P. Wuskell,
“Dye screening and signal-to-noise ratio for retrogradely transported voltage dyes,”
J. Neurosci. Methods, 70 121
–129
(1996). https://doi.org/10.1016/S0165-0270(96)00109-4 0165-0270 Google Scholar
P. Wenner,
Y. Tsau,
L. B. Cohen,
M. J. O’Donovan, and
Y. Dan,
“Voltage-sensitive dye recording using retrogradely transported dye in the chicken spinal cord: Staining and signal characteristics,”
J. Neurosci. Methods, 70 111
–120
(1996). https://doi.org/10.1016/S0165-0270(96)00108-2 0165-0270 Google Scholar
K. Murase,
T. Saka,
T. Asai, and
H. Ikeda,
“Functional circuitry for the induction of prolonged excitation in the rat spinal dorsal horn,”
Eur. J. Neurosci., 11 3355
–3358
(1999). https://doi.org/10.1046/j.1460-9568.1999.00783.x 0953-816X Google Scholar
Y. Arai,
Y. Momose-Sato,
K. Sato, and
K. Kamino,
“Optical mapping of neural network activity in chick spinal cord at an intermediate stage of embryonic development,”
J. Neurophysiol., 81 1889
–1902
(1999). 0022-3077 Google Scholar
H. Mochida,
K. Sato,
Y. Arai,
S. Sasaki,
K. Kamino, and
Y. Momose-Sato,
“Optical imaging of spreading depolarization waves triggered by spinal nerve stimulation in the chick embryo: possible mechanisms for large-scale coactivation of the CNS,”
Eur. J. Neurosci., 14 809
–820
(2001). 0953-816X Google Scholar
H. Mochida,
K. Sato,
Y. Arai,
S. Sasaki,
I. Yazawa,
K. Kamino, and
Y. Momose-Sato,
“Multiple-site optical recording reveals embryonic organization of synaptic networks in the chick spinal cord,”
Eur. J. Neurosci., 13 1547
–1558
(2001). 0953-816X Google Scholar
S. Sasaki,
I. Yazawa,
N. Miyakawa,
H. Mochida,
K. Shinomiya, K. Kamino,
Y. Momose-Sato, and
K. Sato,
“Optical imaging of intrinsic signals induced by peripheral nerve stimulation in the in vivo rat spinal cord,”
Neuroimage, 17 1240
–1255
(2002). 1053-8119 Google Scholar
A. K. Senapati,
H. Radhakrishnan,
H. Liu, and
Y. B. Peng,
“Detection of degeneration in rat sciatic nerve by in vivo near infrared spectroscopy,”
Brain Res. Brain Res. Protoc, 14
(2), 119
–125
(2005). 1385-299X Google Scholar
M. Zimmermann,
“Ethical guidelines for investigations of experimental pain in conscious animals,”
Pain, 16 109
–110
(1983). 0304-3959 Google Scholar
M. Johns,
C. A. Giller,
D. C. German, and
H. Liu,
“Determination of reduced scattering coefficient of biological tissue from a needle-like probe,”
Opt. Express, 13
(13), 4828
–4842
(2005). 1094-4087 Google Scholar
S. H. Kim and
J. M. Chung,
“An experimental model for peripheral neuropathy produced by segmental spinal nerve ligation in the rat,”
Pain, 50
(3), 355
–363
(1992). 0304-3959 Google Scholar
P. P. Gurnani,
“Near infrared spectroscopic measurement of human and animal brain structures,”
University of Texas atArlington,
(2003). Google Scholar
L. Lubinska,
“Early course of Wallerian degeneration in myelinated fibres of the rat phrenic nerve,”
Brain Res., 130 47
–63
(1997). 0006-8993 Google Scholar
L. Lubinska,
“Patterns of Wallerian degeneration of myelinated fibres in short and long peripheral stumps and in isolated segments of rat phrenic nerve. Interpretation of the role of axoplasmic flow of the trophic factor,”
Brain Res., 233 227
–240
(1982). 0006-8993 Google Scholar
Z. Qian,
S. Victor,
Y. Gu,
C. A. Giller, and
H. Liu,
“‘Look ahead distance’ of a fiber probe used to assist neurosurgery: phantom and Monte Carlo study,”
Opt. Express, 11
(16), 1844
–1855
(2003). 1094-4087 Google Scholar
A. Clemence,
R. Mirsky, and
K. R. Jessen,
“Mon-myelin forming Schwann cells proliferate rapidly during Wallerian degeneration in the rat sciatic nerve,”
J. Neurocytol., 18 185
–192
(1989). 0300-4864 Google Scholar
J. C. Mira,
“Quantitative studies on the regeneration of myelinated nerve fibers. II. Variation on the number and size of regenerating nerve fibers after localized crushing or total section,”
Arch. Anat. Microsc. Morphol. Exp., 65 255
–284
(1976). 0003-9594 Google Scholar
Y. Fukui,
Y. Ajichi, and
E. Okada,
“Monte Carlo prediction of near-infrared light propagation in realistic adult and neonatal head models,”
Appl. Opt., 42
(16), 2881
–2887
(2003). 0003-6935 Google Scholar
D. M. Hueber,
M. A. Franceschini,
H. Y. Ma,
Q. Zhang,
J. R. Ballesteros,
S. Fantini,
D. Wallace,
V. Ntziachristos, and
B. Chance,
“Non-invasive and quantitative near-infrared haemoglobin spectrometry in the piglet brain during hypoxic stress, using a frequency-domain multidistance instrument,”
Phys. Med. Biol., 46 41
–62
(2001). https://doi.org/10.1088/0031-9155/46/1/304 0031-9155 Google Scholar
J. H. Choi,
M. Wolf,
V. Toronov,
U. Wolf,
C. Polzonetti,
D. Hueber,
L. P. Safonova,
R. Gupta,
A. Michalos,
W. Mantulin, and
E. Gratton,
“Noninvasive determination of the optical properties of adult brain: near-infrared spectroscopy approach,”
J. Biomed. Opt., 9
(1), 221
–229
(2004). https://doi.org/10.1117/1.1628242 1083-3668 Google Scholar
W. Cheong,
S. A. Prahl, and
A. J. Welch,
“A review of the optical properties of biological tissues,”
IEEE J. Quantum Electron., 26
(12), 2166
–2184
(1990). https://doi.org/10.1109/3.64354 0018-9197 Google Scholar
A. Taddeucci,
F. Martelli,
M. Barilli,
M. Ferrari, and
G. Zaccanti,
“Optical properties of brain tissue,”
J. Biomed. Opt., 1
(1), 117
–123
(1996). 1083-3668 Google Scholar
H. J. Schwarzmaier,
A. N. Yaroslavsky,
I. V. Yaroslavsky,
T. Goldbach,
T. Kahn,
F. Ulrich,
P. C. Schulze, and
R. Schober,
“Optical properties of native and coagulated human brain structures,”
Proc. SPIE, 2970 492
–499
(1997). 0277-786X Google Scholar
A. N. Yaroslavsky,
P. C. Schulze,
I. V. Yaroslavsky,
R. Schober, F. Ulrich, and
H. J. Schwarzmaier,
“Optical properties of selected native and coagulated human brain tissues in vitro in the visible and near infrared spectral range,”
Phys. Med. Biol., 47
(12), 2059
–2073
(2002). https://doi.org/10.1088/0031-9155/47/12/305 0031-9155 Google Scholar
|


