|
|
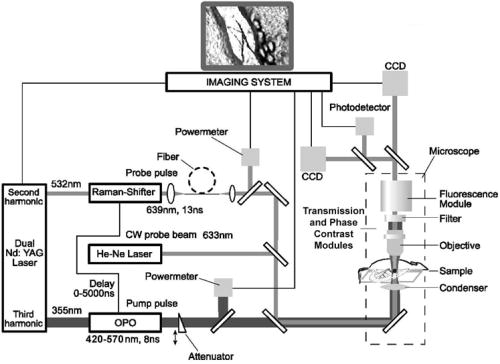
1.IntroductionThe detection and quantitation of single moving blood cells in vivo in their native state is potentially important for the early diagnosis of many diseases (e.g., cancer, diabetes, and cardiac diseases) and for the study of the influence of various factors (e.g., drugs, smoking, and radiation) on individual cells. This approach, however, has not yet been well established in vivo,1 although in vitro, on the technical platform of flow cytometry (FC), it has revolutionized many biological and medical studies.2, 3 With in vitro FC, cells move in flow at high speed (up to ) through an area irradiated with one or more focused laser beams. The forward and sideways scattering of fluorescent light in different spectral regions is recorded with several photodetectors. This technique is now in wide use in basic and clinical research, providing, among other applications, rapid analysis of large populations of cells, information about the relative sizes and shapes of cells, detection of rare cells, distinction of subpopulations of cells according to their properties, and evaluation of cell-drug interactions.2, 3 The potential adaptation of the principle of FC from in vitro to in vivo requires many precautions. On the one hand, cell velocity in blood and, especially, in lymph flow is much slower (from in blood microvessels to in large blood vessels of animals and humans4) than the maximum speed of analysis achieved in FC (see previous paragraph). Therefore, from this perspective, FC’s technical platform is easy to adapt to an in vivo setting. On the other hand, in vivo study may be limited by (1) poor optical conditions, such as scattering and absorption of laser radiation by the vessel wall and surrounding tissues (e.g., skin layers, connective tissue, muscles, fat, and other tissue components), compared with the ideal optical conditions in in vitro FC; (2) difficulties of noninvasively accessing deep vessels; (3) problems with the use of a transillumination optical scheme, which is more convenient for achieving high resolution; and (4) instability of blood and, especially, lymph flow parameters (e.g., fluctuation of cell velocity due to bifurcations, nonuniform vessel cross sections, etc.), compared with the well-controlled cell-flow parameters of in vitro FC. Additionally, (1) the shapes of the velocity profiles in venules and arterioles differ from the parabolic5 (i.e., are asymmetric); (2) the resistance to blood flow in living microvessels is higher than that in uniform tubes of the same diameters;6 and (3) the distribution of cells in flow depends on the flow velocity and the cell concentration.4, 7, 8 Nevertheless, as we show in the following, in selected blood vessels with a relatively fast flow velocity, flow is close to laminar, with most red blood cells (RBCs) concentrated near vessel axes with a mean centerline velocity 1.6 times higher than that of the mean blood flow9 (i.e., natural hydrodynamic focusing occurs in vivo as it does in in vitro FC). The first few attempts to develop in vivo FC in an animal model were relatively successful.10, 11, 12, 13 In particular, use of a confocal scheme with fluorescence detection enabled continuous monitoring of circulating labeled RBCs, white blood cells (WBCs), and cancer cells in the upper layer of blood microvessels in mouse ear skin.10, 11 Currently, the very powerful fluorescence labeling used in this work (as in many other in vitro FC platforms) is potentially subject to photobleaching effects and the escape of fluorescent indicators through diffusion. Moreover, growing evidence shows that fluorescence labeling may seriously distort genuine cell properties through unwanted indicator-cell or indicator-drug interactions.14, 15 This issue gains importance in in vivo studies in humans. In our alternative approach for in vivo FC, we used a photothermal (PT) technique without fluorescence labeling.12, 13 Indeed, PT imaging (PTI) has already demonstrated in vitro the capability of visualizing, at the living single-cell level, nonfluorescent absorbing cellular structures that are not visible by other techniques.16, 17 In addition, the PT technique has been able to characterize a liquid-flow profile (PT velocimetry) without the use of probes or scattering objects12 and to provide selective multispectral detection of moving absorbing compounds in capillary chromatography.18 In in vivo experiments in an animal model (rat mesentery), we demonstrated PTI’s capability, without laser scanning (with just one laser pulse) or conventional fluorescence labeling, to image (1) specific intracellular absorbing structures of circulating RBCs and WBCs in microlymphatic flow; (2) laser-induced thermal effects in blood flow at the single-RBC level; and (3) gold nanoparticles in lymphatic vessels as prospective models of both PT probes and sensitizers for the purpose of selective nanodiagnostics integrated with nanotherapeutics (e.g., selective nanophotothermolysis19) of metastatic cancer cells and bacteria in vivo.13, 20 In general, PTI of individual cells in vivo could be crucial to morphologic analysis and identification of different cells (most conventional in vitro FC platforms do not provide image analysis), although this technique is relatively sophisticated (e.g., requiring synchronization of the laser pulse with flow and a high-speed CCD camera), and significant memory storage is required to image even just a selected number of cells. For these reasons, we present here an adaptation of the simpler and potentially more rapid thermolens method (developed previously for studying single nonmoving cells in vitro19, 21) for detecting moving cells in vivo with guidance by transmission digital microscopy (TDM) and fluorescence microscopy. 2.Methods and Materials2.1.General Concept of Integrated in vivo FCThe concept of integrated multispectral in vivo FC developed in our laboratory combines the basic principles2, 3 of in vitro FC with recent attempts10, 11, 12, 13 at in vivo FC (Fig. 1 ). Cell detection occurs in superficial microvessels in the skin or in thin, relatively transparent living biostructures that enable the measurement of light transmitted through the vessels. To illuminate selected vessels, different optical sources are used, ranging from a conventional lamp with filters to lasers in pulsed or continuous-wave (cw) mode. One beam or several beams simultaneously from such a source are focused on a small area of microvessels (the analysis point). To detect all cells in a cross section of vessels, the laser beam diameter must cover whole vessels or at least illuminate a localized vessel area where most cells move in the flow stream (e.g., near the axis in high-speed blood flow, or in an area of lymphatic valves, which act as natural nozzle for the cells; see Fig. 1, bottom left). In some cases, to minimize simultaneous irradiation of several cells along the vessel axis, the beam has an elongated ellipsoidal shape produced with a cylindrical lens or slit as in conventional FC. The high-speed (up to ), highly sensitive CCD camera is used to visualize moving cells, together with the vessel’s structure, and to control the position of the laser beam in the vessel with the use of a reflection, transmission, or fluorescence (if appropriate) mode. Fig. 1Schematic of integrated multispectral FC in vivo combining PT, photoacoustic, transmission and fluorescent techniques. Bottom left, position of the laser beam in a lymph microvessel with a valve, which acts as a natural nozzle focusing flowing cells near the vessel’s center. 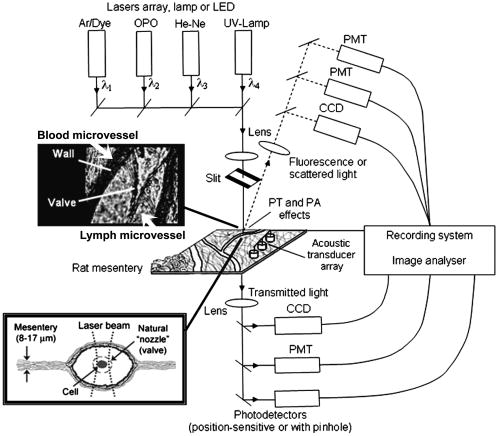 Optical absorption by nonfluorescent cellular structures is measured with PT and photoacoustic (PA) methods by the detection of absorbed energy transformed into heat and acoustic waves, respectively, through nonradiative relaxation.18 Specifically, we incorporated a PT deflection module with a position-sensitive photodetector to measure bioflow velocity (PT velocimetry12), a PT thermolens module to measure the integrated, time-resolved PT response19, 21 from moving cells, and a PTI module to image moving cells alone or with PT probes (e.g., gold nanoparticles conjugated with specific antibodies) in combination with thermolens22 and phase-contrast imaging.16, 17 Additionally, a PA transducer (PZT ceramic, sensitivity , diameter, bandwidth , produced by Dr. Karabutov), or transducer array, enables measurement of PA signals from single cells alone or with attached nanoparticles in flow, as well as measurement of PA signals from cells accumulated at specific sites (vessel wall, surrounding tissue, or specific organ) with a relatively broad laser beam and according to the principles of PA tomography.23, 24 Here, we focus rather on laser-based PT methods that provide imaging of single moving cells with the highest absorption sensitivity (threshold for the absorption coefficients of the order of ) and resolution . This is crucial for detecting WBCs, which have low absorption in the visible-spectral range compared with strongly absorbing RBCs.12, 16 This sensitivity threshold corresponds to temperature variations of in a cell at the laser energy range typically used for noninvasive mode.25 Thus, the temperature fluctuation is small enough not to damage cell structures,25 especially during the short time of irradiation while cells cross the illuminated area. Because PT methods are relatively new in biological studies, fluorescence techniques (widely used in conventional in vitro FC), together with TDM, are employed to verify PT data in the initial experimental stage by detecting labeled cells. In particular, we found that all these techniques may beneficially supplement each other and, in combination, may increase the capability of an integrated FC system. In most experiments, PT data were obtained for 100 to 500 cells over , depending on the flow rate (see the preceding), at a pump-pulse repetition rate of . The experiments were performed at least three times under similar conditions, and statistical data were calculated according to established procedures, including estimation of the photodamage threshold.25 2.2.Animal ModelAlthough the PT technique in some modifications has the potential to be used in reflectance mode, which is more suitable for in vivo studies, especially in human subjects, we demonstrate proof of the concept of PT flow cytometry (PTFC) in vivo in an animal model by the simpler transillumination mode, whereby parameters are detected with transmitted light. Furthermore, this mode makes it possible to achieve the best parameters for resolution and sensitivity, although, as mentioned earlier, it assumes the use of thin, relatively transparent living biostructures containing the required vessels. To date, such structures may be provided by several animal models: rabbit and mouse ear; bat’s wing; hamster dorsal skin-flap window or skinfold chamber; hamster cheek pouch; mouse with open cremaster muscle; and frog, rat, or mouse mesentery, among others.26, 27, 28, 29, 30, 31, 32, 33, 34, 35, 36, 37, 38, 39, 40, 41, 42 The preparation of such experimental models usually involves some minimally invasive procedures; therefore, some precaution must be taken to avoid altering the blood properties in such a model. For example, the use of mouse ear or bat’s wing26, 27 usually includes mechanical fixation and anesthesia. The main problems with dorsal skinfold chambers (skin-flap window) are the skin incision involving a partial vasotomy near the observation area, the poor contrast of single blood cells and blood capillaries, and the practical impossibility of observing lymphatics due to the multilayer vascular net within surrounding tissue.28, 29, 30 To overcome these problems, it is additionally necessary to label plasma (blood or lymph) or cells with different fluorescent dyes.29, 30, 31 These three models make it possible to observe the microvessels through two layers of skin (mouse ear), the epidermis (bat’s wing), or the dermis. Light scattering by skin, especially the epidermis (whose scattering coefficient is approximately two times higher than that of the dermis), leads to image degradation.43 This effect becomes a serious limitation for the analysis of single cells in flow, including measurement of their shape and subcellular structures at high magnification ( and with water immersion). Furthermore, sample thickness (e.g., skin thickness) sometimes does not allow high magnification due to the short focal distance of the micro-objective. In addition to fixation and anesthesia, the preparation of rabbit ear and hamster cheek pouch microvessels may include implantation of a transparent chamber (rabbit ear) or transaction of connective tissue32, 33, 34 (hamster cheek pouch). The implanted chamber in rabbit ear makes it possible to study only the microcirculation of reparative tissue.32 Blood microcirculation in hamster cheek pouch, which has only one microvessel layer, is very highly developed, although lymphatic systems are not developed.33, 34 The majority of lymph- and blood-microvessel studies have been performed on mesentery of different small animals36, 37, 38, 39, 40, 41, 42 (frog, mouse, and rat). Mesentery consists of thin, transparent, duplex connective tissue with a single layer of blood and well-developed lymph microvessels. Mesenteric microvessels are located between two layers of connective tissue that transition to microvessel adventitious membrane. Thus, an important advantage for high-resolution imaging of single cells with this model is that light is slightly attenuated only in the relatively thin vessel wall, without any influence from other tissues as in other models (Fig. 1). Furthermore, the refractive indices (and hence scattering phenomena) for mesenteric tissue are markedly lower ( for rat mesentery in vivo) than for skin ( for rat and for mouse) and, especially, for epidermis ( for humans) in the spectral range43, 44 of . Although some enhancement of the depth and contrast of optical images can be achieved with an optical clearing effect by the topical administration of an osmotically active agent (glycerol, glycerol-water solutions, glucose, propylene glycol, dimethyl sulfoxide), this procedure may lead to significant stasis and microvessel dilation in the area where the agent is administered.28, 45 Among mesenteric models of the microcirculation, rat mesentery seems to be the most suitable for our purposes, in contrast to the frog, a cold-blooded animal, and the mouse, whose very small size is a limiting factor. Low cost, reduced animal-to-animal variability, suitable size, and availability of several inbred strains and outbred stocks are some of the advantages of the rat model.46 Although preparation of the rat mesenteric model involves surgical procedures (abdominal incision and extraction of part of the intestine), the advantages of this model are more crucial for developing PTFC, and the procedures themselves are well established and developed.36, 37, 38, 39, 42 They include adequate anesthesia, a specially heated stage, superfusion of an adequate physiologic solution for warm-blooded animals, and a stabilization period after microsurgery to prevent stress. Careful monitoring of physiologic parameters of the rat mesentery (arterial blood cells, plasma protein, arterial and central venous blood pressure, heart rate, microvessel diameter, leukocyte rolling and adhesion, erythrocyte flow velocity, etc.) has shown that the microsurgery has no marked effect for at least , with some small changes not directly affecting blood cell properties becoming apparent42 after . Furthermore, in our study on the development of experimental chronic lymphedema (by the removal of lymph nodes), we periodically monitored some physiologic parameters of the rat mesentery (e.g., degree of edema, diameters of lymph and blood microvessels, indices of lymph flow, phasic contractions, and microlymphatic valve activity) at , , and after lymph-node removal.47 The observed changes were verified by comparison with the parameters in control animals (abdominal incision without node removal), in which no changes were noted, at least in the after microsurgery. Slight signs of aseptic inflammation leading to an increase in lymphatic diameter were observed in just one animal after . Consequently, existing mesentery-preparation procedures are not expected to have a practical effect on the properties of flowing cells. Rat mesentery (whose thickness in nonvascular and nonfat regions is44, 48, 49 ) thus represents a unique model for simultaneously studying cells in blood and lymph flow in vivo at the single-cell and even the subcellular levels with the highest optical resolution. Using video recording and estimating the displacement distance of cells and the corresponding traveling time, we found that the average flow velocity of lymphocytes in most intact microlymphatic vessels (with a diameter of ) was (range, ) with periodic oscillations (forward and backward flow). In contrast, the one-way velocity of RBCs in blood microvessels was significantly higher (up to ), although in capillaries, it may .4 White Fisher (F344) rats, weighing , were used in most experiments in accordance with the University of Arkansas for Medical Sciences protocol. Rats were narcotized with pentobarbital ( body weight, intramuscularly), and then a laparotomy was performed. After this procedure, the intestinal mesentery was exposed. The animal was placed on a heated underlay of the customized microscope stage with an optical window. To prevent drying, the exposed mesentery was continuously bathed with Ringer’s solution ( , pH 7.4). In selected experiments, we explored the capability of a mouse model using a dorsal skinfold chamber as a transient model for future study of human skin microcirculation. In particular, we compared the rat and mouse models on the basis of cell-image quality in the blood microvessels. 2.3.Experimental SetupThe scanning of a focused laser beam across a cell, as in confocal microscopy, is not quite suitable for detecting and imaging moving cells. This is because this scanning technique would require sophisticated, time-consuming processing algorithms1 (taking at least seconds, if not minutes) to accommodate even the relatively slow flow in capillaries as cells cross the area of detection in . To realize an integrated PTFC, we employed the principle of time-resolved, nonscanning PTI16, 17 using a recently described advanced experimental setup51 that we further modified and upgraded with the incorporation of a PT deflection module, a fluorescence module with a sensitive CCD camera (PixelFly, Cooke Corp.), high-speed photodetectors, a stabilized pilot laser, a high-resolution TDM module with a powerful objective [ ; numerical aperture (NA), 1.25], and accessories for in vivo studies (Fig. 2 ). Here, we focus more intently on the thermolens module, which in our opinion is crucial for realizing PTFC in vivo. Briefly, cells in vessels were irradiated with a short, focused pump laser pulse [tunable optical parametric oscillator (OPO): spectral tuning range, ; pulse width, ; pulse energy, ; Lotis Ltd., Minsk, Belarus]. Laser-induced temperature-dependent variations of the refractive index in the cells were detected by the thermolens technique with the use of an Olympus BX51 microscope. In this technique, a pump-laser-induced refractive heterogeneity (called a virtual thermolens52) caused a focusing or defocusing of a collinear cw stabilized He–Ne laser probe beam (model 117A; Spectra-Physics Inc.; wavelength, ; power, ) and hence a reduction in the beam’s intensity at its center as detected by a photodiode (C5658; Hamamatsu Corp.) supplied with a -diam pinhole, and recorded with a Tektronix TDS 3032B oscilloscope. This mode enabled recording the integral PT response simultaneously from several cells or from single cells and even from localized zones inside single cells, depending on the laser-beam diameter. The diameters of pump- and probe-beam spots with stable, Gaussian intensity profiles51 (controlled by a CCD camera: AE-260E; Apogee Inc.) in the sample plane were in the ranges of 15 to 50 and , respectively. The beam diameter could be adjusted by an axially moving condenser or a change of the micro-objective itself (with magnification values of , , , , and ). Because of the laser beams’ relatively broad sizes, resolution was determined by conventional diffraction-limited resolution of the microscope objective itself (e.g., at , NA 0.4; and at , NA 1.25). In selected experiments, we used additional optics to create a linear beam shape. Additionally, for multispectral studies, we were able to use first , second , and third harmonics of a pulsed Nd:YAG laser. TDM images with a conventional microscope lamp were recorded with three CCD cameras: a black-and-white Cohu 2122 (Cohu Inc., San Diego, California) and a color Nikon DXM1200 with speeds of up to 22 frames per second (fps) for imaging lymph flow, and a high-sensitivity CCD camera (PixelFly, Cooke Corp.) with a speed up to for imaging blood flow. Scion Image (Scion Corp., Frederick, Maryland), ACT-1 (Nikon), and CamWare (PCO Computer Optics, Kelheim, Germany) software packages were used to process, capture, measure, and edit images, as well as for analyzing the moving cells. Depending on the structures’ sizes, different magnifications were used to image relatively large whole lymphangions ( , , , and ), as well as single cells ( , , and ), in lymph and blood flow. In the current experiments, we focus on studying the capability of the integrated PTFC system in three modes (alone and in combination): TDM, thermolens, and fluorescent. TDM mode was used for general observation of mesenteric structures and blood and lymph microvessels (diameter, indices of phasic contraction, valve function, etc.), including measurement of the absolute velocity of lymphocytes in lymph flow by the video recording of cell movement. Furthermore, TDM made it possible to maneuver pump and probe beams within mesenteric structures, particularly enabling focusing of the beams in the central part of a vessel (or other parts, if necessary) and estimating cells’ shapes, sizes, and aggregation types, as well as, possibly, their interaction in flow. Thermolens mode was used to measure the PT responses from different moving cells and PT probes (e.g., gold nanoparticles13), compared with PT responses from other mesenteric microstructures (e.g., vessel walls, interstitial tissue). Fluorescence imaging with different labels (fluorescein isothiocyanate-dextran, Alexa 488, or FP-3056-2 fluorescence dye; Sigma-Aldrich, St. Louis, Missouri) was used in selected experiments to increase the contrast of blood vessels and to monitor WBCs, labeled cancer cells (MDA-MB-231 human breast carcinoma cells), and polystyrene beads (nail-red fluorescent particles; diameter, ; Spherotech Inc., Libertyville, Illinois). 3.Results and DiscussionTDM mode using different magnifications (4 to ) enabled the imaging of moving blood cells in mesenteric microvessels: RBCs in blood vessels (Fig. 3 , top, first), single platelets traveling through capillaries (Fig. 3, top, second), rare single WBCs in blood flow (Fig. 3, top, third), and rare RBCs in lymph microvessels (Fig. 3, middle). In particular, TDM’s high spatial resolution (up to at magnification with water immersion) made it possible to roughly estimate cell size and even shape, including continuous monitoring of RBC rotation during movement in lymph microvessels (Fig. 3, middle). We found, however, that the relatively low absorption sensitivity of TDM (due to the short optical path in thin structures) did not enable easy and rapid differentiation of cells with different absorption properties in the fast flow (e.g., rare moving WBCs in blood flow and RBCs in lymph flow). In contrast, using PT thermolens mode, we were able to realize many applications that were unachievable with TDM. Figure 3, bottom, shows a typical configuration and the positions of the laser beams in the rat mesentery. In most cases, when the distance between cells was larger than the laser beam diameter, we used a circular geometry for the laser beam (Fig. 3, bottom, first and second), although selected experiments were performed with an ellipsoidal beam configuration (Fig. 3, bottom, right), created by the use of an additional cylindrical lens and a slit in front of the microscope condenser. In this case, the size of the laser beam at the sample plane could be changed from , which was sufficient to cover most of the selected microvessels. Fig. 3Typical TDM images of rat mesentery with blood and lymph microvessels. Top row: first, RBCs in blood microvessels (magnification, ); second, platelets with RBCs in a blood capillary (magnification, ); third, rare leukocytes in blood microvessels (blood velocity, ; magnification, ). Middle row: rotation of RBC in lymph flow (magnification, ). Bottom row: typical position of a circular probe beam in a blood capillary (first; magnification, ), artery (second; magnification, ), and blood vessels with an ellipsoidal beam geometry (third; magnification, ).  We obtained integral PT responses from single moving RBCs and lymphocytes in lymph flow compared with PT responses from vessels and interstitial areas (no cells) at different pump laser energy levels (Figs. 4 and 5 ). At relatively low laser energy levels, the classic PT response was usually observed (Fig. 4, top; Fig. 5, top): a high initial peak, due to rapid heating of the cell, and a much lower exponential tail ( for RBCs with an average size of , for lymphocytes, and for platelets, not shown), corresponding to whole-cell cooling through heat diffusion into the surrounding plasma. The shapes of these responses were very similar to those obtained earlier in vitro,25 although the cooling times were a little shorter (of the order of 20%). This discrepancy can be explained by the additional influence of flow on the cooling rate12 (e.g., increased thermal diffusion). In the current experiments, the minimum rise time of the PT response was limited by the response time of the photodetector and the pump laser pulse duration . The PT-response amplitude increased with increases in the pulse energy level, until local temperature reached the evaporation threshold . At these energy levels, formation of a negative peak occurred, which indicated microbubble formation around localized absorbing cellular zones, as the refractive index inside the bubbles was much lower than that in the surrounding liquid and the temperature decreased during fast bubble expansion. After the initial expansion (rise time of the negative peak), the vapor rapidly cooled and condensed, and the bubbles collapsed (fall time of the negative peak). The lifetime of the bubbles, , depended on the size of the endogenous absorbing cellular structures and on the laser energy level. At a high energy level, several bubbles might arise, overlap, and merge with each other. In accord with our previous finding, bubble formation detected with the PT technique led to cell damage.19, 25 The photodamage threshold, the fluence energy dose that induced damage in 50% of irradiated cells (100 cells) [median effective dose ], was determined for blood cells in vivo with the use of analogous in vitro protocols.25 We found that these parameters for single RBCs and lymphocytes were and , respectively, at a laser wavelength of , which was a little higher for cells in vitro (2.3 and , respectively). This discrepancy can be explained by the different conditions of laser irradiation of cells in vitro and in vivo, as well as the slightly different cell sizes. Although additional, careful, independent verification is required because the transition from a linear to a nonlinear PT response occurred at a relatively broad range of pump pulse energy levels (depending on the cell type and the heterogeneity of the absorbing structures, among other factors), these experiments nevertheless demonstrate the ability of the PT technique for routine study of cell photodamage in vivo at the single-cell level. Fig. 4Typical linear (top) and nonlinear (middle, bottom) PT responses from slow-moving single RBCs in lymph flow in rat mesentery with coaxial configuration of pump and probe beams. Laser parameters: wavelength, ; pulse width, ; pump and probe beam diameters, 23 and , respectively. Laser energy/amplitude/time scale from top to bottom: ; ; and , respectively.  Fig. 5Typical PT responses from slow-moving single WBCs (lymphocyte) in lymph flow in rat mesentery with a coaxial geometry of pump and probe beams in linear (top) and nonlinear (second) modes. Linear PT response from lymph vessels alone without cells in the laser beam (third). Linear PT response from interstitial area (background noise) located close to lymph microvessel (fourth). Laser parameters: , ; pump and probe beam diameters, 23 and , respectively. Laser energy/amplitude/time scale from top to bottom: ; ; ; , respectively.  The cooling time of the PT response from vessels alone (no cells in the laser beam) or from the interstitium was a little longer (compared with the PT responses from cells) than can be explained by the heating of a more extensive area within the laser beam (Fig. 5). In addition, the polarity of the PT response in the case of the interstitium was “negative,” compared to “positive” for PT responses from cells and vessels, because the shape of the interstitium (and hence its virtual thermolens spatial configuration52) was close to platelike, compared to the cylinder- and spherelike shapes of small vessels and cells, respectively. The photodamage thresholds determined for interstitium and vessels wall were and (for a wavelength), respectively, which are higher than those for WBCs and, especially, RBCs (see earlier). These significant differences in photodamage thresholds make it possible to study cells in vivo under noninvasive conditions with the PT technique. These differences also provide the basis for indirect identification of the nature of the dominant absorbing targets. Cells were also identified by monitoring the cooling times of laser-heated cells because of the significant differences for RBCs and WBCs (see earlier). Thus, we found that the PT amplitude in linear, noninvasive mode (without photodamage) was approximately 30 to 50 times lower during irradiation of interstitial structures than during irradiation of single RBCs for the same laser energy level (compare Fig. 4, top, with oscilloscope images in Fig. 5, third and fourth). This finding could be explained by the low level of absorption by connective tissue and thin vessel walls. Surprisingly, even for lymphocytes, which have a low level of absorption in the visible spectral range (in contrast to RBCs), the corresponding difference in amplitude was lower ( to 6 times) than in vessels alone but still noticeable (Fig. 5, first, third, and fourth). Thus, high absorption contrast in cells and relatively lower background absorption by interstitial tissues and vessel walls (background noise), together with greater photodamage threshold for biotissue made it possible for us to use the PT technique to study primary blood cells in vivo and, in particular, to monitor the presence of RBCs in microlymphatics during pathologic processes. This is in line with our previous finding of the minor influence of absorption from vessels, which can be further reduced by the subtraction of this noise from useful PT signal, by the focusing of the laser beams, or by their proper positioning.13 In this study, a pathologic state was induced by mechanical injury of blood microvessels or by a relatively high pump pulse energy level that caused local blood vessel damage (Fig. 6 ). Fig. 6Position of the probe beam in microlymphatic flow with RBCs whose concentration was increased by laser-induced localized blood vessel damage (see hemorrhage around vessel wall): left: magnification, ; right: magnification, , water; immersion. (Different vessel zones are shown on left and right.) 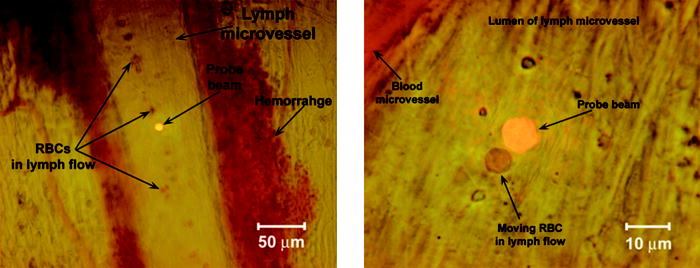 On the basis of our earlier experiments in vitro,12 we also estimated the capability of a new, noncontact, dual-beam PT method for the measurement of flow velocity in vivo. Briefly, a focused pump laser pulse produced a small heated zone in the blood or lymph flow through absorption. This zone, moving with the flow, was detected with a second probe beam located parallel to and some distance from the pump beam (Fig. 7 , top). Deflection of the probe beam as a result of temperature-dependent changes in the blood’s refractive index was recorded with a PT-deflection scheme (position-sensitive photodetectors) or the thermolens method (photodetectors with a pinhole). Both methods provided similar data. Flow velocity could be measured with these schemes by measuring (1) the width of the PT signal and (2) the time of flight of the heated zone between spatially separated pump and probe beams. Because of the very fast cooling times of laser-heated zones and the relatively low flow rates, we used a modification of the second method that involved an increased beam diameter up to (to increase the cooling time up to a few milliseconds) and a short distance between pump and probe beams when we were able to measure the time between pump pulse and maximum PT response (in flow PT velocimetry, it is derived from the original PT response; Fig. 7, bottom left and right). Local heating was produced in blood flow by the OPO laser (see earlier) at a wavelength of , at which significant absorption by RBCs occurs, while in lymph flow, with a much lower level of absorption in the visible spectral range, we used the first harmonic of an Nd:YAG pulsed laser (wavelength, ; pulse width, ). For example, Fig. 7, top, shows the positions of probe (red) and pump (green) beams on blood vessels. For illustration purposes, we increased the distance between the two beams to prevent their overlapping, although in many experiments they were closer to each other (in the range ). In the current case, we used relatively broad beams to irradiate many RBCs (100 to 150) within the laser beam volume, although in capillaries a single RBC or fluid between rare RBCs might be irradiated and heated, respectively. Figure 7, bottom, shows two PT responses for a coaxial (left) and a parallel (right) configuration of pump and probe beams with a distance between them of just . The blood velocity, determined by obtaining the time delay (around ) between pump pulse and maximum PT response (Fig. 7, bottom left), was approximately , which is consistent with known data.4 A similar experiment performed in lymph flow showed50 an average velocity of . Fig. 7Top: positions of probe and pump beams in a relatively large blood vessel (diameter, ). Bottom left: linear PT response from moving blood cells in vessels with a coaxial geometry of pump and probe beams (diameter, ). Right: linear PT response from moving blood (as derivative profile shown on left, velocity, ) with a parallel geometry of pump and probe beams obtained with time-of-flight technique. Laser pulse parameters: wavelength, ; pulse width, . Laser energy/amplitude/time scale/division: and , respectively.  This approach—PT velocimetry—has the potential for noninvasively (maximum temperature elevation, to ) characterizing flowing fluids at velocities ranging from and higher, with a potentially high spatial resolution of (depending on the focal size of the laser beam), without the probes or the scattering objects required by Doppler or speckle techniques.53 To our knowledge, this was the first demonstration of this technique for measuring blood and lymph flow in vivo. Finally, on the basis of the experiments that we have described, we realized continuous monitoring of moving blood cells with the PTFC system, analogous to in vitro FC. Figure 8 shows the typical PT-signal tracings from cells as a function of time during flow through an irradiated area. The PT signals with a “pure” positive component from RBCs in flow (Fig. 8, first) indicate a standard linear PT response from the cells at a low laser energy level similar to that seen in Fig. 4, top. Because of the short duration of each PT response , the responses were compressed during the recording because of the relatively slow flow rate, and appeared as vertical lines. The amplitude differences indicate differences in average absorption and reflect natural RBC heterogeneities. Low-amplitude PT signals or the absence of PT signals on the PT tracings (Fig. 8, first) from rare WBCs in blood flow indicate that an absorption by these cells is much lower than that by RBCs. Because of differences in the optical properties of normal and abnormal cells, we can assume that PTFC also has the potential to distinguish these cells without conventional cell labeling by the monitoring of the PT responses in FC mode. The second graph in Fig. 8 shows the area of RBC detection (just one cell during a observation) at a low laser energy level. Laser-induced injury of vessels led to a fast-growing number of RBCs in lymph flow (Fig. 8, third). The next graph shows that the PT signals from RBCs at a relatively high laser energy level leads to cell damage (Fig. 8, fourth). The presence of only a negative PT signal indicated the manifestation of strong, dominant nonlinear effects (bubble formation, see Fig. 4, middle) with a small positive amplitude. The presence of both positive and negative components in the PT signals (Fig. 8, fifth) indicated a noninvasive condition for WBCs (with a high photodamage threshold) and an invasive condition for RBCs (low photodamage threshold) at the same energy level. We used a relatively high laser energy level and a relatively slow oscilloscope rate to demonstrate the capability of PTFC to distinguish cells with different photodamage thresholds. Similar results were obtained during selective detection of cancer cells labeled with gold nanoparticles conjugated with antibodies, as described before.20 Fig. 8Typical traces of PT signal from blood cells in blood and lymph flow: RBCs in blood flow (first); rear RBC in lymph flow (second), normal conditions; growing number of RBCs in lymph flow during laser-induced hemorrhage (third); laser-induced damage of RBCs in lymph flow (fourth); and lymphocytes in lymph flow in linear and nonlinear PT modes (fifth). Laser parameters: wavelength, ; pulse width, . From top to bottom: laser energy/amplitude/time scale/division: ; ; ; ; and , respectively.  It is important to compare the capability of the new tool that we have described with that of conventional PT cytometry, which was developed for in vitro study of nonmoving single cells. The technical platform for conventional PT cytometry is microscopy, which enables great flexibility in choosing the regime of signal acquisition and simplifies cell manipulation. This approach seems to be reasonable at the initial development stage of a new PT technique. Indeed, the PT image or the integral PT response from one cell is obtained in after just one pump pulse with an width (Figs. 5 and 6) and a broad beam diameter covering entire cells. Thus, with this technique, called PT scanning cytometry, there is no necessity for time-consuming conventional scanning with a strongly focused laser beam across each cell. To obtain PT images and responses from different cells, however, the position of the laser beam’s center must be moved from cell to cell; the laser then irradiates the cell, and so on. Discrete changes in the position of the laser beam in PT microscopy take a short time ( for one mode) compared with that for conventional continuous laser scanning1 . PT analysis of many cells , however, may take from to hours, which is not convenient for routine study. Furthermore, the monitoring of both the PT image and the integral PT response from one cell, if necessary, takes at least (to switch from one mode to another). In PTFC, as we demonstrated in the preceding and elsewhere,13 these limitations have already been partly overcome. Currently, the PTFC rate of is limited by the repetition rate of the pump laser . Nevertheless, compared with the existing nonflow PT mode (which requires at least a few seconds to obtain one PT response from nonmoving single cells), PTFC is approximately 50 times faster. This capacity is enough to detect every nucleate WBC circulating in blood vessels at a typical rate of (for a flow velocity of ), as well as all cells in microlymphatic vessels, where flow velocity is slower. The detection efficiency (number of detected cells per total number of cells passing through the vessels) in small lymphatics and blood capillaries with an ellipsoidal beam shape and a beam diameter comparable with that of the vessels is expected to be close to 1, while for vessels with a larger diameter there is still a problem with obtaining a clear PT response from each individual cell. Simultaneous irradiation of several cells in the laser beam, however, is possible if rare cells with abnormally strong absorption (e.g., rare RBCs in microlymphatics or cancer cells labeled with PT probes19) are to be determined. The ultimate goal of detecting, without conventional labeling, circulating metastatic cancer cells at a desired threshold of cells requires further significant improvement in the PTFC speed of analysis and additional evidence that PTI can reliably discriminate cancer cells from normal cells. Under current conditions, which make it possible to study only slow flow, one cancer cell may appear in an irradiated area only once an hour. Nevertheless, a model for detecting circulating cancer cells labeled with PT probes (e.g., by injection into the blood stream or the localized primary tumor) at a relatively high threshold may be quite useful and realistic. We also tested the combination of the PT method with the PA and fluorescence methods, as well as other animal models (mouse skin). Although these studies are outside the scope of this paper, we provide here a few brief comments to emphasize the capability of PTFC. A preliminary estimation of the capability of the PA method (Fig. 1) with a customized acoustic transducer (Sec. 2(C)) to detect nonlabeled single RBC has shown its low sensitivity compared with that of PT methods ( times lower) and its inconvenience due to the necessity for mechanical contact of the transducer with the mesenteric tissue. Nevertheless, we believe that detection with the PA technique of metastatic cells labeled with gold nanoparticles may be a promising approach for monitoring their distribution in different tissues with a reasonable spatial resolution . Comparison of the capability of TDM (Figs. 3, 6, 7) and the fluorescence technique (Figs. 9, 10, 11 ) with that of standard fluorescent dyes for high-resolution imaging of single cells and guidance of PTFC has shown that both TDM and fluorescence techniques may provide similar results in some specific circumstances [e.g., imaging of moving RBCs (Fig. 9), labeled breast cancer cells (Fig. 10), beads, and WBCs (Fig. 11)] and supplement each other. The advantages of TDM are simplicity, no need for labels, and high resolution (up to ), although it is a transmission technique suitable only for selected animal models (e.g., rat mesentery). By contrast, the fluorescence technique is more universal and enables the use of reflectance mode, although fluorescent labeling may be harmful for some applications.14, 15, 54, 55 Using mouse skin with an optical chamber, we could not obtain high-resolution images of single cells in blood flow with either TDM or fluorescence techniques because of the relative thickness of the skin in this model. The use of glycerin as an immersion agent to reduce scattering effects improved the situation, but at the same time, significantly changed blood flow and cell parameters. According to our findings, the PT technique in combination with the rat mesentery animal model is the most promising system for obtaining high-resolution imaging of single cells in vivo as the basis for achieving our ultimate goal: high-resolution in vivo molecular imaging without labeling. Fig. 9Fluorescent image of blood flow (blood “traffic”) in mouse skin microvessels with visualization of single moving RBCs (as moving dark spots on a background of highly bright plasma). Image was obtained after injection of FITC-dextran into a mouse tail vein and by the use of an optical dorsal skinfold chamber and PixelFly CCD camera (magnification, ). 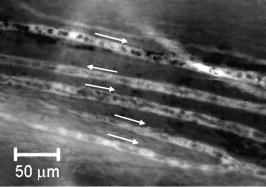 Fig. 10Fluorescent image of breast cancer cells (MDA-MB-231) labeled with Alexa 488 fluorescent dye in model experiments after the dye was topically applied on the blood vessels and the intestinal background (mouse dorsal skinfold model) (magnification, ). 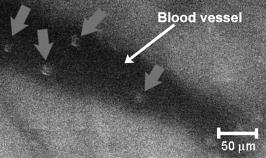 Fig. 11Fluorescent monitoring of moving polystyrene particles labeled by FP-3056-2 fluorescence dye (mean diameter, ) (left) and WBCs after intravenous injection of FITC-dextran (right) in blood flow of mouse skin microvessels (with the use of a dorsal skinfold chamber) (magnification: left, ; right, ).  Further development of integrated PTFC may include extending the spectral range from the visible spectral region to both the UV and the IR regions and the use of multispectral optical schemes. For example, this option may involve approaches that we have developed in the past, including fast spectral selection of different cells with a fast spectrum-scanning laser or with the simultaneous irradiation of cells with several laser beams at different wavelengths modulated with different frequencies (multiplex detection).18 4.ConclusionThe experimental data that we presented demonstrate that TDM and PT microscopy in one integrated system, with rat mesentery as an animal model, beneficially supplement each other in in vivo FC applications without conventional labeling, including increased (at least four orders of magnitude) absorption sensitivity and improved spatial resolution (up to ), as we demonstrated recently.13 These advantages clear the way for new potential applications such as the following:
With some modifications, this PTFC technique has the potential to be used in in vivo studies in humans. Noninvasive mode can be realized with thin structures transparent to light, such as eyelid or interdigital membrane, while an invasive approach might involve incorporation of a fiber-chip-based catheter in vessels or, by way of contrast, the use of a bypass whereby some amount of blood will pass through a capillary tube outside the body into the PTFC system. These approaches, however, must be very carefully verified first in an animal model. AcknowledgmentsThis work was performed at the University of Arkansas for Medical Sciences and supported by the National Institutes of Health under Grant No. EB001858 and in part by the National Science Foundation under Grant No. BES-0119470 and from the National Institute of Biomedical Imaging and Bioengineering under grant No. R01-EB-000873. The authors thank Dmitri O. Lapotko, PhD, for his help with the development of the PT microscope partly used after further modifications in this work; Scott Ferguson, for his assistance with developing the heated stage and laser measurements, and Jerry Ware, PhD, and Gal Safirstein, PhD, for providing the mouse model and assisting in related experiments. We also thank the Office of Grants and Scientific Publications at the University of Arkansas for Medical Sciences for editorial assistance during the preparation of this manuscript. ReferencesW. Rudolph and
M. Kempe,
“Trends in optical biomedical imaging,”
J. Mod. Opt., 44 1617
(1997). https://doi.org/10.1080/095003497152997 0950-0340 Google Scholar
R. Nunez,
“Flow cytometry: principles and instrumentation,”
Curr. Issues Mol. Biol., 3 39
–45
(2001). Google Scholar
A. L. Givan,
“Principles of flow cytometry: an overview,”
Methods Cell Biol., 63 19
–50
(2001). 0091-679X Google Scholar
Human Physiology, Springer-Verlag, Berlin Heidelberg (1989). Google Scholar
G. W. Schmid-Schoenbein and
B. W. Zweifach,
“RBC velocity profiles in arterioles and venules of the rabbit omentum,”
Microvasc. Res., 10 153
–164
(1975). 0026-2862 Google Scholar
T. W. Secomb,
“Mechanics of blood flow in the microcirculation,”
Symp. Soc. Exp. Biol., 49 305
–321
(1995). 0081-1386 Google Scholar
G. McHedlishvili and
N. Maeda,
“Blood flow structure related to red cell flow: determinant of blood fluidity in narrow microvessels,”
Jpn. J. Physiol., 51 19
–30
(2001). https://doi.org/10.2170/jjphysiol.51.19 0021-521X Google Scholar
M. C. Starr and
W. G. Frasher Jr.,
“In vivo cellular and plasma velocities in microvessels of the cat mesentery,”
Microvasc. Res., 10 102
–106
(1975). 0026-2862 Google Scholar
M. J. Davis,
“Determination of volumetric flow in capillary tubes using an optical Doppler velocimeter,”
Microvasc. Res., 34 223
–230
(1987). 0026-2862 Google Scholar
J. Novak,
I. Georgakoudi,
X. Wei,
A. Prossin, and
C. P. Lin,
“In vivo flow cytometer for real-time detection and quantification of circulating cells,”
Opt. Lett., 29 77
–79
(2004). https://doi.org/10.1364/OL.29.000077 0146-9592 Google Scholar
I. Georgakoudi,
N. Solban,
J. Novak,
W. L. Rice,
X. Wei,
T. Hasan, and
C. P. Lin,
“In vivo flow cytometry: a new method for enumerating circulating cancer cells,”
Cancer Res., 64 5044
–5047
(2004). https://doi.org/10.1158/0008-5472.CAN-04-1058 0008-5472 Google Scholar
V. P. Zharov,
E. I. Galanzha, and
V. V. Tuchin,
“Photothermal imaging of moving cells in lymph and blood flow in vivo,”
Proc. SPIE, 5320 185
–195
(2004). 0277-786X Google Scholar
V. P. Zharov,
E. I. Galanzha, and
V. V. Tuchin,
“Photothermal image flow cytometry in vivo,”
Opt. Lett., 30 628
–630
(2005). https://doi.org/10.1364/OL.30.000628 0146-9592 Google Scholar
J. Slavik, Fluorescence Microscopy and Fluorescent Probes, Plenum Press, New York, London (1996). Google Scholar
P. L. Johnson,
W. Smith, and
S. B. Knisley,
“Errors caused by combination of Di-4 ANEPPS and for measurements of transmembrane potentials and intracellular calcium,”
Ann. Biomed. Eng., 27 563
–571
(1999). https://doi.org/10.1114/1.198 0090-6964 Google Scholar
D. Lapotko,
G. Kuchinsky,
M. Potapnev, and
D. Pechkovsky,
“Photothermal image cytometry of human neutrophils,”
Cytometry, 24 198
(1996). https://doi.org/10.1002/(SICI)1097-0320(19960701)24:3<198::AID-CYTO2>3.0.CO;2-E 0196-4763 Google Scholar
D. Lapotko,
T. Romanovskaya, and
V. Zharov,
“Photothermal images of live cells in presence of drug,”
J. Biomed. Opt., 7 425
(2002). https://doi.org/10.1117/1.1481902 1083-3668 Google Scholar
V. P. Zharov,
“Laser optoacoustic spectroscopy in chromatography,”
Laser Analytical Spectrochemistry, 229
–271 1986). Google Scholar
V. P. Zharov,
V. Galitovsky, and
M. Viegas,
“Photothermal detection of local thermal effects during selective nanophotothermolysis,”
Appl. Phys. Lett., 83 4897
–4499
(2003). https://doi.org/10.1063/1.1632546 0003-6951 Google Scholar
V. P. Zharov,
E. Galitovskaya, and
M. Viegas,
“Photothermal guidance for selective photothermolysis with nanoparticles,”
Proc. SPIE, 5319 291
–300
(2004). 0277-786X Google Scholar
D. Lapotko,
G. Kuchinsky,
H. Antonishina, and
H. Scoromnik,
“Laser viability method for red blood cells state monitoring,”
Proc. SPIE, 2628 340
–348
(1996). 0277-786X Google Scholar
V. Zharov,
“Far-field photothermal microscopy beyond the diffraction limit,”
Opt. Lett., 28 1314
–1316
(2003). 0146-9592 Google Scholar
V. P. Zharov and
Y. O. Simanovsky,
“Optoacoustic tomography of pulse laser beams,”
J. Acoust., 35 556
–558
(1989). 0988-4319 Google Scholar
A. A. Oraevsky and
A. A. Karabutov,
“Optoacoustic tomography,”
Biomedical Photonics Handbook, 34-1
–34-34 CRC Press, Boca Raton, FL (2003). Google Scholar
D. O. Lapotko and
V. P. Zharov,
“Spectral evaluation of laser-induced cell damage with photothermal microscopy,”
Lasers Surg. Med., 36 22
–30
(2005). 0196-8092 Google Scholar
E. D. Rosen,
S. Raymond,
A. Zollman,
“Laser-induced noninvasive vascular injury models in mice generate platelet- and coagulation-dependent thrombi,”
Am. J. Pathol., 158 1613
–1622
(2001). 0002-9440 Google Scholar
J. L. Unthank and
R. D. Hogan,
“The effect of vasoactive agents on the contractions of the initial lymphatics of the bat’s wing,”
Blood Vessels, 24 31
–44
(1987). 0303-6847 Google Scholar
G. Vargas,
A. Readinger,
S. S. Dozier, and
A. J. Welch,
“Morphological changes in blood vessels produced by hyperosmotic agents and measured by optical coherence tomography,”
Photochem. Photobiol., 77 541
–549
(2003). https://doi.org/10.1562/0031-8655(2003)077<0541:MCIBVP>2.0.CO;2 0031-8655 Google Scholar
B. Endrich,
K. Asaishi,
A. Gotz, and
K. Messmer,
“Technical report—a new chamber technique for microvascular studies in unanesthetized hamsters,”
Res. Exp. Med., 177 125
–134
(1980). 0300-9130 Google Scholar
V. Schacht,
D. Berens von Rautenfeld, and
C. Abels,
“The lymphatic system in the dorsal skinfold chamber of the Syrian golden hamster in vivo,”
Arch. Dermatol. Res., 295 542
–548
(2004). 0340-3696 Google Scholar
S. Mordon,
S. Begu,
B. Buys,
C. Tourne-Peteilh, and
J. M. Devoisselle,
“Study of platelet behavior in vivo after endothelial stimulation with laser irradiation using fluorescence intravital videomicroscopy and PEGylated liposome staining,”
Microvasc. Res., 64 316
–325
(2002). 0026-2862 Google Scholar
T. Nakata,
K. Takada,
M. Komori,
A. Taguchi,
M. Fuiita, and
H. Suzuki,
“Effect of inhalation of nitrous oxide on rabbit ear chamber microvessels,”
In Vivo, 12 375
–378
(1998). 0258-851X Google Scholar
D. M. Gawlowski,
J. N. Benoit, and
H. J. Granger,
“Microvascular pressure and albumin extravasation after leukocyte activation in hamster cheek pouch,”
Am. J. Physiol., 264 H541
–H546
(1993). 0002-9513 Google Scholar
C. H. Bowen and
K. H. Albertine,
“Initial lymphatics are present in the loose areolar connective tissue of the golden hamster’s cheek pouch,”
Microvasc. Res., 35 236
–241
(1988). 0026-2862 Google Scholar
S. Baez,
“An open cremaster muscle preparation for the study of blood vessels by in vivo microscopy,”
Microvasc. Res., 5 384
–394
(1973). https://doi.org/10.1016/0026-2862(73)90054-X 0026-2862 Google Scholar
M. J. Sanz,
B. Johnston,
A. Issekutz, and
P. Kubes,
“Endothelin-1 causes P-selectin-dependent leukocyte rolling and adhesion within rat mesenteric microvessels,”
Am. J. Physiol., 277 H1823
–H1830
(1999). 0002-9513 Google Scholar
K. Ley,
G. Linnemann,
M. Meinen,
“Fucoidin, but not yeast polyphosphomannan PPME, inhibits leukocyte rolling in venules of the rat mesentery,”
Blood, 81 177
–185
(1993). 0006-4971 Google Scholar
J. N. Benoit,
“Relationship between lymphatic pump flow and total lymph flow in the small intestine,”
Am. J. Physiol., 261 H1970
–H1978
(1991). 0002-9513 Google Scholar
Y. Shirasawa,
F. Ikomi, and
T. Ohhashi,
“Physiological roles of endogenous nitric oxide in lymphatic pump activity of rat mesentery in vivo,”
Am. J. Physiol., 278 G551
–G556
(2000). 0002-9513 Google Scholar
E. Sekizuka,
C. Ohshio, and
H. Minamitani,
“Automatic analysis of moving images for the lymphocyte velocity measurement,”
Microcirculation Annual, 107
–108 1995). Google Scholar
N. Ono,
R. Mizuno,
H. Nojiri, and
T. Ohhashi,
“Development of an experimental apparatus for investigating lymphatic pumping activity of murine mesentery in vivo,”
Jpn. J. Physiol., 50 25
–31
(2000). https://doi.org/10.2170/jjphysiol.50.25 0021-521X Google Scholar
G. Horstick,
T. Kempf,
M. Lauterbach,
“Plastic foil technique attenuates inflammation in mesenteric intravital microscopy,”
J. Surg. Res., 94 28
–34
(2000). 0022-4804 Google Scholar
V. V. Tuchin, Tissue Optics: Light Scattering Methods and Instruments for Medical Diagnosis, 2000). Google Scholar
T. Gahm and
S. Witte,
“Measurement of the optical thickness of transparent tissue layers,”
J. Microsc., 141 101
–110
(1986). 0022-2720 Google Scholar
E. I. Galanzha,
V. V. Tuchin,
A. V. Solovieva,
T. V. Stepanova,
Q. Luo, and
H. Cheng,
“Skin backreflectance and microvascular system functioning at the action of osmotic agents,”
J. Phys. D, 36 1
–8
(2003). https://doi.org/10.1088/0022-3727/36/1/301 0022-3727 Google Scholar
L. Anzueto,
J. N. Benoit, and
D. N. Granger,
“A rat model for studying the intestinal circulation,”
Am. J. Physiol., 246 G56
–G61
(1984). 0002-9513 Google Scholar
E. I. Galanzha,
V. V. Tuchin,
P. Chowdhury, and
V. P. Zharov,
“Monitoring of small lymphatics function under different impact on animal model by integrated optical imaging,”
Proc. SPIE, 5474 204
–214
(2003). 0277-786X Google Scholar
B. J. Barber,
J. Oppenheimer,
D. C. Zawieja, and
H. A. Zimmermann,
“Variations in rat mesenteric tissue thickness due to microvasculature,”
Am. J. Physiol., 253 G549
–G556
(1987). 0002-9513 Google Scholar
R. Ghassemifar and
L. Franzen,
“A double-embedding technique for thin tissue membranes,”
Biotech. Histochem., 67 363
–366
(1992). 1052-0295 Google Scholar
E. I. Galanzha,
V. V. Tuchin,
V. P. Zharov,
A. V. Solovieva,
T. V. Stepanova, and
G. E. Brill,
“The diagnosis of lymph microcirculation on rat mesentery in vivo,”
Proc. SPIE, 4965 325
–333
(2003). 0277-786X Google Scholar
V. P. Zharov and
D. O. Lapotko,
“Photothermal imaging of nanoparticles and cells,”
IEEE J. Sel. Top. Quantum Electron., 11
(2005). 1077-260X Google Scholar
“The thermal lens in absorption spectroscopy,”
Ultrasensitive Laser Spectroscopy, 175
–232 Academic Press, New York (1983). Google Scholar
Z. Chen,
T. E. Milner,
S. Srinvas,
“Noninvasive imaging of in vivo blood flow velocity using optical Doppler tomography,”
Opt. Lett., 22 1119
–1121
(1997). https://doi.org/10.1023/A:1027365202328 0146-9592 Google Scholar
J. L. Zhang,
S. Yokoyama, and
T. Ohhashi,
“Inhibitory effects of fluorescein isothiocyanate photoactivation on lymphatic pump activity,”
Microvasc. Res., 54 99
–107
(1997). 0026-2862 Google Scholar
K. B. Abbitt,
G. E. Rainger, and
G. B. Nash,
“Effects of fluorescent dyes on selectin and integrin-mediated stages of adhesion and migration of flowing leukocytes,”
J. Immunol. Methods, 239 109
–119
(2000). 0022-1759 Google Scholar
|