
|
|
1.IntroductionHigh-throughput sequence (HTS) analysis, and drug discovery and development, as well as diagnostic tests in medicine, are generally performed with small sample volumes to reduce costs1, 2 and allow interfacing via parallel liquid handling with microstructured well systems. The microarray is one such well system that has become an important technological innovation for rapid parallel analysis in life science experiments and has great advantages.3, 4, 5 Although using microarrays can significantly reduce sample volumes ( per well or sample droplet),6 the sample concentration is often still in the range. However, in recognition of future demands to reduce costs and analysis time, this range is extensible to concentrations via detection of spectroscopically rare events. For the full potential of this approach to be realized, development of parallel fluorescence detection techniques capable of sensitive analysis in this regime is ineluctable. Using fluorescence cross-correlation spectroscopy (FCCS),7, 8, 9, 10 it is possible to quantify biomolecules of interest in the concentration range. A high signal-to-noise ratio and fine spatial resolution are both achieved by using a confocal microscope setup.11 Applying dual-color excitation, the specificity of biomolecule identification increases dramatically.10 However, although dual-color FCCS instruments are already commercially available from several suppliers (i.e., Evotec, Zeiss, and Olympus), and FCCS itself spans a broad field of applications, these instruments are limited to single-spot excitation and detection (thus prohibiting rapid analysis of dilute solutions). Additionally, measurements on a multitude of samples having low concentrations of slowly diffusing biomolecules are time consuming12 due to the single-spot limitation. Basically, such problems can be solved when analyzing samples in the sub-pM concentration range by compensating for low signal-to-noise ratios with longer measurement times.13, 14 This strategy should be avoided, if possible, for any HTS application (academic or industrial) in which longer measurement time increases costs or compromises the study of labile systems. We have previously illustrated how multiplexing parallel analysis could increase detection speed without sacrificing ultra-high sensitivity and high spatial resolution.15, 16, 17 In the first work, single dye-labeled nucleotides were analyzed in four separate microwells ( , ) simultaneously. For excitation, a diffractive optical (fan-out) element (DOE)15 was used. Later, a DOE was used16 and transport properties of dye-labeled nucleotides in a microfluidic system were monitored. Subsequently, we developed a novel complementary metal oxide semiconductors single-photon avalanche diode (CMOS-SPAD) array to achieve even higher integration and parallel detection capability.17 The success of our previous work on high-throughput single molecule detection encouraged us to embark on the present study of multifocal dual-color cross-correlation analysis. We present the development of a dual-color FCCS system with parallel DOE-generated laser excitation,15 parallel fluorescence detection, and multiplex capability, and we characterize its performance with respect to dynamical studies at the single-biomolecule level in liquid solutions. Three DOE-generated cross-correlation spots were investigated simultaneously. Hybridization products, simultaneously labeled with two fluorescent dye-labeled probes, were used as a test-case system for proof of concept. 2.Experimental DesignThe two (fan-out) DOEs were designed with an iterative fast Fourier-transform algorithm18 and fabricated by direct-write electron-beam lithography (JEOL, Tokyo, Japan, JBX-5DII) using an acceleration voltage of and an electron-beam current of . No compensation for the proximity effect was made. Resist (PMGI SF15) was spin coated onto a quartz substrate to a thickness of . Before exposure, a layer was evaporated on top of the resist to prevent charging of the resist layer during exposure. 64 different electron-dose levels were used, enabling a virtually continuous relief. After exposure, the layer was removed and the resist developed stepwise until the depth of each DOE corresponded to a phase modulation of for its intended wavelength (488-blue and 633-red ). The difference in intensity between the spot with maximum radiant intensity and the spot with minimum radiant intensity was, respectively, 2% for the blue and 3% for the red DOE. 70% of the incident laser light was found in the desired spots. Our experimental setup for parallel FCCS is displayed in Fig. 1 . The laser line of an ion multiline laser (Lasos, Jena, Germany, LGK ) and the 633-nm laser line (Laser 2000, Munich, Germany) were both expanded by beam expanders ( and ) as illustrated. The output power of the lasers was adjusted using neutral density filters (optical density 0.5 to 4). Both beams were collimated by their respective telescopes, these each consisting of focusing and collimating lenses ( and ). The DOEs were located close to the intermediate focusing plane to generate the desired two multifoci configurations (see lower right, Fig. 1). The last lens of the telescope could be positioned precisely in the direction, enabling good alignment of the pattern along the optical axis, permitting optimal overlap with the pattern. The distance between the spots in the generated pattern was designed to be in the sample, but slight tuning of the distance between the spots was enabled by mounting both DOEs onto -axis translators. In addition, the fan-out DOE for the excitation was fixed in a high-precision rotating holder (Thorlabs, Newton, USA, PRM1/M) to match any angular deviation of its pattern with that of the 488-nm DOE. An aperture stop (not shown) was placed after each DOE in the telescope to block stray light and light from higher diffraction orders. Subsequent to the DOE/collimator, the 488- and excitation patterns were combined by dichroic mirror 1 (Chroma, Rockingham, USA, 620dcxr) and directed into the back port of an inverted microscope (Olympus, IX-70, not shown). In the microscope, the two excitation beams were reflected by dichroic mirror 2 (Chroma, 488/633/1064) into a water immersion objective (Olympus, Tokyo, Japan, UAPO40X/340, , cover glass corrected), which focused the combined laser beam spots into the sample solution. The dual-color fluorescence emission was collected by the same objective and transmitted by dichroic mirror 2 out through the left side port of the microscope, where it was focused by the tube lens of the microscope (Olympus, ). The dual-color emission was thereafter split into its green and red fluorescent components by dichroic mirror 3 (Chroma, 630dcxr) and filtered using, respectively, bandpass filter 1 (Chroma, HQ685/70) and bandpass filter 2 (Chroma, D540/60) to suppress cross talk and Rayleigh- and Raman-scattered light. Finally, the emission was collected by optical multimode fibers. The diameters of the fibers, acting as pinholes, were 50 and , respectively, for the green and red fluorescence emission. For both the red and the green emission, an in-house built translator allowed independent spatial adjustment of each channel’s four fibers. The fiber outputs were connected to a four-channel prototype avalanche photodiode array (PerkinElmer Optoelectronics, Fremont, USA, SPCM-AQ4C) or to single avalanche photodiodes (PerkinElmer Optoelectronics, SPCM-AQR-14). The logic TTL signals from the detectors were then transferred to PC-based correlators (ALV-5000), which computed and displayed the photon count rate and cross- (or auto-) correlation curves. The cross-correlation and autocorrelation curves were analyzed with an in-house developed fitting program (Corrkino, Karolinska Institute, Department of Medical Biophysics) based on a Levenberg-Marquardt algorithm with the same error analysis as used by Koppel.13 Fig. 1Schematic illustration of the FCCS setup. The excitation has been simultaneously performed with ion ) and laser light. Lenses were mounted on translators. Additionally, the terminal lenses of each beam expander, the lenses of each collimator, and the DOEs, were mounted on translators. Fluorescence emission was filtered by bandpass filters 2 for the green (HQ540/60) and by bandpass filter 1 for the red (HQ685/70) wavelengths, respectively. Individual adjustment of the spatial position of the optical fiber entrance was possible for all eight fibers, which directed the photons onto the APDs. In the lower right portion of the figure, the laser excitation pattern from the two diffractive optical fan-out elements ( right/ left) and a schematic overlap of two foci (middle) are shown. 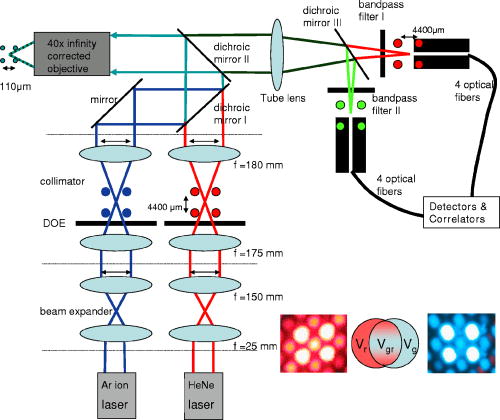 The fluorescent dyes used for the autocorrelation analyses of labeled nucleotides (dUTP and dCTP, at concentrations) were RhGreen (rhodamine green, absorption , emission ) and Cy5 (absorption , emission ). For cross-correlation analysis, two hybridization samples (samples 1 and 2) were used. The hybridization samples were obtained by annealing two probes each double-labeled with either RhGreen or Bodipy 630 and ) to the oligonucleotide in equimolar concentrations of [all oligonucleotides were synthesized by Thermohybaid (Ulm, Germany)]. Hybridization was performed in a buffered system [ , 0.06% (v/v) NP-40] by heating at for , and then by stepwise reduction of the temperature with for each step: 70, 60, 50, 40, and on ice. For the cross-correlation measurements, final concentrations of of the hybridization samples were used and the samples were diluted in saline sodium citrate (SSC) buffer [0.01% (v/v) NP-40]. We would like to point out that the absorption and emission spectrum of Bodipy 630 are similar to the one of Cy5. The concentrations were controlled and calibrated with a commercially available dual-color FCCS instrument (ConfoCor 2, Zeiss AG, Jena, Germany).3.Theoretical ConsiderationsFluorescence correlation spectroscopy (FCS) allows the analysis of biomolecular interactions and biomolecular complexes at the single-molecule level.11, 19 Detailed reviews of FCS and its applications exist.19, 20, 21 The principal of this analytical method is to observe intensity fluctuations from individual fluorescent biomolecules traversing small open volume elements that are defined by the intensity distribution given from laser excitation. The so-called normalized autocorrelation function, , (where is the mean observed fluorescence intensity and denotes the temporal fluctuation about ), is a measure of these fluctuating intensities as a function of time. The most common analytical expression for the autocorrelation of a single species of dye-labeled molecules diffusing by Brownian motion through the excitation volume element is given by22 where is the amplitude of the autocorrelation curve at time , being the mean number of molecules in the detection volume element, is the molecular diffusion time across the detection volume element , and is the ratio of the radius in the radial and the axial direction for an assumed Gaussian excitation intensity distribution. Unlike FCS, where a single signal is correlated with itself, cross-correlation (FCCS) for two emission wavelengths only arises if the signal fluctuations from the first dye are correlated to the fluctuations coming from the second dye.10 Therefore, solely biomolecules with two complementary dyes (e.g., red dye-labeled probes and green dye-labeled probes simultaneously hybridized to an oligonucleotide) can emit concurrently at two different wavelengths and contribute to the cross-correlation function. Molecules containing only a single dye (red or green) cannot be observed, since their motions and fluctuating signal are uncorrelated in time.10, 19If we define and to be the mean intensities arising from emission at the red and green wavelengths, respectively, and and then are deviations from their respective means, the normalized auto- and cross-correlation functions for fluorescence intensity fluctuations between two wavelengths can be expressed as10 , the brackets again denoting the time-averaged signal and being the time delay. Given the red and green detection volume element autocorrelation functions and , respectively, the number of molecules harboring both dyes can be calculated by7 Since the emission of RhGreen is very broad, substantial fluorescence can be detected in the red channel. Therefore, following Rigler, 7 cross talk corrections are made via the parameter , where , and and are the fluorescence detection efficiencies expressed in photon counts per second (lower and upper indices denote excitation and emission wavelengths, respectively, and and indicate red and blue, respectively). For our setup, and , hence . Detection efficiency of green emission from molecules excited with red was neglected as . The average number of molecule labeled with green dyes, , was calculated from the autocorrelation curve obtained for blue excitation and green emission. To calculate the concentration of the cross-correlating molecules, the mean size of the cross-correlating detection volume element was approximated as7, 10:with , , , and being the half-axes of the Gaussian intensity distribution of the green and the red detection volumes. A schematic sketch of the mean volume element can be found in the lower right corner of Fig. 1.4.Measurements and DiscussionFigure 2 shows two representative autocorrelation curves for labeled nucleotides (Cy5-dCTP and RhGreen-dUTP) measured at nM concentrations, with parallel red and blue DOE excitation spots positioned in the same sample droplet. Using these calibration measurements, three of the four DOE-generated excitation volume elements were characterized (unfortunately, only three out of the four glass fiber positioning devices were working properly), illustrating the feasibility of the parallel cross-correlation setup. The experimentally obtained autocorrelation curves were fitted with the simple analytical expression for one diffusing component (single species), Eq. 1. The results for these measurements are displayed in Table 1 . Fig. 2Normalized autocorrelation curves for red and blue DOE-generated foci. The dotted curve is the autocorrelation from Cy5-labeled nucleotides, and the solid curve is from RhGreen-labeled nucleotides. The diffusion time for the Cy5-labeled molecules is longer because the diffraction-limited volume element of the red excitation is bigger. In addition, the pinhole (glass fiber) has a bigger diameter. Similar curves were obtained for all four spots, indicating that the DOE-generated excitation volume elements are all similar in size. Additionally, the apparatus could be aligned, so that similar results for concentration measurements could be obtained (see Table 1).  Table 1Calibration measurements for the three DOE-generated spots positioned in the same sample droplet. The counts per molecule (CPM) vary in between the spots, since the two channels (Cy5 and RhGreen) are detected by independent adjustable glass fibers.
One of the most important parameters for biomolecular analysis is the concentration of biomolecules present in the sample, given by , where is the Avogadro’s number, and the focal (single color) volume element is . The diffusion constants are and for RhGreen11 and Cy5,23 respectively. As shown in Table 1, the concentrations of the molecules measured in the three spots (all being within the same sample droplet) are almost identical for the Cy5 labeled nucleotides and similar for the RhGreen labeled nucleotides . The focal volume at the three different focal points varies by as much as 25%, so as expected, the measured value for Cy5 also varies (Table 1). However, when the diffusion time (from which was calculated) is taken into account when calculating the concentration, the error in the concentration determination is only on the order of 10%. The large variations in counts per molecule (CPM) in Table 1 were partly due to small off-axis aberrations (mainly coma and astigmatism) in the image plane, because the sub-beams generated by the DOE are not on the optical axis. Such aberrations have been simulated utilizing ZEMAX Development corporation (Bellevue, USA), which showed that the collection efficiency can decrease up to a factor of 2 to 5 for our foci system, as compared to an on-axis single point illumination scheme (for comparison, see Gösch 17). Further, the relatively simple fiber holders enabled us to adjust each of the fibers independently ( and direction), but obviously not precisely enough, since we were not able to sufficiently compensate for individual variations affecting the total collection efficiency. However, the overall alignment of the apparatus was sufficiently good to perform measurements for concentration determinations. Although the measured precision for parameters that are not statistically independent, such as and , can be more than 25%, the relative error for is less than 10%. Figure 3 shows the typical cross-correlation curves for freely diffusing double-labeled hybridization products measured in the three DOE-generated dual-color spots. Each hybridization sample was dispersed in a droplet onto a cover glass at a concentration of around . The three DOE-generated spots were all positioned in the same sample droplet to measure the correlation of the molecules. The measurement time for obtaining the results shown was only one minute. The resulting cross-correlation curves were fitted with the analytical expression of a single component model for dual-labeled species [Eq. 2] to obtain the cross-correlation amplitude value , from which is calculated. The autocorrelation functions for each of the three spots were recorded and analyzed [Eq. 1] to determine the number of red and green dye-labeled biomolecules ( and ). Once is obtained, the fitting parameters and can be used to calculate from Eq. 3. The values of calculated from and are summarized in Table 2 . The concentrations of the hybridization sample turned out to be in the upper pM region, which is quite natural, since the yield of double-labeled hybridization products is often quite variable and not comparable to measurements of samples labeled with a single dye. Fig. 3Three cross-correlation curves obtained simultaneously from three different spots (overlapped foci) in a single sample droplet of the hybridization sample (sample 2). Each spot is generated by the overlap of one red and one blue DOE-generated focus.  Table 2Concentrations of hybridization products determined for two separate analyses. All data presented have been corrected for cross talk contributions.7
The three different cross-correlation curves in Fig. 3 were not equal in amplitude (differences ), but the concentrations of cross-correlating molecules [see also Eqs. 2 and 3] from all three spots, however, turned out to be quite similar and only had a standard deviation of around 20% (independent of the sample), with most of this imprecision arising from imperfect alignment of the glass fiber cables toward the excitation volume elements, since the average number of molecules in the sample droplet can be considered as constant. The differences in amplitude gave us a clear indication that the overlap of the red and green excitation foci and/or the fluorescence imaged on the red and green pinholes were not the same for all three spots. However, these differences have been compensated quite well by taking the amplitudes and of the autocorrelations, and the approximated detection volume element [Eq. 3], into account. Equation 3 is a good approximation of the volume shared by green and red volume elements. On the other hand, when these do not overlap well, as they do here, Eq. 3 overestimates , which consequently would lead to an underestimation of the calculated concentration . But since is still correlated with (e.g., a larger volume element measures more ), the concentration of the dual-colored molecules varied less than the amplitude between the different spots. Another phenomenon affecting precision is cross talk, which is usually obtained when measuring two-color samples. Sometimes the appearance of cross talk can also originate from fluorescence resonance energy transfer (FRET),24 which can occur when different dyes are too close together such that an energy transfer takes place. To make sure that the signals we obtained were real cross-correlating signals, the dual-color excited cross-correlation curve was always compared with the blue-laser excited (cross talk) pseudo cross-correlation curves. The cross talk , expressed in fluorescence detection efficiency, is on the order of 2% (vide supra). Its effect on the dual-color cross-correlation curves for the three excitation spots shown in Fig. 3 can be judged from the three cross talk pseudo cross-correlation curves in Fig. 4 , which show a substantially different amplitude as compared to the true cross-correlation curves. Fig. 4The cross talk signal of the hybridization sample (sample 2) resulting from excitation with the blue laser line and detection with the red channel (685/70). The amplitudes of the three curves are very similar, since the pinhole was adjusted for the green excitation channel to assure that the same spot was imaged with the red and the green pinhole simultaneously. The diffusion time is approximately two times shorter as compared to the values obtained for cross-correlation measurements (compare Fig. 3). This indicates clearly that the biggest contribution to these cross talk correlation curves originates from unbound smaller labeled primers, and that real cross-correlations were obtained for the hybridized molecules (Fig. 3). 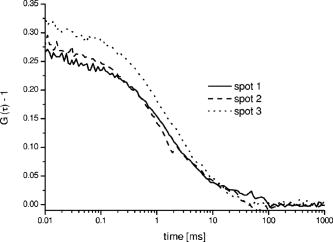 In addition to the cross talk controls, we also tested the cross-correlating hybridization samples for their authenticity. Figure 5 presents a comparison between the cross-correlation measurement on one hybridization sample (sample 2), and cross-correlation measurements on the same sample three minutes after adding Benzonase (Merck Biosciences GmbH, Germany) to it. Benzonase is an endonuclease degrading all forms of DNA and RNA (single stranded, double stranded, linear, and circular) and separates the red and green dyes from each other completely. Thereby the cross-correlation disappears, since no double-labeled molecules are left to contribute to the cross-correlating signal. This is definitive evidence that the cross-correlation analysis in the DOE-generated spots was performed on a real cross-correlating sample. Fig. 5Cross-correlation curve from a double-labeled hybridization sample (sample 2) and the cross-correlation curve of the same sample measured three minutes after Benzonase was added. After Benzonase was added to the sample, the cross-correlating signal vanished. 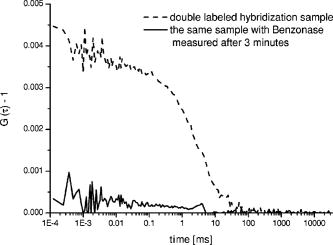 Taken as a whole, Figs. 3, 4, and 5 demonstrate that cross-correlation analysis can be performed with the two DOE-generated foci. 5.ConclusionsWe develop a multifocal dual-color cross-correlation spectroscopic system using two fan-out DOEs. The parallel single-color excitation and detection system shows uniform intensity in all four foci, and similar concentrations of fluorescent molecules for one-color excitation and detection are obtained. The dual-color cross-correlation analysis on double-labeled molecules, however, shows variations in cross-correlation amplitude as a consequence of nonperfect overlapping detection volumes, but comparable concentration values. The concentrations of double-labeled hybridization samples are determined in the region with this multifocal dual-color cross-correlation setup. Although a crosstalk signal is present, the cross-correlation signal of double (red and green) dye-labeled DNA-molecules could easily be extracted. Limitations in precision are dictated by the imperfection of the excitation profile, which suffers from aberrations that probably are not possible to circumvent when using off-axis confocal excitation. Further, the inability to independently adjust the positions of the four excitation spots, since they all originate from the same DOE, also leads to limited alignment capability. The alignment of the excitation pattern of one DOE with the other is still time consuming and cumbersome, because of the many degrees of freedom present in the optical system (i.e., movement of the DOEs and the lenses of the beam expander in , and directions). Implementing a better fine adjustment (e.g., piezo driven screws) into the fiber holders as well as deploying an automated iterative alignment procedure in the movable parts would certainly improve the overlap greatly. A better overlap would increase the size of the cross-correlation detection volume element, which in turn would improve the detection probability of cross-correlating (double-labeled) molecules. Thereby, concentrations would be determined more precisely and the typical single-spot FCCS precision (approximately 10%) could be achieved. Combining the information of multiple spots confers the multiplex advantage, i.e., the encountered fluorescent events per time unit will increase. This would consequently decrease the measurement time or lower rare-event detection limits even further (e.g., slowly diffusing molecules and molecules at low concentrations).25 Yet one limitation remains: measurements on different instruments with a spot configuration will not give equal concentration values for the same sample. However, today’s commercially available confocal cross-correlation measurement instruments suffer from the same limitations. Nonetheless, changes in concentration and diffusivity can easily be distinguished on a relative basis over time by any given single instrument, which is particularly attractive for high-throughput screening applications, low concentration determinations, and/or the detection of slowly diffusing biomolecules. In addition, such parallel ultra-sensitive FCCS capability may open new pathways in monitoring, e.g., transport properties of key substances, and the migration of receptors or channels on/in live cell membranes. AcknowledgmentsThis study was supported by grants from The Swedish Foundation for Strategic Research (SSF), the Human Frontier Science Program (HFSP), and the Swedish Science Council (VR). The authors would like to thank GNOTHIS AB, Stockholm, for technical support, and PerkinElmer Optoelectronics for loaning the 4-APD-detector array prototype. We also thank Mario Amacker and Åsa Bergström for sample preparation. This work is in memory of our dear colleague Sverker Hård, who passed away in April 2004. ReferencesN. S. Gray,
L. Wodicka,
A. M. W. H. Thunnissen,
T. C. Norman,
S. Kwon,
F. H. Espinoza,
D. O. Morgan,
G. Barnes,
S. LeClerc,
L. Meijer,
S. H. Kim,
D. J. Lockhart, and
P. G. Schultz,
“Exploiting chemical libraries, structure, and genomics in the search for kinase inhibitors,”
Science, 281 233
–538
(1998). 0036-8075 Google Scholar
D. Whitecomb,
C. R. Newton, and
S. Little,
“Advantages in approaches to DNA-based diagnostics,”
Curr. Opin. Biotechnol., 9 602
–608
(1998). 0958-1669 Google Scholar
A. Holmberg,
“DNA-microarrays: novel techniques to study aging and guide gerontologic medicine,”
Exp. Gerontol., 36 1189
–1198
(2000). 0531-5565 Google Scholar
D. J. Lockhart and
E. A. Winzeler,
“Genomics, gene expression and DNA arrays,”
Nature (London), 405 827
–836
(2000). https://doi.org/10.1038/35015701 0028-0836 Google Scholar
M. Schena,
D. Shalon,
R. W. Davis, and
P. O. Brown,
“Quantitative monitoring of gene expression patterns with a complementary DNA microarray,”
Science, 270 467
–470
(1995). 0036-8075 Google Scholar
J. Wölcke and
D. Ullmann, Drug Discov. Today, 6 637
–646
(2001). Google Scholar
R. Rigler,
Z. Földes-Papp,
F. J. Meyer-Alme,
C. Sammet,
M. Volcker, and
A. Schnetz,
“Fluorescence cross-correlation: A new concept for polymerase chain reaction,”
J. Biotechnol., 63 97
–109
(1998). 0168-1656 Google Scholar
A. Koltermann,
U. Kettling,
J. Bieschke,
T. Winkler, and
M. Eigen,
“Rapid assay processing by integration of dual-color fluorescence cross-correlation spectroscopy: High throughput screening for enzyme activity,”
Proc. Natl. Acad. Sci. U.S.A., 95 1421
–1426
(1998). https://doi.org/10.1073/pnas.95.4.1421 0027-8424 Google Scholar
M. Kinjo and
R. Rigler,
“Ultrasensitive hybridization analysis using fluorescence correlation spectroscopy,”
Nucleic Acids Res., 23 1795
–1799
(1995). 0305-1048 Google Scholar
P. Schwille,
F. J. MeyerAlmes, and
R. Rigler,
“Dual-color fluorescence cross-correlation spectroscopy for multicomponent diffusional analysis in solution,”
Biophys. J., 72 1878
–1886
(1997). 0006-3495 Google Scholar
R. Rigler,
U. Mets,
J. Widengren, and
P. Kask,
“Fluorescence correlation spectroscopy with high count rate and low-background—Analysis of translational diffusion,”
Eur. Biophys. J., 22 169
–175
(1993). https://doi.org/10.1007/BF00185777 0175-7571 Google Scholar
H. Qian,
“On the statistics of fluorescence correlation spectroscopy,”
Biophys. Chem., 38 49
–57
(1990). https://doi.org/10.1016/0301-4622(90)80039-A 0301-4622 Google Scholar
D. E. Koppel,
“Statistical accuracy in fluorescence correlation spectroscopy,”
Phys. Rev. A, 10 1938
–1945
(1974). https://doi.org/10.1103/PhysRevA.10.1938 1050-2947 Google Scholar
P. Kask,
R. Gunther, and
P. Axhausen,
“Statistical accuracy in fluorescence fluctuation experiments,”
Eur. Biophys. J., 25 163
–169
(1997). https://doi.org/10.1007/s002490050028 0175-7571 Google Scholar
H. Blom,
M. Johansson,
A. S. Hedman,
L. Lundberg,
A. Hanning,
S. Hard, and
R. Rigler,
“Parallel fluorescence detection of single biomolecules in microarrays by a diffractive-optical-designed fan-out element,”
Appl. Opt., 41 3336
–3342
(2002). 0003-6935 Google Scholar
H. Blom,
M. Johansson,
M. Gösch,
T. Sigmundsson,
J. Holm,
S. Hard, and
R. Rigler,
“Parallel flow measurements in microstructures by use of a multifocal diffractive optical fan-out element,”
Appl. Opt., 41 6614
–6620
(2002). 0003-6935 Google Scholar
M. Gösch,
A. Serov,
T. Anhut,
T. Lasser,
A. Rochas,
P. A. Besse,
R. S. Popovic,
H. Blom, and
R. Rigler,
“Parallel single molecule detection with a fully integrated single-photon CMOS detector array,”
J. Biomed. Opt., 9
(5), 913
–921
(2004). https://doi.org/10.1117/1.1781668 1083-3668 Google Scholar
M. W. Farn,
“New iterative algorithm for the design of phase-only gratings,”
Proc. SPIE, 1555 34
–42
(1991). 0277-786X Google Scholar
R. Rigler and
E. S. Elson, Fluorescence Correlation Spectroscopy, Theory and Applications,
(2001) Google Scholar
O. Krichevsky and
G. Bonnet,
“Fluorescence correlation spectroscopy: the technique and its applications,”
Rep. Prog. Phys., 65 251
–297
(2002). https://doi.org/10.1088/0034-4885/65/2/203 0034-4885 Google Scholar
M. Gösch and
R. Rigler,
“Fluorescence correlation spectroscopy of molecular motions and kinetics,”
Adv. Drug Delivery Rev., 57 169
–190
(2005). 0169-409X Google Scholar
E. L. Elson and
D. Magde,
“Fluorescence correlation spectroscopy I: Conceptual basis and theory,”
Biopolymers, 13 1
–27
(1974). https://doi.org/10.1002/bip.1974.360130102 0006-3525 Google Scholar
P. F. Lenne,
D. Colombo,
H. Giovannini, and
H. Rigneault,
“Flow profiles and directionality in microcapillaries measured by fluorescence correlation spectroscopy,”
Single Mol., 3 194
–200
(2002). https://doi.org/10.1002/1438-5171(200208)3:4<194::AID-SIMO194>3.0.CO;2-0 1438-5163 Google Scholar
J. Widengren,
E. Schweinberger,
S. Berger, and
C. A. M. Seidel,
“Two new concepts to measure fluorescence resonance energy transfer via fluorescence correlation spectroscopy: Theory and experimental realizations,”
J. Phys. Chem. A, 105 6851
–6866
(2001). https://doi.org/10.1021/jp010301a 1089-5639 Google Scholar
K. Korn,
P. Gardellin,
B. Liao,
M. Amacker,
Å. Bergström,
H. Björkman,
A. Camacho,
S. Dörhöfer,
K. Dörre,
J. Enström,
T. Ericson,
M. Gösch,
A. Honegger,
S. Jaccoud,
M. Lapczyna,
E. Litborn,
P. Thyberg,
H. Winter, and
R. Rigler,
“Gene expression analysis using single molecule detection,”
Nucleic Acids Res., 31 e89
(2003). 0305-1048 Google Scholar
|


