|
|
1.IntroductionBiopsy followed by pathology is the gold standard and the most common approach to diagnose cancer. However, it is a time-consuming method and based on the pathologist’s expertise. Though diagnostic procedures for cancer have improved tremendously during the past decades, they are established as highly expensive techniques. Thus, there is the need to develop an accurate, fast, convenient, and inexpensive method for cancer diagnosis. Several research groups have investigated the application of near-infrared (NIR) spectroscopy as a noninvasive and time-saving method for cancer diagnosis.1, 2, 3, 4 Near-infrared spectroscopy is based on overtones and combinations of the molecular vibrations of C–H, N–H, and O–H groups, which are part of all biological molecules. Therefore, the absorption of near infrared radiation leads to a complex spectrum, which provides qualitative and quantitative information about the chemical composition of the tissue with its main components of lipids, proteins, carbohydrates, and water. Any alteration in the chemical composition of the tissues can thus be detected by NIR spectroscopy and be evaluated with the help of mathematical nonsupervised methods such as cluster analysis, which is a pattern recognition technique. In the present study, we investigated the qualitative spectral differences between cancerous and its adjacent normal tissues in surgically resected pancreatic cancer specimens using NIR fiber-optic spectroscopy. 2.Materials and Methods2.1.FTNIR Spectrometer and Fiber Optic ProbeA Vector 22/N Fourier transform near-infrared (FTNIR) spectrometer (Bruker Optics GmbH, Ettlingen, Germany) was used for the NIR measurements of the tissues. The spectrometer was equipped with a fiber-optic port for the remote sampling applications and was controlled by the Bruker Optics User Software (OPUS) of version 4.0 (Bruker Optics GmbH, Ettlingen, Germany). The spectra were recorded, preprocessed, and analyzed using this software. The fiber optic probe (Richard Wolf GmbH, Knittlingen, Germany) used for the measurements was a Y-shaped probe with one arm used for sample illumination and the other for radiation detection. Both arms contained the same number of quartz fibers and possessed a high transmittance within the used wave-number range. The head of the probe had an outer diameter of and an inner diameter of . Within the inner diameter, the active surface was of diameter and the NIR radiation and detection fibers alternate relatively evenly. 2.2.Pancreatic SamplesPatient specimens were collected immediately after surgery from the central operation theatre of the University Hospital, Mannheim, with informed patient consent. The study was approved by the local ethics committee. A total of 18 surgically resected pancreatic tumor specimens, 17 from adenocarcinoma patients (eight males and nine females) and one from a cystadenoma patient (female) were collected. Of the 18 specimens, 15 were derived from Traverso procedure, two from pancreas pancreas tail resection, and one from Whipple resection. The mean age of the patients was with the oldest and the youngest . 2.3.NIR MeasurementsThe spectra of the tissue samples were measured at room temperature before the microscopic histological assessment was provided. White Spectralon (Bruker Optics GmbH, Ettlingen, Germany) was used as a reflectance standard. The spectra were collected with the co-addition of 32 scans (measurement time ) in diffuse reflectance mode from with a spectral resolution of , applying Blackman-Harris three-term apodization and a zero filling factor of 2. The resected tissue kept in a plastic box was placed on a laboratory jack and the fiber optic probe was attached to a clamp to make its tip contact the tissue area by carefully lifting the stage. In all patients the spectra were collected from the tumor region and from the resection edges. The assignment of the spectra to normal and cancer was based on the histological examination of the tumor and resected margins of the tissue by a pathologist. In 17 samples three different regions were selected from cancer and from the resected border of the tissue; three spectra were measured from each region for a total of nine spectra each from cancerous and normal tissue. In one sample only six spectra were collected from both cancerous and the resected border of the tissue from two different regions due to the small size of the tissue. 2.4.Outlier DetectionThe spectra from the different tissue categories that were collected from each patient were averaged for a mean spectrum of cancerous and healthy tissue, respectively. The mean and standard deviation for the mean spectrum of cancerous and normal tissues of the patients were calculated and the patient tissue spectra, which were outside the mean standard deviation, were considered as outliers. No outliers based on the criteria to lie between the mean standard deviation were detected. 2.5.Data PreprocessingThe spectra of cancerous and normal tissue that were collected from each patient were first derivated using the Savitzky-Golay algorithm with nine smoothing points followed by vector normalization. The preprocessed spectra from cancerous and normal tissue of each patient, respectively, were averaged. These mean spectra were used for further evaluation. 2.6.Calculation of the Statistical SignificanceThe statistical significance of the differences between preprocessed cancerous and normal tissue spectra was calculated by the double-sided unequal variance T test. The P values were calculated for each wave number and plotted against their corresponding wave numbers. The percentage of wave numbers with was calculated. 2.7.Spectral EvaluationSpectral evaluation was done by hierarchical cluster analysis using Ward’s algorithm as implemented in the OPUS software. In hierarchical cluster analysis the spectra are partitioned into groups or clusters according to the similarity or dissimilarity of the spectra and the result is shown as a dendrogram.5 3.Results and DiscussionThe difference in tissue composition between pancreatic cancer and normal tissues has been extensively analyzed using chemical, histochemical, biochemical, and immunohistochemical studies. Altered composition of isoferritin, glycosaminoglycans, glycoproteins, and glycolipids has been described in pancreatic adenomas and carcinomas.6, 7, 8, 9, 10 These differences in the tissue composition will contribute to the spectral variance between cancer and normal tissues. The near-infrared spectrum of the pancreatic tissue and the assignment of the peaks to various chemical substructures11 in the spectrum are shown in Fig. 1 . The spectrum is a mixture of the spectral signatures of many tissue components including water, lipids, proteins, and carbohydrates. The drop of the (reflectance) around is due to the low transmittance close to the interval end as shown in Fig. 1. The mean of tumor and normal tissue measurements from one sample and their standard deviations are shown in Fig. 2 . The variance is essentially constant across the spectral range used. This suggests that the spectra are highly reproducible. The mean spectra from tumor and normal tissue measurements of all the samples and their standard deviations are shown in Fig. 3 . The relatively high variation between the samples could be due to different tumor stages of the tissues (Table 1 ) and differences in the tissue thickness of the samples.12 Fig. 2Mean and standard deviation spectra of the tumor and normal tissue measurements of one patient.  Table 1Pathological stages of the tumors.
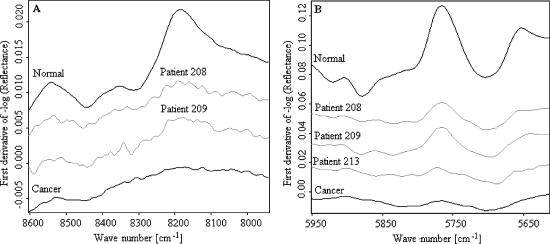
Since derivative techniques are normally used to remove or suppress constant background signals and to enhance the visual resolution of the spectra, we have used the first derivative spectra for the evaluation with cluster analysis. However, as derivation amplifies the spectral noise, we smoothed the data using the Savitzky-Golay algorithm. Further, to reduce the differences between each single measurement of the same sample, the spectra were vector normalized after derivation and smoothing. To emphasize the differences between the preprocessed cancer and normal spectra, the mean normal spectrum was subtracted from the mean cancer spectrum. The preprocessed mean spectrum of cancer and normal tissue and their differences are shown in Fig. 4 . Fig. 4First derivative and vector normalized mean spectra of pancreatic cancer and normal tissue and their difference spectra.  To assess whether significant differences existed between preprocessed normal and cancerous tissue spectra, paired t tests were applied for the absorbance values at each wave number and the resulting values were plotted. Several intervals of the resulting plot contained statistically significant values (Fig. 5 ). Of the total wave numbers, 76.2% were significantly different with . The result from a hierarchical cluster analysis using the wave numbers showing significant difference is presented in Fig. 6 . Five clusters can be found with a majority of cancerous tissue spectra in the first, second, and third clusters and the majority of the normal tissue spectra in the fourth and fifth clusters. Fig. 5P values of absorbances at wave numbers showing significant differences between pancreatic cancerous and normal preprocessed spectra. 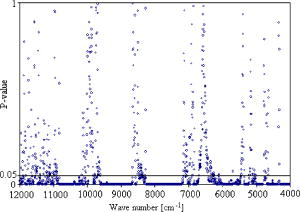 Fig. 6Hierarchical cluster analysis of the NIR preprocessed spectra of tumor and normal tissue measurements of the wave numbers showing significant differences .  As cancerous tissues mainly differ from normal tissues in glycolipids, glycoproteins, and glycosaminoglycans composition6, 7, 8, 9, 10 and the CH vibrational regions represent these classes,3, 4, 13, 14, 15 we decided to use the CH stretching bands for the evaluation by a cluster analysis. As a result, the spectra were separated with high sensitivity and specificity using the CH stretching first and second overtone regions . The peaks in the cancer tissue spectrum between the wave numbers 8584–8497, 8263–7938, 5795–5729, and were reduced in intensity compared with those in the normal tissue spectra. The band intensities between the wave numbers 8605–8585, 8497–8263, 5951–5795, and were strongly in relation to those in the normal tissue spectra (Fig. 7 ). The dendrograms of the cluster analysis using CH first and second overtone regions are shown in Fig. 8 and the classification results are summarized in Table 2 . Fig. 7Spectral differences in the mean spectra of cancerous and normal tissues in CH stretching second and first overtone regions.  Fig. 8Hierarchical cluster analysis of the NIR preprocessed spectra of tumor and normal measurements in CH stretching first and second overtone regions showing dendrograms with separate clusters for tumor and normal tissue. 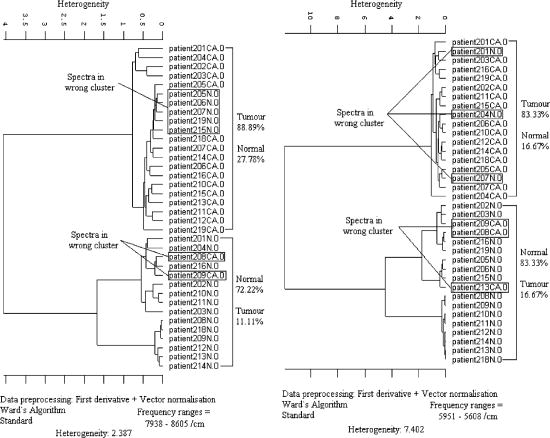 Table 2Classification results of the hierarchical cluster analysis of NIR preprocessed spectra of pancreatic tumor and normal tissues using data from CH stretching first and second overtone regions.
When evaluating the spectral interval data of , the hierarchical cluster analysis classified the spectra into two groups with 88.9% tumor and 27.8% normal spectra in first group and 72.2% normal and 11.1% tumor spectra in the second group. The heterogeneity between the two groups was 2.387. With the evaluation of the spectral region , the spectra were classified into two groups with 83.3% tumor and 16.7% normal spectra in the first group and 83.3% normal and 16.7% of the spectra in the second group. The heterogeneity between the two clusters was 7.402. With the evaluation of the CH second overtone region, three spectra from adenocarcinoma and five spectra from normal were misclassified, and with the evaluation of the CH first overtone region three spectra from adenocarcinoma and three spectra from normal were misclassified, respectively. The comparison of the misclassified spectra with the mean spectra of normal tissue and cancer are shown in Figs. 9 and 10 . All the normal spectra that were misclassified exhibit spectral features similar to the cancer spectra [Figs. 9(A), 9(B)] and all the cancer spectra that were misclassified exhibit spectral features similar to the normal spectra [Figs. 10(A), 10(B)]. The sensitivity of the method in CH first overtone region was 83.3% with a specificity of 83.3%. With the CH second overtone region data we could achieve a sensitivity of 88.9% and specificity of 72.2%. The accuracy of the method using CH first and second overtone region data was 83.3% and 80.5%, respectively. 4.ConclusionCluster analysis of the NIR fiber-optic spectra of surgically resected human pancreatic tumor tissues showed high sensitivity and specificity in discriminating the spectra obtained from tumor tissues from the spectra measured from normal tissues. With a sample population size of 18 patients, we achieved highest accuracy with a sensitivity of 83.3% and a specificity of 83.3% using data from CH first overtone region of the NIR spectrum, which suggests a potential spectral region to distinguish tumor from normal tissue. The advantage of this method is that it is a very fast, simple, and relatively inexpensive technique. These findings suggest that NIR fiber optic spectroscopy offers the potential for a minimally invasive in-vivo diagnosis of pancreatic tumors. AcknowledgmentsWe acknowledge Karl Voelker Foundation of Mannheim University of Applied Sciences, Mannheim, Germany, for the financial support of this study. We are grateful to Richard Wolf GmbH, Knittlingen, Germany, for providing us with the fiber-optic probe. ReferencesS. B. Colak,
M. B. van der Mark,
G. W. Hooft,
J. H. Hoogenraad,
E. S. van der Linden, and
F. A. Kuijpers,
“Clinical optical tomography and NIR spectroscopy for breast cancer detection,”
IEEE J. Sel. Top. Quantum Electron., 5
(4), 1143
–1158
(1999). https://doi.org/10.1109/2944.796341 1077-260X Google Scholar
A. E. Cerussi,
A. J. Berger,
F. Bevilacqua,
N. Shah,
D. Jakubowski,
J. Butler,
R. F. Holcombe, and
B. J. Tromberg,
“Sources of absorption and scattering contrast for near-infrared optical mammography,”
Acad. Radiol., 8
(3), 211
–218
(2001). https://doi.org/10.1016/S1076-6332(03)80529-9 1076-6332 Google Scholar
L. M. McIntosh,
R. Summers,
M. Jackson,
H. H. Mantsch,
J. R. Mansfield,
M. Howlett,
A. N. Crowson, and
J. W. Toole,
“Towards non-invasive screening of skin lesions by near-infrared spectroscopy,”
J. Invest. Dermatol., 116 175
–181
(2001). https://doi.org/10.1046/j.1523-1747.2001.00212.x 0022-202X Google Scholar
N. Hirosawa,
Y. Sakamoto,
H. Katayama,
S. Tonooka, and
K. Yano,
“Invivo investigation of progressive alterations in rat mammary gland tumors by near infrared spectroscopy,”
Anal. Biochem., 305 156
–165
(2002). 0003-2697 Google Scholar
M. J. Adams,
“Pattern recognition I—Unsupervised analysis,”
Chemometrics in Analytical Spectroscopy, 103
–122
(1995) Google Scholar
H. Masuda,
T. Ozeki,
I. Takazono, and
Y. Tanaka,
“Composition of glycosaminoglycans in human pancreatic cancer,”
Biochem. Med. Metab. Biol., 41
(3), 193
–200
(1989). 0885-4505 Google Scholar
A. D. Theocharis,
M. E. Tsara,
N. Papageorgacopoulou,
D. D. Karavias, and
D. A. Theocharis,
“Pancreatic carcinoma is characterized by elevated content of hyaluronan and chondroitin sulphate with altered disaccharide composition,”
Biochem. Biophys. Acta., 1502
(2), 201
–206
(2000). Google Scholar
S. Linder,
E. Castanos-Velez,
A. Von Rosen, and
P. Biberfeld,
“Immunohistochemical expression of extracellular matrix proteins and adhesion molecules in pancreatic carcinoma,”
Hepato-Gastroenterology, 48
(41), 1321
–1327
(2001). 0172-6390 Google Scholar
I. Nakazawa,
A. Ohneda, and
K. Mura,
“Biochemical differences between human malignant and benign insulinoma tissues,”
Tohoku J. Exp. Med., 121
(3), 275
–280
(1977). 0040-8727 Google Scholar
H. Hattori,
K. Uemura,
H. Ishihara, and
H. Ogata,
“Glycolipid of human pancreatic cancer; the appearance of neolacto-series (type 2 chain) glycolipid and the presence of incompatibile blood group antigen in tumor tissues,”
Biochem. Biophys. Acta., 1125
(1), 21
–27
(1992). Google Scholar
L. Bokobza,
“Origin of near-infrared absorption bands,”
Near-infrared Spectroscopy, 11
–41
(2002) Google Scholar
H. M. Heise,
S. Haiber,
M. Licht,
C. Moll, and
M. Stücker,
“In vivo measurements of intact human skin by near- and mid-infrared spectroscopy,”
VDI-Berichte 1863, 107
–114
(2004) Google Scholar
J. Wang,
Y.-J. Geng,
B. Guo,
T. Klima,
B. N. Lal,
J. T. Willerson, and
W. Casscells,
“Near-infrared spectroscopic characterization of human advanced atherosclerotic plaques,”
J. Am. Coll. Cardiol., 39
(8), 1305
–1313
(2002). 0735-1097 Google Scholar
J. M. Canvin,
S. Bernatsky,
C. A. Hitchon,
M. Jackson,
M. G. Sowa,
J. R. Mansfield,
H. H. Eysel,
H. H. Mantsch, and
H. S. El-Gabalawy,
“Infrared spectroscopy: Shedding light on synovitis in patients with rheumatoid arthritis,”
Rheumatology, 42 76
–82
(2003). 0080-2727 Google Scholar
H. M. Heise,
“Applications of near-infrared spectroscopy in medical sciences,”
Near-infrared Spectroscopy, 289
–333
(2002) Google Scholar
|