

|
|
1.IntroductionIn vivo animal imaging is very important for providing anatomic, physiologic, metabolic, and pathologic information at single-cell and molecular levels.1, 2, 3 For example, the imaging of moving cells within blood and lymph microvessels may contribute greatly in studies of microcirculation, homeostasis, and the influence of various factors (drugs, smoking, radiation, etc.) on microvessels and cells, as well as in developing methods to diagnose and treat some diseases (e.g., cancer, diabetes, cardiac, etc.). Among different animal structures (e.g., ears, mouth cavity, stretched skin, etc.), the mesentery of small animals—rats and mice—is unique for studying cells in blood and lymph flow in vivo at single-cell and subcellular levels, as the mesentery consists of thin , transparent, duplex connective tissue with a single layer of blood and lymph microvessels. Additionally, established preparation procedures do not markedly influence the animal’s physiological parameters, at least during the short time period of observation .4 To date, blood microcirculation in the mesentery, particularly within the rat model, has been studied in appropriate detail (e.g., morphology, rheology, microflow dynamics, velocity profiling, leukocyte rolling, etc.); however, the lymphatic system has received much less attention.4, 5, 6, 7, 8, 9, 10, 11, 12, 13, 14, 15, 16, 17, 18, 19, 20, 21, 22 This is in spite of the many biological and medical problems associated with quantitative characterization of microlymphatic functioning (e.g., its role in immune response or interstitial fluid balance), and its disturbance in different diseases, such as lymphedema, venous insufficiency, infections, inflammation, lymphatic malformations, etc.23, 24, 25, 26, 27, 28 In contrast to blood, lymph is colorless with lower concentrations of cells [mainly lymphocytes with a small portion of red blood cells (RBCs)] and has relatively slow flow velocity ( on average versus for blood).1, 5, 20, 21, 22, 29, 30, 31, 32, 33 Lymph also has periodic oscillations (retrograde/back flow)20, 29, 30, 31, 32, 33 and an absence of a reverse correlation between vessel diameter and liner flow velocity (as is typical for blood vessels).29 Because of these features, most existing optical techniques are not quite suitable for imaging mesenteric lymphatics with high resolution, sensitivity, and image contrast. For example, phase and confocal diffuse reflectance microscopy is, in general, a very promising tool.34, 35, 36, 37, 38, 39, 40 However, this technique is not well suited for imaging low-scattering, low-refractive microlymphatics at the single-cell level, especially with scattering and refractive background noise from surrounding connective tissue. Powerful fluorescent imaging can only be applied to fluorescent samples, and most structures in rat mesentery in its native state are non- or weakly fluorescent. The fluorescent labeling may change tissue properties; in particular, obtaining lymph flow velocity by fluorescent imaging using injected fluorescent particles (fluorescein isothiocyanate-dextran) in the interstitial space leads to elevation of interstitial pressure and alteration of lymph viscosity.20 Potentially powerful combined Doppler optical coherence tomography (DOCT) can simultaneously monitor blood flow velocity in microvessels while imaging living tissue microstructures.41 However, DOCT has not been used to study low-scattering lymphatics, and in general, the achieved resolution of is insufficient for analyzing single cells and, especially, intracellular structures.42, 43 Several studies have demonstrated that conventional transmission digital microscopy (TDM) of rat mesentery is a promising model for studying some microlymphatic functions in norm, its response to drugs, and for experimental modeling of pathologies.16, 17, 18, 21 In particular, Galanzha 29, 30 demonstrated that in parallel with routine imaging (whole lymphangion, neighboring blood microvessels, lymphatic walls, leaflets of valve, and flowing single cells) and obtaining quantitative data (lymph and blood microvessel diameters, amplitude and rate of lymphatic phasic contractions), TDM allowed us to obtain more detailed parameters of phasic contractions (velocity of wall movement, duration of contraction and its periods), valve function (duration of valve cycle and its periods), and lymph flow (mean cell velocity, relation of forward and backward cell velocity, cell concentration). Additionally, using TDM, the correlations between investigated parameters, including a close correlation between valve function and phasic contractions, and increased cell numbers with decreased amplitude of phase contractions and lymph flow velocity at moderate cell concentrations was determined.29, 30, 31, 32, 33 With TDM, it was also possible to monitor microlymphatic responses to chemicals (sodium nitroprusside, N-nitro-L-arginine, dimethyl sulfoxide),30, 31 nicotine,33 lasers,33 and microsurgical interventions (experimental lymphedema).31, 32, 33 Recently the capability of the combination of TDM with speckle technique to measure lymph velocity30 and highly sensitive photothermal (PT) imaging to visualize intracellular structures of moving red and white blood cells in vivo were demonstrated.44, 45 However, these data were obtained with low-resolution TDM, and the features of the optical technique used were not described in detail. The goal of this work is to study the capabilities of the advanced TDM technique for high-resolution imaging of moving cells in rat mesentery with focus on cells in lymph flow. 2.Methods and Materials2.1.Imaging SystemThe schematic of the TDM module alone as a part of the integrated PT flow cytometer44, 45 is shown in Fig. 1 . In an integrated cytometer, TDM on the basis of an upright Olympus BX-51 microscope provided the following functions: (1) simultaneous measurement of vessel diameter, parameters of phasic contractions and valve work, and cell concentration in flow; (2) determination of cell velocity in lymph flow by video-recording cell movement; (3) navigation of the pulse laser beam in the central part (or other section, if necessary) of a vessel cross-section to realize PTI; and (4) single-cell identification (to distinguish leukocytes from RBCs, to estimate their shape, size, and aggregation types, and possibly, their interaction in flow). For the studies described here, we were focused on the capabilities of just the TDM mode with a conventional illuminating lamp. Depending on the structures’ size, different magnifications were used to image relatively large whole lymphangion , as well as single cells in lymph and blood flow. The images were recorded with two CCD cameras: a black-and-white Cohu 2122 and a color Nicon DXM1200 with a speed up to and minimal exposure time . In selected experiments we used black-and-white high-resolution CCD camera with speed up to (Cascade 650, Photometrics), which was sufficient for studying a relatively slow blood flow in capillary. However, the nonoverlapped mode of this camera allowed us to decrease exposure to and even less (i.e., quite enough to study relatively fast blood flows). Scion Image (Scion Corp.), Nicon software (ACT-1), and WinView/32 V2.5.18.2 (Roper Scientific) were used for processing, capturing, measuring, and editing images of the moving cells. In addition to TDM, we used the phase contrast module with phase-contrast objectives ( and ) to compare different images in real time. 2.2.Animal ModelWhite Fisher rats (F-344) weighing were used in all experiments, in accordance with UAMS protocol #2318 approved by Institutional Animal Care and Use Committee. Rats were narcotized by Nembutal ( body weight, i.m.), and then a laparotomy was performed. After this procedure, the mesentery of the intestine was exposed. The animal was placed on a heated microscopic stage with an optical window. The mesentery and intestine were preserved by diffusion with Ringer’s solution ( , pH 7.4). 3.Experimental ResultsTypical transmission images of rat mesentery are shown in Fig. 2 , with two relatively small magnifications [(a) , field of view ; and (b) ; field of view ]. Such magnifications allowed us to visualize the entire lymphangion (the fragment of lymph vessel between closely located input and output valves), its wall, lymphatic valves, and cells in lymph flow, as well as neighboring blood microvessels. Cells in flow resemble small, but distinct, points. Fig. 2Typical transmission image of rat mesentery fragment with one lymph microvessel with closed leaflets of valve and blood microvessels along lymphatic wall. Magnification: (a) and (b).  Imaging of moving cells in lymph flow allowed us to measure absolute cell velocities and the direction of their motion by video-recording (frame-by-frame). Monitoring of lymph flow revealed that the lymph usually moved in the forward direction for a short period of time; then, the motion was interrupted and the lymph stopped for up to . After that, the lymph flow started in the reverse direction. Sometimes, the time-averaged velocity of lymph flow was equal to zero. In this case, lymphocytes only oscillated relative to a position without the leak-back of lymph. Mean cell velocity was ranged of 0 up to . A comparison of images obtained with phase-contrast and TDM techniques revealed that, in general, the phase-contrast technique yielded lower contrast of the desired lymphatic structures (vessels, valves, cells, etc.), and was deteriorated by small refractive heterogeneities of connective tissue [Fig. 3(a) and 3(b) ]. Thus, the refractive background makes it difficult to distinguish single cells in a lymph flow, and especially their cellular structure. However, the phase-contrast images of selected single cells with high magnification ( , with water immersion), without overlapping refractive heterogeneities of connective tissue, sometimes demonstrated better contrast of cell margins and subcellular structures [Fig. 3(c) and 3(d)]. Subsequently, we used TDM for the majority of studies and phase-contrast digital microscopy in selected experiments with a magnification of . Fig. 3Transmission light (left) and phase-contrast (right) images of the same structure of rat mesentery. (a) and (b) Lymph microvessel with the open valve at the magnification . (c) and (d) Cell in interstitial space (shown by arrow) at the magnification .  Depending on lymph flow velocity and vessel structure, distribution of cells in the cross-section of microvessel in the central part of the lymphangion was different. Most often, at relatively low velocity and/or at the nonworked valves, cell distribution was relatively uniform, (80% of cases) [Fig. 4(a) ]. However, at high velocity and/or functioning valves, most cells were concentrated in the central region of the vessel (axial flow) (20% of cases) [Fig. 4(b)]. In the valvular region the “funnel” shape of valve provided the constriction of lymph flow (Fig. 5 ). Fig. 4The cell distribution in lymph flow in central part of a lymphangion in norm. (a) Relatively uniform distribution; (b) concentration cell along centerline near vessel axial.  Fig. 5The distribution of flowing cells in different parts of a lymphangion. (a) The uniform distribution in central part; (b) concentration of cells near valve area.  The reasonable temporal resolution and size of the field of view permitted us to determine directly the linear velocity of lymph flow in small lymphatics by video-recording cell movement (as a ratio of the distance moved to the time of movement). Our imaging system allowed us to obtain basic information on lymph microcirculation and quantitative data on intravital lymphatic function to determine many indices of phasic contraction and valve function, number of microvessels with lymph flow, number of cells in lymph, and the most objective criteria of lymph drainage function. The most significant data on microlymphatics in norm are summarized in Table 1 . To image single cells and their interaction in flow, we used high magnifications: , , and with water immersion. By changing the position of the focal plane, we could monitor different cross-sections of lymph microvessels, including the “up” and “down” parts of the lymphatic wall and central cross-sections of lymphatic lumen with several cells (Fig. 6 ). We could also estimate the approximate distance between top and bottom walls, as well as measure cell velocity in different locations of cross-section. Fig. 6Images of different layers of lymph microvessel (diameter ), magnification of objective , water immersion.  Table 1Data on microlymphatics in norm.
With advanced microobjective (high magnification , high N.A. 1.25, and water immersion) the obtained in vivo resolution was around . It was verified by analyzing specific diffraction pattern around particles with known sizes such as gold particles with sizes 100 and , and polystyrene beads (not shown). Such high resolution allowed us to estimate the size and shape of moving single cells (Fig. 7 ). In particular, we recorded the marked amount of RBCs in lymph flow of intact microvessels. The moving leucocytes and erythrocytes with their specific shapes (typically, a round shape for leucocytes, including lymphocytes and discoid—for normal RBCs) were easily identified. However, on contrary to strongly absorbing RBCs in visible range, relatively low absorbing lymphocytes in lymph flow were imaged as smooth, relatively transparent spots, so it was possible to observe the bottom lymph wall elongated structure through the cell [arrow in Fig. 7(b)]. Fig. 7High-resolution transmission images of moving single leukocytes (top) and RBCs (bottom) in lymph flow at the different position of cells [area A in Fig. 2(a)]. Magnification (left) and (right). The cell in lymph flow looks transparent: the structure of down part of lymphatic wall clearly visualized through cell [as shown by arrow in (b)].  This technique also allowed us to monitor the rotation of a single RBC by capturing its successive images. For example, Figs. 7(c) and 7(d) show two different angle position of the same RBC. The edge, contour, and shape of the lymphatic wall and valve leaflets are visualized with a high contrast, but intracellular structures and holes in the vascular walls cannot be well imaged (Fig. 8 ). Fig. 8The high-resolution transmission images of vascular structures. (a) Lymphatic walls [area B in Fig. 2(b)], arrows show margins of wall. (b) Lymphatic valve [area C in Fig. 2(b)], arrows show valve leaflets, white line—shape of leaflets.  High-resolution imaging at the high magnifications of the objectives ( , , and ) allowed us to visualize intralymphatic cell aggregation in intact microlymphatics. As can be seen in Fig. 9 , we observed the aggregates of different sizes. The nature of these moving aggregates is likely related with groups of leukocytes and RBCs, but the cause of their aggregation and its dependence on different factors requires additional detail study.46 For comparison, we also obtained images of cells in blood microvessels (Fig. 10 ) and in interstitial space (Fig. 11 ). In particular, we could visualize RBCs, rolling of leucocytes in small venules, and platelets in blood capillaries (Fig. 10). We obtained also high-resolution images of some nonmoving cells, such as fibroblasts and mast cells [Fig. 11(a)] and adipocytes [Fig. 11(b)], in interstitial space. As expected, the use of CCD camera with a relatively low temporal resolution prevented us from distinguishing separate cells in blood microvessels with a diameter . This was especially true in arterioles, where mean cell concentration and flow velocity is relatively high (up to ). The imaging of such fast moving cells requires a relatively high speed CCD camera with a frame rate in the range . Although in current paper we focused mostly on study microlymphatics with relatively low cell velocity, recently we upgraded our integrated system by incorporation a highly sensitive CCD camera Cascade 650 with increased speed and a short exposure time . Figures 12(a) and 12(b) illustrate our first attempt to obtain clear images of relatively fast moving RBCs in blood flow that could not be visualized [Fig. 12(c)] at a longer exposure . We found also that this technique has a potential to distinguish deformability of RBCs in flow in vivo by analyzing their dynamic shape changes. Fig. 12The high-resolution transmission images of single moving RBCs in small arteriole (mean diameter ) with relatively fast flow velocity at the short time exposures of frame , rate (a) and (b). White line shows internal margin of a vascular wall, magnification with water immersion. In comparison, (c) shows an image of the same microvessel at an exposure of : clear images of the individual flowing cells could not be obtained. 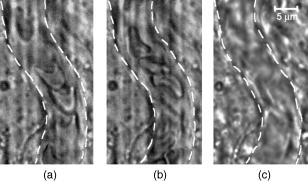 Fig. 11The high-resolution transmission images of fibers and cells of mesenteric interstitial space (a) (magnification ) and fat cells (b) (magnification ). 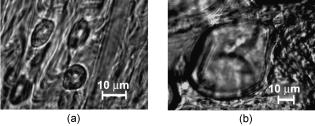 Fig. 10The images of moving cell in a blood microvessel with relatively slow flow velocity. (a) Endothelial cells of vascular wall, flowing platelets, and RBCs in small venula (mean diameter , velocity ), white dashed line shows internal margin of vascular wall. (b) Two subsequent frames (top and bottom ) of leukocyte images in venula (mean diameter , mean flow velocity ): probably adhesion of first leukocyte (positions A are the same in top and bottom figures, i.e. in first and second frames) and rolling of the second leukocyte (the change of shape and position of cell [position B] is seen in top and bottom images. 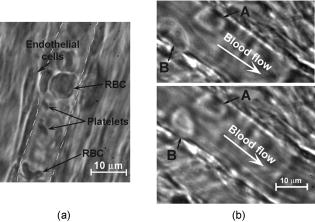 4.DiscussionThe data presented provide evidence that combination of TDM with the rat mesentery as an animal model is a unique technical and biological platform for the study of blood cells in blood and lymph microflows with a high optical resolution. Besides, this model allows one to study simultaneously microlymphatic function in norm and in pathological states (as we previously demonstrated with a lower resolution29, 30, 32). In particular, the main mesenteric microstructures (lymph vessel diameter in different sections, valve geometry, single moving cells, etc.) and their dynamics (wall motion, valve function/parameters, phasic contractions, cell velocity, etc.) can be imaged and monitored in real time. The data obtained using high magnification allowed us to determine size, shape, and aggregation of various cell types, as well as cell concentration in lymph flow. Additionally, we will probably be able to study cell-cell and cell-wall interactions, as well as the number of active lymphatics (with lymph flow), rate of flow oscillations, mean lymph flow velocity, and relation of forward and backward flow using TDM. The imaging of rotating cells opens the way to realize projection tomography in vivo for reconstruction of 3-D cell images, when necessary capturing of images at different angles is realized simply during natural cell rotations in a flow. The continuous monitoring of modification of cell’s shape in blood flow allows one to develop algorithms to study the deformability of these cells in flow in vivo, which is important for many applications, including fundamentals of cell dynamic in flow, early diagnosis of some diseases, or identification of abnormal cells (e.g., metastatic cancer cells). According to obtained data, there is no doubt that imaging some intracellular structural detail in cells containing relatively strong-absorbing chromophores, such as RBCs with hemoglobin, can be accomplished with TDM. However, studies of much lower absorbing individual cells (e.g., white blood cells, or various cancer cells) in the visible and near-IR spectral range with TDM are limited because of their relatively low absorption sensitivity due to the short optical path of light in cellular microstructures and the limited accuracy in measuring the small variations in light energy transmitted through these structures.47, 48 For example, to measure absorption in a -long optical path (e.g., average diameter elongated mitochondria) with a typical 5% accuracy in light variation, a minimum detectable coefficient of absorption would be approximately ,47 which is a few orders higher than absorbing cellular structures in white blood cells with a typical coefficient of absorption in the visible spectral range of .45, 49 Evidently, this level of cell absorption is insufficient to get contrast images. However, because of scattering phenomena, TDM technique allows one to image clearly the boundaries of such cells and even distinguish their shapes. We discovered that the lymph of intact microvessels of narcotized rats contained markedly greater amounts of RBCs. To our knowledge, there was no discussion in the available literature of the appearance of RBCs in microlymphatics, although these data are important for understanding in vivo lymph rheology at the microvascular level, or dependence of the vessel’s permeability on different factors. However, at present, many questions remain. In particular, what are the reasons for the aggregation and appearance of RBCs in lymph (is this a physiological state or the consequence of anesthesia and preparation procedures), how does the number of RBCs and their ability to aggregate affect the numbers, sizes, and quality of aggregates, and finally, how does aggregate formation and intravascular changes of viscosity, as a whole, change lymph flow in microcirculation and the local balance of water in tissue? The measurement of flow velocity with TDM by video-recording of cells movements may be limited by a several factors: (1) the high cell concentrations in flow, which prevents tracking of a single cell position with a high accuracy; (2) change of a transverse position of a moving cell in vessel’s cross-sections with different velocity profiles; and (3) mismatch of plasma flow velocity and a cell itself. In particular, in microlymphatics with nonregular flow and its directions, the velocity of cells should be less than plasma flow velocity when flow starts to move because of a cell’s inertia. On the contrary, at flow stopping cell velocity is higher than that of plasma. Thus, a high-resolution TDM technique provides important information of cell margins, sizes, and shapes in flows, although has some limitations with imaging of low absorbing structures and measurement of flow velocities. To overcome these limitations of TDM, we recently suggested combining TDM with PT technique,44, 45 which supplement each other beneficially and provide simultaneous study both low and strongly absorbing cells in flow including their imaging without conventional staining and labeling (which might be limited in in vivo study), and laser scanning. In addition, this combination provides the potential for characterizing flow without use moving cells as markers, and allows one to identify normal and abnormal cells in flow based on their differences in absorption, sizes, and shapes. For the future study of lymphatics, it is important that well-developed lymphatic valves with “funnel” shape may act as a natural nozzle for the cells (Fig. 5), and thus, play the role of natural “hydrodynamic” focusing (in analogy to conventional flow cytometer in vitro) of a moving cell near a vessel axis. It will allow one to decrease the influence of cell spatial fluctuations on the quality of in vivo optical images. 5.ConclusionsWe demonstrated the use of the high-resolution TDM achievable for in vivo imaging using rat mesentery as an animal model. We explored TDM’s capability to measure the main microlymphatic parameters without labeling, with simultaneous imaging of mesenteric structures such as blood and lymph microvessels, their walls and valves, and some cells in interstitial space (mast and fat cells). Potential applications of this model may include studies of microlymphatic responses to various therapeutic and microsurgical interventions (drug, laser radiation, etc.) at the single-cell level, as well as increasing our knowledge of microlymphatics functions in norm and pathology, including primary or secondary lymphedema, lymphatic malformation, venous insufficiency, and the influence of smoking. Additionally, the capabilities of this technique using the animal model could extend to the following experimental studies: in vivo diagnosis in lymph and blood flow of (1) abnormal cells circulating in blood and lymph systems, including cancer cells (e.g., leukemia); (2) apoptotic cells; (3) changes in RBC properties; (4) modified cells after drug, toxic, or x-ray radiation; and (5) pathogenic bacteria and virus. AcknowledgmentsThis is work was supported by a grant from the National Institutes of Health (EB001858) and by CRDF grant REC-006. The authors thank Scott Ferguson for his assistance with experimental setup and customized heated stage. ReferencesHuman Physiology, Springer-Verlag, Berlin, Heidelberg (1989). Google Scholar
S. R. Cherry,
“In vivo molecular and genomic imaging: new challenges for imaging physics,”
Phys. Med. Biol., 49 R13
–48
(2004). https://doi.org/10.1088/0031-9155/49/3/R01 0031-9155 Google Scholar
C. L. Witte,
M. H. Witte,
E. C. Unger,
W. H. Williams,
M. J. Bernas,
G. C. McNeill, and
A. M. Stazzone,
“Advance in imaging of lymph flow disorder,”
Radiographics, 20 1697
–1719
(2000). 0271-5333 Google Scholar
G. Horstick,
T. Kempf,
M. Lauterbach,
M. Ossendorf,
L. Kopacz, A. Heimann,
H. A. Lehr,
S. Bhakdi,
J. Meyer, and
O. Kempski,
“Plastic foil technique attenuates inflammation in mesenteric intravital microscopy,”
J. Surg. Res., 94 28
–34
(2000). 0022-4804 Google Scholar
Y. Sugii,
S. Nishio, and
K. Okamoto,
“In vivo PIV measurement of red blood cell velocity field in microvessels considering mesentery motion,”
Physiol. Meas, 23 403
–416
(2002). 0967-3334 Google Scholar
M. Kimura,
H. Mitani,
T. Bandoh,
T. Totsuka, and
S. Hayashi,
“Mast cell degranulation in rat mesenteric venule: effects of L-NAME, methylene blue and ketotifen,”
Pharmacol. Res., 39 397
–402
(1999). 1043-6618 Google Scholar
G. R. Cokelet,
A. R. Pries, and
M. F. Kiani,
“Observations on the accuracy of photometric techniques used to measure some in vivo microvascular blood flow parameters,”
Microcirculation (Philadelphia), 5 61
–70
(1998). 1073-9688 Google Scholar
J. Seki,
“Flow pulsation and network structure in mesenteric microvasculature of rats,”
Am. J. Physiol., 266 H811
–821
(1994). 0002-9513 Google Scholar
A. Celi,
G. Merrill-Skoloff,
P. Gross,
S. Falati,
D. S. Sim,
R. Flaumenhaft,
B. C. Furie, and
B. Furie,
“Thrombus formation: direct real-time observation and digital analysis of thrombus assembly in a living mouse by confocal and widefield intravital microscopy,”
J. Thromb. Haemost., 1 60
–68
(2003). Google Scholar
M. J. Crowe,
P. Y. Vonderweid,
J. A. Brock, and
D. F. Vanhelden,
“Co-ordination of contractile activity in guinea-pig mesenteric lymphatics,”
J. Physiol. (London), 500 235
–244
(1997). 0022-3751 Google Scholar
N. G. McHale and
M. K. Meharg,
“Co-ordination of pumping in isolated bovine lymphatic vessels,”
J. Physiol. (London), 450 503
–512
(1992). 0022-3751 Google Scholar
D. F. Vanhelden,
“Pacemaker potentials in lymphatic smooth muscle of the guinea-pig mesentery,”
J. Physiol. (London), 471 465
–479
(1993). 0022-3751 Google Scholar
P. Y. Vonderweid,
M. J. Crowe, and
D. F. Vanhelden,
“Endothelium-dependent modulation of pacemaking in lymphatic vessels of the guinea-pig mesentery,”
J. Physiol. (London), 493 563
–575
(1996). 0022-3751 Google Scholar
J. Eisenhoffer,
Z.-Y. Yuan, and
M. G. Johnston,
“Evidence that the L-arginine plays a role in the regulation of pumping activity in bovine mesenteric lymphatic vessels,”
Microvasc. Res., 50 249
–259
(1995). 0026-2862 Google Scholar
A. Koller,
R. Misumo, and
G. Kaley,
“Flow reduces the amplitude and increases the frequency of lymphatic vasomotion: role of endothelial prostanoids,”
Am. J. Physiol., 277 R1683
–R1689
(1999). 0002-9513 Google Scholar
J. N. Benoit,
D. C. Zawieja,
A. H. Goodman, and
H. J. Granger,
“Characterization of intact mesenteric lymphatic pump and its responsiveness to acute edemagenic stress,”
Am. J. Physiol., 257 H2059
–H2069
(1989). 0002-9513 Google Scholar
J. N. Benoit,
“Relationship between lymphatic pump flow and total lymph flow in the small intestine,”
Am. J. Physiol., 261 H1970
–H1978
(1991). 0002-9513 Google Scholar
Yu. Shirasawa,
F. Ikomi, and
T. Ohhashi,
“Physiological roles of endogenous nitric oxide in lymphatic pump activity of rat mesentery in vivo,”
Am. J. Physiol., 278 G551
–G556
(2000). 0002-9513 Google Scholar
N. Ono,
R. Mizuno,
H. Nojiri, and
T. Ohhashi,
“Development of an experimental apparatus for investigating lymphatic pumping activity of murine mesentery in vivo,”
Jpn. J. Physiol., 50 25
–31
(2000). https://doi.org/10.2170/jjphysiol.50.25 0021-521X Google Scholar
D. A. Berk,
M. A. Swartz,
A. J. Leu, and
R. K. Jain,
“Transport in lymphatic capillaries. II. Microscopic velocity measurement with fluorescence photobleaching,”
Am. J. Physiol., 39 H330
–H337
(1996). 0002-9513 Google Scholar
E. Sekizuka,
C. Ohshio, and
H. Minamitani,
“Automatic analysis of moving images for the lymphocyte velocity measurement,”
Microcirculation annua, 107
–108 1995). Google Scholar
V. Schacht,
D. Berens von Rautenfeld, and
C. Abels,
“The lymphatic system in the dorsal skinfold chamber of the Syrian golden hamster in vivo,”
Arch. Dermatol. Res., 295 542
–548
(2004). 0340-3696 Google Scholar
L. Richard and
M. D. McCann,
“Disorders of the lymphatic system,”
Textbook of Surgery, 1573
–1577
(2000) Google Scholar
C. L. Witte and
M. H. Witte,
“Disorders of lymph flow,”
Acad. Radiol., 2 324
–334
(1995). https://doi.org/10.1046/j.1462-2920.2000.00111.x 1076-6332 Google Scholar
A. Bollinger,
I. Herrig,
M. Fisher,
U. Hoffmann, and
U. K. Franzeck,
“Intravital capillaroscopy in patients with chronic venous insufficiency and lymphedema,”
Int. J. Microcirc.: Clin. Exp., 15 41
–44
(1995). 0167-6865 Google Scholar
M. Hochman,
E. Vural, and
J. Suen,
“Contemporary management of vascular lesions of the head and neck,”
Curr. Opin. Otolaryngol. Head Neck Surg., 7 161
–166
(1999). Google Scholar
A. Kayikçioglu,
S. Karamürsel,
T. Safak,
E. Mavili, and
Y. Erk,
“Lymphatic malformation causing intractable chylorrhagia,”
Plast. Reconstr. Surg., 105 1422
–1425
(2000). 0032-1052 Google Scholar
S. J. Pain and
A. D. Purushotham,
“Lymphoedema following surgery for breast cancer,”
Br. J. Surg., 87 1128
–1141
(2000). https://doi.org/10.1046/j.1365-2168.2000.01569.x 0007-1323 Google Scholar
E. I. Galanzha,
S. S. Ulyanov,
V. V. Tuchin,
G. E. Brill,
A. V. Solov’eva, and
A. V. Sedykh,
“Comparison of lymph and blood flow in microvessels: coherent optical measurements,”
Proc. SPIE, 4163 94
–98
(2000). 0277-786X Google Scholar
E. I. Galanzha,
G. E. Brill,
Y. Aizu,
S. S. Ulyanov, and
V. V. Tuchin,
“Speckle and Doppler methods of blood and lymph flow monitoring,”
Handbook of Optical Biomedical Diagnostics, PM107 875
–937 SPIE Press, Bellingham, WA (2002). Google Scholar
E. I. Galanzha,
V. V. Tuchin,
V. P. Zharov,
A. V. Solovieva,
T. V. Stepanova, and
G. E. Brill,
“The diagnosis of lymph microcirculation on rat mesentery in vivo,”
Proc. SPIE, 4965 325
–333
(2003). 0277-786X Google Scholar
E. I. Galanzha,
V. V. Tuchin,
A. V. Solov’eva, and
V. P. Zharov,
“Development of optical diagnostics of microlymphatics at the experimental lymphedema: comparative analysis,”
J. X-Ray Sci. Technol., 10 215
–223
(2002). 0895-3996 Google Scholar
E. I. Galanzha,
V. V. Tuchin,
P. Chowdhury, and
V. P. Zharov,
“Monitoring of small lymphatics function under different impact on animal model by integrated optical imaging,”
Proc. SPIE, 5474 204
–214
(2004). 0277-786X Google Scholar
A. Barty,
K. A. Nugent,
D. Paganin, and
A. Roberts,
“Quantitative optical phase microscopy,”
Opt. Lett., 23 817
–819
(1998). 0146-9592 Google Scholar
U. Brand and
W. Hillmann,
“Calibration of step height standards for nanometrology using interference microscopy and stylus profilometry,”
Precis. Eng., 17 22
–33
(1995). https://doi.org/10.1016/0141-6359(94)00003-I 0141-6359 Google Scholar
G. N. Vishnyakov,
K. S. Zakaryan,
G. G. Levin, and
E. A. Streletckaya,
“Study of optically transparent samples with Linnik tomographic microscope,”
Izmer. Tekh., 46
–49
(1999). 0368-1025 Google Scholar
E. Cuche,
P. Marquet,
P. J. Magistretti, and
C. D. Depeursinge,
“Quantitative phase contrast microscopy of living cells by numerical reconstruction of digital holograms,”
Proc. SPIE, 3604 84
–89
(1999). 0277-786X Google Scholar
M. C. Shih,
C. T. Lian, and
J. S. Hwang,
“Application of phase contrast microscopy to the study of marine microbiota,”
Proc. SPIE, 4082 241
–245
(2000). 0277-786X Google Scholar
Handbook of Biological Confocal Microscopy, 2nd ed.Plenum Press, New York (1995). Google Scholar
R. H. Webb,
“Confocal optical microscopy,”
Rep. Prog. Phys., 59 427
–471
(1996). https://doi.org/10.1088/0034-4885/59/3/003 0034-4885 Google Scholar
J. S. Nelson,
K. M. Kelly,
Y. Zhao, and
Z. Chen,
“Imaging blood flow in human port-wine stain in situ and in real time using optical Doppler tomography,”
Arch. Dermatol., 137 741
–744
(2001). 0003-987X Google Scholar
A. Castenholz,
“Functional microanatomy of initial lymphatics with consideration of the extracellular matrix,”
Lymphology, 31 101
–118
(1998). 0024-7766 Google Scholar
S. Kato,
“Organ specificity of the structural organization and fine distribution of lymphatic capillary networks: histochemical study,”
Histol. Histopathol, 15 185
–197
(2000). 0213-3911 Google Scholar
V. Zharov,
E. Galanzha, and
V. Tuchin,
“Photothermal image flow cytometry in vivo,”
Opt. Lett., 30 628
–630
(2005). https://doi.org/10.1364/OL.30.000628 0146-9592 Google Scholar
V. Zharov,
E. Galanzha, and
V. Tuchin,
“Photothermal imaging of moving cells in lymph and blood flow in vivo animal model,”
Proc. SPIE, 5320 185
–195
(2004). 0277-786X Google Scholar
A. V. Priezzhev,
O. M. Ryaboshapka,
N. N. Firsov, and
I. V. Sirko,
“Aggregation and disaggregation of erythrocytes in whole blood: study by backscattering technique,”
J. Biomed. Opt., 4 76
–84
(1999). https://doi.org/10.1117/1.429923 1083-3668 Google Scholar
V. P. Zharov and
V. S. Letokhov, Laser Optoacoustic Spectroscopy, Springer-Verlag, Berlin (1986). Google Scholar
V. P. Zharov,
“Laser optoacoustic spectroscopy in chromatography,”
Laser Analytical Spectrochemistry, 229
–271 Bristol, Boston, Mass (1986). Google Scholar
V. V. Tuchin, Tissue Optics: Light Scattering Methods and Instruments for Medical Diagnosis, TT38 SPIE Press, Bellingham, WA (2000). Google Scholar
|
||||||||||||||||||||||||||||||||||||||||||||||||||||||||||||||||


