
|
|
1.Backgrounds and ObjectiveA treatment plan for severe burn injuries should be determined on the basis of information on the depth of tissue damage, and early diagnosis of burn depth after injury is therefore required. The usefulness of various optical methods for this purpose, including laser Doppler imaging1, 2, 3 (LDI), fluorescence imaging,4, 5 and polarization-sensitive optical coherence tomography6 (PS-OCT) has been investigated. LDI enables measurement of the rate of flow of blood in skin, but burn depth cannot be diagnosed quantitatively by LDI. In fluorescence imaging, indocyanin green (ICG) that has leaked from the blood vessels in injured tissue is detected by its fluorescence obtained by light excitation, but no quantitative depth information on burns can be obtained. PS-OCT enables determination of changes in optical birefringence in injured tissue, but its sampling depth is not sufficient to diagnose deep burn injuries. We previously proposed a new method for burn depth diagnosis that was based on the measurement of a photoacoustic (PA) signal originating from the blood in the injured skin.7 PA imaging is based on acoustic waves generated at chromophores that adiabatically absorb pulsed light; a typical chromophore in tissues is hemoglobin in blood in the visible spectral region.8, 9, 10, 11, 12 Since the spatial resolution of PA imaging is determined by the propagation of acoustic waves, not by the propagation of light, the resolution of PA imaging is much higher than that of pure optical imaging such as diffuse light tomography. Thus, quantitative depth information on blood even in the subcutaneous fat layer can be obtained by this method. For PA skin diagnosis, depth determinations of hemoglobin and pigmentation in skin have been reported.13, 14 In our previous work,15 light pulses with a constant wavelength of were used to excite blood-originating PA signals for burned tissue, and the measurement was made on a point-by-point basis, giving only a 1-D depth profile of the PA signal at a certain point. The diagnosis capability is thought to be sensitively dependent on the wavelength, because the absorption coefficient of blood varies, depending on the wavelength. It is therefore important to determine the optimum wavelength to ensure reliable diagnosis. In this study, we investigated the optimum light wavelength for PA burn diagnosis, and we obtained a 2-D PA signal, i.e., a PA tomogram, by measurement with the scanning of a PA detector. Site-dependent depth information on an injury, which is useful for extended burn diagnosis, can be obtained on the basis of PA tomograms. 2.PrincipleIn cases of burned skin, the tissue coagulates by the heat effect and the blood flow is blocked. Thus, it is thought that the thickness of skin tissue that has no blood flow, i.e., the zone of stasis, increases as burn depth increases. Therefore, by irradiating a wound with pulsed light that is selectively absorbed by hemoglobin in the blood, a PA wave can be induced in the uninjured tissue under the injured tissue through a thermoelastic process. Here, the propagation time of the blood-originating PA wave indicates the depth of uninjured tissue and hence the depth of the burn. The peak amplitude of the PA signal is proportional to the absorption coefficient of hemoglobin, the absorption spectrum of which is shown16 in Fig. 1 . A PA wave is generated efficiently when the pulse width of light meets the following criterion: where is the diameter of a specific structure such as a blood vessel or the light penetration depth , whichever is smaller. For most biological tissues, is assumed17 to be about . Typical diameters of blood vessels in skin are in the range of and the maximum blood absorption coefficient in the visible spectral range is about . Therefore, a pulse width shorter than meets the criterion of Eq. 1. In PS-OCT, the sampling depth is limited to about . By using the PA method, hemoglobin in the entire human skin depth can be monitored, because a PA wave is propagated efficiently in the tissue. This is a great advantage for diagnosis of burns in humans.Fig. 1Absorption coefficient of oxyhemoglobin and deoxyhemoglobin.9 The coefficient of oxyhemoglobin shows peaks at 542 and . 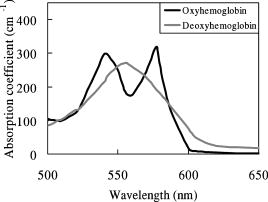 3.Materials and MethodsThe experimental setup is shown in Fig. 2 . We used an optical parametric oscillator (OPO; pulse width, ; repetition rate, ) as a light source. Its pulse energy was adjusted to with a variable attenuator and coupled to an optical fiber with a core diameter of . A ring-shaped P(VdF/TrFE) [poly(vinylidene tri-fluoride ethylene)] film (inner diameter, ; outer diameter, ; thickness, ) was used to detect PA signals. A ring-shaped piezoelectric film has a narrow detectable angle, which increases the lateral resolution in PA imaging.18 Between the piezoelectric film and the skin, a -thick acrylic board was used as a spacer. To reduce the acoustic reflection, an epoxy polymer was used as a backing material. The electromechanical coupling factor of P(VdF/TrFE) is 1.5 times higher than that of PVdF, and P(VdF/TrFE) therefore has a higher sensitivity than that of PVdF. In the detector, the output end of the fiber and the piezoelectric film were coaxially arranged. PA signals were amplified with a field effect transistor (FET) amplifier and then monitored with a digital oscilloscope (Sony Techtronics TDS3054B) with a frequency range of and sampling rate of . At each point on the wound, PA measurement was successively performed twice; in each measurement, signals induced by 64 light pulses were averaged, with the total number of irradiated light pulses being 128 at each point of measurement. Light wavelengths tested in this study were 500, 532, 550, 560, 580, 600, and , and PA signals induced by light pulses at these wavelengths were compared. We investigated the correlation between the PA spectrum and the absorption spectrum of hemoglobin. The PA detector was scanned on the wound over in length with a interval. PA signals obtained at each point were reconstructed using MATLAB (ver 6.1, The Mathworks) to obtain a tomogram, where spline interpolation was used. Fig. 2Experimental setup for the PA measurement of burned skin in rats. An acoustic couplant was used for the interface between the detector and skin surface.  For animal burn models, -old male Wistar rats weighing were used. The rats were anesthetized by intraperitoneal injection of pentobarbital sodium ( animal weight). Dorsal hair was clipped and depilated with hair removal cream. A -sized superficial dermal burn (SDB), deep dermal burn (DDB), or deep burn (DB) was made by immersing dorsal skin in heated water at 70, 78, or , respectively, for by using a Walker-Mason template.19 To confirm the burn depth, we previously performed punch biopsy for the burned skin and conducted histological analysis for the tissue with hematoxylin and eosin (H&E) staining; the histologies and findings are given in Ref. 15. In short, for an SDB, only the epidermis and the superficial part of the skin appendages were injured. The intricate interwoven pattern of collagen fibers was retained in most of the dermis. For a DDB, the epidermis and the upper two-thirds of the dermis were injured. The injured dermis showed coagulation necrosis, namely, eosinophilia and fusion of necrotic collagen fibers. At the junction of nonviable and viable tissues, potent capillaries were retained. For a DB coagulation necrosis involved the entire thickness of the skin, including almost all of the sebaceous glands, and a large part of the subcutaneous fat layer. All of the dermis showed coagulation necrosis with eosinophilia and fusion of necrotic collagen fibers. At the junction of nonviable and viable tissues, that is, the junction between the zones of subcutaneous fat and muscle, potent but dilated capillaries were seen. Histological analysis was also performed in this study; and the results were very similar to those obtained in the previous study (data not shown). Immediately after making burns, saline ( animal weight) was intraperitoneally injected for resuscitation. To obtain a control signal, we performed PA measurement on healthy skin; in this case, no resuscitation was applied. We also investigated the wavelength dependence of the maximum signal amplitude in each tomogram. 4.Results and DiscussionFigure 3 shows the wavelength dependence of the peak amplitude of PA signals in the spectral range of for SDB, DDB, DB, and control skin. In all cases, signal amplitudes in the spectral range of were higher than those at wavelengths of 500, 600, and . This tendency agrees well with the absorption spectrum of hemoglobin shown in Fig. 1, indicating that the observed PA signals originated from the blood in skin. In addition, for DDB and DB, signal amplitudes at were lower than those at , suggesting that signals were dominantly induced by oxyhemoglobin, not by deoxyhemoglobin. At 600 and , peak signal amplitudes for DB were higher than those for SDB, DDB, and control skin. This may be due to the fact that optical penetration depths at 600 and were greater than those in the spectral range of , and the fact that the amount of blood in subcutaneous tissue is greater than that in the dermis. Fig. 3Wavelength dependence of the photoacoustic signal amplitudes for (a) healthy skin, (b) SDB, (c) DDB, and (d) DB. PA signal amplitude becomes high in the range of .  Figure 4 shows PA tomograms for DDB at postburn in the spectral range of . Spatial resolutions were estimated to be in the depth direction and in the lateral direction; the former was determined by the thickness of the piezoelectric film and the latter was limited by the spot size of light. In these tomograms, layers of high-amplitude signal appeared in the depth region of . Signal amplitudes in the spectral range of were higher than those at other wavelengths. On the basis of these findings, we selected as the optimum wavelength for the diagnosis. Fig. 4PA tomograms for deep dermal burn in rats at (a) 500, (b), 532, (c), 550, (d) 560, (e) 580, (f) 600, and (g) . The horizontal axis and vertical axis indicate position on the skin surface and depth from the skin surface, respectively. The region of highest PA signal amplitude is shown in red. A layer of high-amplitude signal is observed at a depth of .  By using light pulses at this wavelength, PA tomograms for all burn models were obtained at postburn (Fig. 5 ). For the normal skin [Fig. 5(d)], three layers of high-amplitude signals were observed, indicating the existence of blood perfusion in these layers. All of the tomograms show nonuniform PA signal distributions in spite of the uniform heating used to make burns [Figs. 5(a), 5(b), 5(c)]; the nonuniform signal distributions are thought to reflect the distribution of blood vessels in the skin. In the boundary between the burned tissue and healthy tissue, blood cells might be leaked from damaged blood vessels and not only hemoglobin inside the blood vessels but also hemoglobin outside the blood vessels can be monitored by PA measurement. As a result, contrast of the PA tomogram in the boundary region might become higher compared with that in other regions. Although no special algorithm was used to reconstruct PA signals, the tomograms clearly show the zones of stasis, by which burn depths can be assessed quantitatively. Burn depths assessed by the tomograms agreed with the results of histological analysis; the zones of stasis coincided with the nonviable tissue regions in the histologies. Fig. 5PA tomograms for (a) SDB, (b) DDB, (c) DB, and (d) healthy skin in rats at postburn. The wavelength was . At a depth of about , a signal originating from pigmentation in the skin appeared. For healthy skin, a signal originating from hemoglobin appeared at depths of , , and . For burned skins, the zone of stasis is clearly shown, suggesting that 2-D PA measurement is useful for burn depth assessment.  5.ConclusionsWe performed measurement of PA signals for burns in rats and investigated the wavelength dependence of PA signals. The PA spectrum showed a tendency that was similar to that of the absorption spectrum of hemoglobin, indicating that the PA signals originated from the hemoglobin in skin tissue. The optimum wavelength for burn depth estimation was found to be in the range of . At , a PA detector was scanned on the wounds and PA tomograms were obtained. The tomograms clearly showed zones of stasis, suggesting that the 2-D PA measurement is useful for burn depth assessment. ReferencesW. R. Schiller,
R. L. Garren,
R. C. Bay,
M. H. Ruddell,
G. A. Holloway Jr.,
A. Mohty, and
C. A. Luekens,
“Laser Doppler evaluation of burned hands predicts need for surgical grafting,”
J. Trauma: Inj., Infect., Crit. Care, 43 35
–40
(1997). https://doi.org/10.1097/00005373-199707000-00010 1079-6061 Google Scholar
S. A. Pape,
C. A. Skouras, and
P. O. Byrne,
“An audit of the use of laser Doppler imaging (LDI) in the assessment of burns of intermediate depth,”
Burns, 27 233
–239
(2001). 0305-4179 Google Scholar
F. W. Kloppenberg,
G. I. Beerthuizen, and
H. J. ten Duis,
“Perfusion of burn wounds assessed by laser Doppler imaging is related to burn depth and healing time,”
Burns, 27 359
–363
(2001). 0305-4179 Google Scholar
R. L. Sheridan,
K. T. Schomaker,
L. C. Lucchina,
J. Hurley,
L. M. Yin,
R. G. Tompkins,
M. Jerath,
A. Torri,
K. W. Greaves, and
D. P. Bua,
“Burn depth estimation by use of indocyanine green fluorescence: Initial human trial,”
J. Burn Care Rehabil., 16 602
–604
(1995). 0273-8481 Google Scholar
J. M. Still,
E. J. Law,
K. G. Klavuhn,
T. C. Island, and
J. Z. Holtz,
“Diagnosis of burn depth using laser-induced indocyanine green fluorescence: a preliminary clinical trial,”
Burns, 27 364
–371
(2001). 0305-4179 Google Scholar
J. F. de Boer,
T. E. Milner,
M. J. C. van Gemert, and
J. S. Nelson,
“Two-dimensional birefringence imaging in biological tissue by polarilization-sensitive optical coherence tomography,”
Opt. Lett., 22 934
–936
(1997). 0146-9592 Google Scholar
S. Sato,
T. Shimada,
T. Arai,
M. Kikuchi,
M. Obara, and
H. Ashida,
“Measurement of photoacoustic signals from skin: Potential application to burn depth estimation,”
Proc. SPIE, 4434 8
–12
(2001). https://doi.org/10.1117/12.446677 0277-786X Google Scholar
R. G. M. Kolkman,
E. Hondebrink,
W. Steenbergen, and
F. F. M. de Mul,
“In vivo photoacoustic imaging of blood vessels using an extreme-narrow aperture sensor,”
IEEE J. Sel. Top. Quantum Electron., 9 1
–4
(2003). https://doi.org/10.1109/JSTQE.2003.813302 1077-260X Google Scholar
R. A. Kruger,
W. L. Kiser,
D. R. Reinecke,
G. A. Kruger, and
K. D. Miller,
“Thermoacoustic optical molecular imaging of small animals,”
Molecular Imaging, 2 113
–123
(2003). https://doi.org/10.1162/153535003322331993 1535-3508 Google Scholar
J. J. Niederhauser,
M. Jaeger, and
M. Frenz,
“Comparison of laser-induced and classical ultrasound,”
Proc. SPIE, 4960 118
–123
(2003). https://doi.org/10.1117/12.483509 0277-786X Google Scholar
A. A. Oraevsky,
A. A. Karabutov,
S. V. Solomatin,
E. V. Savateeva,
V. G. Andreev,
Z. Gatalica,
H. Singh, and
R. D. Fleming,
“Laser optoacoustic imaging of breast cancer in vivo,”
Proc. SPIE, 4256 6
–15
(2001). https://doi.org/10.1117/12.429300 0277-786X Google Scholar
X. D. Wang,
Y. J. Pang,
G. Ku,
G. Stoica, and
L. V. Wang,
“Three-dimensional laser-induced photoacoustic tomography of mouse brain with the skin and skull intact,”
Opt. Lett., 28 1739
–1741
(2003). 0146-9592 Google Scholar
J. A. Viator,
B. Choi,
M. Ambrose,
J. Spanier, and
J. S. Nelson,
“In vivo port-wine stain depth determination with a photoacoustic probe,”
Appl. Opt., 42 3215
–3224
(2003). 0003-6935 Google Scholar
K. Maslov,
G. Stoica, and
L. V. Wang,
“In vivo dark-field reflection-mode photoacoustic microscopy,”
Opt. Lett., 30 625
–627
(2005). https://doi.org/10.1364/OL.30.000625 0146-9592 Google Scholar
S. Sato,
M. Yamazaki,
D. Saitoh,
H. Tsuda,
Y. Okada,
M. Obara, and
H. Ashida,
“Photoacoustic diagnosis of burns in rats,”
J. Trauma,
(0022-5282) Google Scholar
M. Kohl,
U. Lindauer,
G. Royl,
M. Kuhl,
L. Gold, and
A. Villringer,
“Physical model for the spectroscopic analysis of cortical intrinsic optical signals,”
Phys. Med. Biol., 45 3749
–3764
(2000). https://doi.org/10.1088/0031-9155/45/12/317 0031-9155 Google Scholar
W. F. Cheng,
“Summary of optical properties,”
Optical-thermal Response of Laser-Irradiated Tissue, Plenum Press, New York (1995). Google Scholar
C. G. A. Hoelen and
F. F. M. de Mul,
“Imaging of cutaneaous blood vessels using photoacoustic tissue scanning (PATS),”
Proc. SPIE, 3566 134
–142
(1998). https://doi.org/10.1117/12.334361 0277-786X Google Scholar
H. L. Walker and
A. D. Mason,
“A standard animal model,”
J. Trauma, 8 1049
–1051
(1968). 0022-5282 Google Scholar
|


