|
|
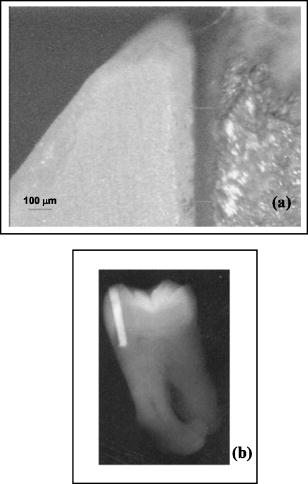
1.IntroductionOptical coherence tomography (OCT) is a well-established low-coherence interferometric technique that performs high-resolution, noninvasive, cross-sectional tomographic imaging of tissue microstructures.1, 2, 3, 4, 5 Since OCT longitudinal resolution is inversely proportional to the light source bandwidth, the use and development of broadband sources has been increasing since its first biological application1, 6, 7, 8 in 1991. With the use of broadband sources OCT images of biological tissue can achieve resolution of few micrometers. Clinically, OCT systems are used for diagnoses in ophthalmology. In odontology, a series of reports first appeared9, 10, 11 in 1998, with imaging of both hard and soft oral tissues. This led to several diagnostics of bucal diseases, including periodontal, early caries, among others. Another area in dentistry where OCT can have important findings is in dental restoration imaging.12, 13, 14, 15 Wang 12 and Fried 13 exploited polarization-sensitive OCT to identify dental tissue/restoration interfaces. To date, there is no quantitative method capable to perform in vitro or in vivo analysis of dental restoration, particularly from the clinical point of view. Visual inspection and x-ray imaging are not precise enough to diagnose small gaps that result from bad restoration procedures. Dental tissues are highly light scattering media and scattering coefficients of enamel and dentin are and , respectively.16 IR light can penetrate the full enamel extension, enabling 2-D or 3-D OCT imaging of the tooth structure. Although in odontology, OCT is not yet clinically available—as is the case of OCT in ophtalmology, for instance—the potential of the technique promises a fast technological development that requires more laboratory evaluation, prior to clinical trials. In this paper, we report the application of OCT to dental restoration, particularly analyzing failure gaps left after the restoration has been performed. Imaging resolution of has been achieved and gaps in the interface enamel/restoration were measured. The results from the OCT were compared to 2-D images obtained with x-ray and optical microscopy. Molar dental restorations on enamel of extracted teeth were performed using composite resin and amalgam as the restoring materials. Failure gaps were set by using a -thick acetate tape during the restoration procedure. Clinically standard inlay cavity preparation can lead to marginal gaps with width varying17 from 35 to . The lower value sets the required spatial resolution and accuracy for the proposed OCT system in clinical uses, which is achieved in the present proof-of-principle experiment. Restoration gaps can also be measured in vitro by electronic microscopy technique. Using scanning electron microscopy, several authors18, 19, 20 have shown that failure gaps in dental restoration can be as narrow as and can be as wide as . Of course, the lower limit is beyond the resolution achieved by the OCT method. The higher achieved resolution of present OCT, to (Refs. 7, 8) can be used as a clinical method for in vivo evaluation of dental gaps a few micrometers wide. 2.Experimental Details and ResultsThe basic experimental scheme for the OCT used in this paper is similar to most fiber-based Michelson interferometer setups reported in the literature.6, 9 A titanium:sapphire mode-locked laser, operating at with a spectral width of and emitting pulses of , was used as the system light source. The laser beam was coupled into of a nonlinear fiber, leading to a spectral broadening, due to self-phase modulation and other nonlinear effects.6 The initial 10-nm spectral width was broadened to , which could lead to a higher longitudinal spatial resolution . In the direction, resolution can be calculated from the expression , which gives a value of . The output light from the nonlinear fiber was directed to a fiber coupler ( at ) of the fiber-based Michelson interferometer. The ends of the reference and sample arms were set on computer-controlled translation stages (ThorLabs) with 200-nm minimum displacement steps. The collimated beam of the interferometer sample arm was focused on the tooth using a lens with of focal distance, providing a lateral resolution of . The collected light on the output port of the Michelson interferometer was sent to a highly sensitive photodetector, whose output was electronically filtered, according to the translation stages speed, and amplified . Sidebands on the autocorrelation image of the fiber-based interferometer were identified as a polarization effect on the fiber coupler arms, leading to degradation on the OCT axial resolution . A better resolution could be obtained using an air-based Michelson interferometer. However, for the purposes of this demonstration, the obtained resolution sufficed. Samples of extracted molar human teeth (available at the university tooth bank, used after approval of the Ethical Committee) were sectioned and cavities were prepared reaching both enamel and dentin. A bur at a high-speed handpiece (KaVo) was used for the cavities preparation. Restorations were performed with silver amalgam (SDI) and composite resin P60 (3M). Failure gaps were purposely introduced in selected regions of the tooth enamel using -thick acetate sheets during the restoration procedure. Gaps were obtained by removing the tape from the tooth. Microscopy and x-ray analysis of the sample were performed to identify and measure the induced failure gaps. X-ray images were taken with a Spectro X0X (Dabi Atlante) and the Kodak dental films were processed. Microscope images were obtained with an upright Nikon microscope (Optihot) with a objective. Figures 1(a) and 1(b) show, respectively, microscope and x-ray images of the amalgam-treated tooth. Restoration gaps are clearly seen on the microscope images, showing gaps smaller than in the analyzed area. Although x-ray analysis shows all the restored area, the failure gaps cannot be easily identified with the x-ray imaging system used. OCT images were obtained by fixing the samples on the end of one of the arms of the interferometer, and A- and B-scans (in the direction and in the lateral direction, respectively) were performed for several samples as exemplified in Figs. 2(a) to 2(c) which show the OCT interferograms and the corresponding optical microscope images. In all figures, the air/enamel interface is displayed, followed by a decay due to the scattering loss into the enamel, and then the enamel-restoration interface appears. In Fig. 2(a), no gap was left during sample preparation and, within the resolution, no gap appears. Figures 2(b) and 2(c) show the gap in both microscope images and OCT traces. A quantitative analysis and direct comparison between the two methods (OCT and optical microscopy) is not straightforward, although the gap thickness can be easily obtained from the OCT results. To obtain these results from the microscopy images, a densitometry trace would be required. A very crude estimation from our presented results shows that the OCT data has an accuracy of approximately 10% of the total gap width, whereas from the optical microscopy measurements, this value is much higher, of the order of 30 and sometimes 40%. However, the optical microscopy resolution can easily reach (in our case, it was less than ), whereas the best resolution obtained presently with an OCT system is to . Fig. 2OCT traces and optical microscopy images from the human molar restored with (a) and (c) amalgam and (b) resin. Restoration gaps are present in images (b) and (c). 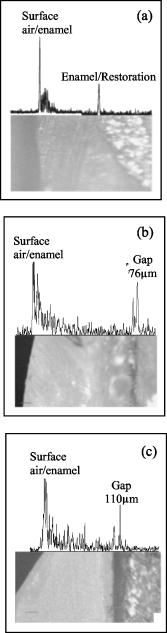 To construct 2-D images, backscattered amplitude as a function of axial position and lateral displacement were recorded, as shown in Fig. 3 , which are the results for an amalgam restoration. The gap is clearly detected, and is wider than the acetate sheet due to the process of placing and removing the acetate. Composite resin was also employed and images were obtained, yielding similar results. Fig. 3A- and B-scans of restored cavity with a purposely introduced gap. An extracted molar was used in all measurements.  To better identify restoration gaps, fast Fourier transform (FFT) smoothing of the data was applied, even though light scattered from the tissue between surface and the gap is still present in the figure. This was necessary in our experimental setup since there was an unwanted source of noise in the detection system, which can be avoided in an optimized experiment. As seen in Fig. 3, the air/enamel interface peak begins in different axial positions for different lateral areas, showing the sample surface curvature. As shown in the microscope images [Figs. 2(b) and 2(c)], restoration gaps in the teeth are not uniform in width. Our OCT results show that gap width varied from 51 to , the lower limit due to the available acetate sheet used. A view of a tooth section obtained by the OCT technique is presented in Fig. 4 , as a gray-scale map. Again, the failure gap can be clearly seen. The image in Fig. 4 was obtained by laterally displacing the sample by steps. 3.Discussion and ConclusionsDental caries are known as a multifactorial pathological process, characterized by hard tissue demineralization. Among the several classes, secondary caries appear as a result of restoration failures. If not detected earlier, secondary caries will further evolve and damage other regions (for instance, into the dentin) of the tooth. In vivo clinical evaluation is only possible by x rays, which cannot show the gap failure and depicting only the restored region [see Fig. 1(b)]. We demonstrated that gap failure in a restored tooth can be evaluated by the OCT technique, and with a system resolution of we were able to detect gaps as small as , but those of only a few micrometers would be experimentally measurable. Although we demonstrated only gaps that were about deep, the technique can image the full enamel extension, as demonstrated in earlier work at the same wavelength as used here9, 10, 11 and verified independently in our laboratory. Therefore, this required performance criteria is satisfied by the technique. The types of restorations that could be imaged by direct and indirect means, include gaps wider than the resolution of the system, which could be imaged and spatially quantified. With a more appropriated light source, in terms of wavelength, a deeper penetration would be obtained. This is the case for the use of , which can penetrate to into the tooth (see Ref. 13 and the references therein). Imaging gaps narrower than requires improvements in our incoherent light source. Furthermore, the use of OCT has the advantage of showing the restored region as well as the gap, if it exists, and precisely localizing its position, as demonstrated here. Exploitation of the recent advances in OCT in terms of different excitation wavelengths and wider bandwidths can lead to state-of-the-art imaging systems in odontology, enabling imaging of both enamel and dentin. Finally, as demonstrated in the literature,10, 11 in vivo and real-time OCT images can be obtained, and therefore this method of assessment is potentially useful for clinical diagnostics. We are currently developing a real time OCT system for such applications. AcknowledgmentsThis work has been supported by CNPq, FACEPE, and CAPES, the Brazilian Agency, and is part of the master’s degree requirement of one of the authors (LSAM), in the Odontology Graduate Program of UFPE. The authors also thank Mr. Blenio J. P. da Silva for expert help in sample preparation. ReferencesD. Huang,
E. A. Swanson,
C. P. Lin,
I. S. Schuman,
W. G. Stinson,
W. Chang,
M. R. Hee,
T. Flotte,
K. Gregory,
C. A. Puliafito, and
J. G. Fujimoto,
“Optical coherence tomography,”
Science, 254 1178
–1181
(1991). 0036-8075 Google Scholar
J. G. Fujimoto,
“Optical coherence tomography for ultrahigh resolution in vivo imaging,”
Nat. Biotechnol., 21 1361
–1364
(2003). https://doi.org/10.1038/nbt892 1087-0156 Google Scholar
M. C. Pierce,
J. Straswimmer,
B. Hyle Park,
B. Cense, and
Johannes F. de Boer,
“Advances in optical coherence tomography imaging for dermatology,”
J. Invest. Dermatol., 123 458
–463
(2004). https://doi.org/10.1111/j.0022-202X.2004.23404.x 0022-202X Google Scholar
F. G. Bechara,
T. Gambichler,
M. Stucker,
A. Orlikov,
S. Rotterdam,
P. Altmeyer, and
K. Hoffman,
“Histomorphologic correlation with routine histology and optical coherence tomography,”
Skin Res. Technol., 10 169
–173
(2004). 0909-752X Google Scholar
B. E. Bouma and
G. J. Tearney,
“Handbook of optical coherence tomography,”
Optical Coherence Tomography in Dentistry, 591
–612
(2002) Google Scholar
I. J. Hsu,
C. W. Lu,
C. R. Deng,
C. C. Yang,
C. P. Chiang,
C. W. Lin, and
Y. W. Kiang,
“Optical coherence tomography using nonlinear optics in fiber for broadband source generation,”
Opt. Commun., 212 391
–396
(2002). 0030-4018 Google Scholar
K. Bizheva,
B. Povazay,
B. Hermann,
H. Sattmann,
W. Drexler,
M. Mei,
R. Holzwarth,
T. Hoelzenbein,
V. Wacheck, and
H. Pehamberger,
“Compact, broad-bandwidth fiber laser for sub-2-micron axial resolution optical coherence tomography in the 1300-nm wavelength region,”
Opt. Lett., 28 707
–709
(2003). 0146-9592 Google Scholar
I. Hartl,
X. D. Li,
C. Chudoba,
R. K. Ghanta,
T. H. Ko,
J. G. Fujimoto,
J. K. Ranka, and
R. S. Windeler,
“Ultrahigh-resolution optical coherence tomography using continuum generation in an air silica microstructure optical fiber,”
Opt. Lett., 26 608
–610
(2001). https://doi.org/10.1038/35069118 0146-9592 Google Scholar
B. W. Colston,
M. J. Everett,
L. B. Da Silva,
L. L. Otis,
P. Stroeve, and
H. Nathel,
“Imaging of hard-and soft-tissue structure in the oral cavity by optical coherence tomography,”
Appl. Opt., 37 3582
–3585
(1998). 0003-6935 Google Scholar
B. W. Colston,
U. S. Sathyam,
L. B. Da Silva,
M. J. Everett,
P. Stroeve, and
L. L. Otis,
“Dental OCT,”
Opt. Express, 3 230
–238
(1998). 1094-4087 Google Scholar
F. I. Feldchtein,
G. V. Gelikonov,
V. M. Gelikonov,
R. R. Iksanov,
R. V. Kuranov,
A. M. Sergeev,
N. D. Gladkova,
M. N. Ourutina,
J. A. Warren Jr., and
D. H. Reitze,
“In vivo OCT imaging of hard and soft tissue of the oral cavity,”
Opt. Express, 3 239
–250
(1998). 1094-4087 Google Scholar
X. J. Wang,
T. E. Milner,
J. F. de Boer,
Y. Zhang,
D. H. Pashley, and
J. Stuart Nelson,
“Characterization of dentin and enamel by use of optical coherence tomography,”
Appl. Opt., 38 2092
–2096
(1999). 0003-6935 Google Scholar
D. Fried,
S. Shafi, and
J. D. B. Featherstone,
“Imaging caries lesions and lesion with polarization sensitive optical coherence tomography,”
J. Biomed. Opt., 7 618
–626
(2002). https://doi.org/10.1117/1.1509752 1083-3668 Google Scholar
L. L. Otis,
R. I. Al-Sadhan,
J. Meiers, and
D. Redford-Badwal,
“Identification of occlusal sealants using optical coherence tomography,”
J. Clin. Dent., 14 7
–10
(2000). 0895-8831 Google Scholar
R. S. Jones,
M. Staninec, and
D. Fried,
“Imaging artificial caries under composite sealants and restorations,”
J. Biomed. Opt., 9 1297
–1304
(2004). https://doi.org/10.1117/1.1805562 1083-3668 Google Scholar
D. Fried,
R. E. Glena,
J. D. B. Featherstone, and
W. Seka,
“Nature of light scattering in dental enamel and dentin at visible and near-infrared wavelengths,”
Appl. Opt., 34 1278
–1285
(1995). 0003-6935 Google Scholar
J. R. Sturdevant,
S. C. Bayne, and
H. O. Heymann,
“Margin gap size of ceramic inlays using second-generation CAD/CAM equipment,”
J. Esthet Dent., 11 206
–214
(1999). 1040-1466 Google Scholar
D. F. Rigsby,
D. H. Retief, and
C. M. Russel,
“Marginal leakage and marginal gap dimensions of three dentinal bonding systems,”
Am. J. Dent., 3 289
–294
(1990). 0894-8275 Google Scholar
A. Bem-Amar,
H. S. Cardash, and
H. Judes,
“The sealing of the tooth/amalgam interface by corrosion products,”
J. Oral Rehabil., 22 101
–104
(1995). 0305-182X Google Scholar
R. Haak,
M. J. Wicht, and
M. Hellmich,
“Detection of marginal defects of composite restorations with conventional and digital radiographs,”
Eur. J. Oral Sci., 110 155
–162
(2002). 0909-8836 Google Scholar
|