|
|
1.IntroductionLight scattering in biological tissue results from the interaction of light with the complex microscopic cellular structure and can be interpreted in terms of scatterers with a broad size distribution. The high forward peak of the phase function is probably related to scattering by cells themselves, or by the nuclei, and the usually observed enhancement in the backward scattering is probably due to Rayleigh scattering by the inner organelles.1, 2 Therefore, the current perspective is that light scattering by biological tissue is the sum of contributions from scatterers of different length scales. Accordingly, some researchers have modeled tissue as a diameter fractal3 or skewed logarithmic4 distribution of spheres and calculated the corresponding optical properties based on Mie theory. In both cases, it has been shown that good agreement between model and real tissue parameters can be obtained by adjusting the exponent of the distribution. In particular, it is possible to accurately simulate the scattering phase function of a specific tissue. Materials used to simulate the optical properties of tissues commonly consist of a suspension of particles in a solid or liquid. Selection of appropriate amounts of scattering and absorbing materials enables the reduced scattering coefficient and the absorption coefficient to be fixed at desired values. Example scattering materials include Intralipid5 or milk6 in water, or solid particles suspended in polymer resin.7, 8, 9 However, controlling the precise form of the phase function, or even the average cosine of scattering angle , is much more difficult. The concept of a fractal distribution of scattering spheres can be used to construct a phantom with a precisely tuned phase function. The importance of fixing and stems from the fact that most phantoms are built according to the similarity principle; not with the true values of and , but with other values and such that . However, it has been pointed out in the literature that this approximation may be inaccurate if and are very different.10 The accuracy of the approximation also depends on the particular type of measurement performed. Monte Carlo simulations by Gélébart 3 for total reflectance and space-resolved reflectance from a semiinfinite medium exhibit errors introduced by the similarity principle. In the first case, for , less than 2% error is found if , increasing up to for . In the latter case, for and , the error is generally between 2 and 7%, increasing drastically for source-detector distances smaller than 10 mean free paths , attaining a maximum of 40% error at zero distance. The principal objective of this paper is to demonstrate the feasibility of constructing a phantom medium that accurately reproduces the phase function and the , , and values of a selected biological tissue at a given wavelength. We follow the prescription of Gélébart 3 These authors performed simulations with fractal size distributions of microspheres and demonstrated theoretically the possibility of building such a phantom. The chosen tissues were adult brain white matter and liver, whose properties have been measured, respectively, by Van der Zee11 at and by Marchesini 12 at . The phantom components are water, polystyrene microspheres, and dye. To measure the phase function of our phantom material we performed goniometric light scattering measurements. This type of measurement has been widely performed previously for tissues11, 12, 13 and cell suspensions.2, 14 Measurements on tissues are usually performed within an index-matching fluid, with an immersed detecting optical fiber, while cell suspensions are often measured using a cylindrical cell, with the detector in air.14 We employed the latter approach using a configuration that enables measurements to be recorded15, 16 for scattering angles between 10 and . We discuss the optics related to the use of the cylindrical cell, the angular resolution achieved, and the optimum distance between the sample and detector. During the development of the theory associated with our measurements it was necessary to address two important questions. First, does Mie theory apply when the medium has an absorption coefficient of the order of that of biological tissues? The absorption coefficient of real tissues spans about three orders of magnitude,17 between about 0.001 and . This raises the question of the validity of Mie calculations in an absorbing medium, which has already been addressed in the literature.18, 19, 20 When the medium is absorptive, the inherent scattering cross section calculated at the sphere surface is different from the apparent cross section observed in the far field. This arises not only from the attenuation of the scattered field but also because of the modulation of its wave modes. The current view is that the apparent cross section should be used to calculate the optical parameters of a sample.20 This was done recently by Ma 21 to determine the refractive index of polystyrene spheres in suspension using transmission and reflectance measurements. We experimentally investigated the effect of the absorption of the medium absorption on the total cross section for polystyrene particles. Second, for a phantom based on polystyrene particles, does the absorption of polystyrene contribute significantly to the total phantom absorption? It is usually assumed that the absorption of polystyrene is negligible. However, available data on the visible and near-IR absorption by polystyrene are scarce and not consistent.21, 22, 23 Particularly, the imaginary part of the polystyrene refractive index determined in Refs. 21, 23 may imply an important contribution of the latex spheres to the total phantom absorption coefficient. To clarify this question, we estimated the contribution of polystyrene to the phantom absorption through the determination of the absorption coefficient of the phantom without dye. We also propose a chemical explanation for the differences between the measurements of polystyrene absorption in the visible (see Appendix B). 2.Construction of the PhantomWe developed a phantom material consisting of an aqueous suspension of polystyrene microspheres with a fractal size distribution. The distribution is calculated to reproduce, as closely as possible, the phase function and scattering coefficient of a specific tissue at a given wavelength. A dye is added to reproduce at the same wavelength. The procedure involved in building the phantom is described in the theoretical work of Gélébart 3 In this work, it is assumed that the diameters of the particles are distributed according a continuous fractal distribution and simulations are performed to show that a good match between real tissue and phantom phase functions can be obtained. In the ideal case of a continuous distribution, the density function of the spheres is where is the fractal dimension of the diameter distribution and is a constant. For a single diameter we define as the total scattering cross section, as the differential cross section, as the phase function, and as the anisotropy factor. Therefore the particle distribution has the following optical properties: (1) a scattering coefficient , given by(2) a differential cross section, ; (3) a phase function ,and (4) an anisotropy factor,To develop a suitable recipe for generating phantom materials the continuous distribution of spheres is represented by a discrete distribution composed of classes of spheres of diameter , and density . For each class the cross section, phase function and mean cosine of scattering angle are , , and respectively, and may be calculated using the Mie scattering code of Bohren and Huffmann.24 The scattering coefficient for each species is . The determination of the phantom properties is based on the discretized forms of Eqs. 2, 3, 4. The parameters of a real tissue, which we aim to represent using a phantom material are the phase function, , the anisotropy factor , and the scattering and absorption coefficients and . The discretized form of Eq. 4, together with the discretized form of , Eq. 2, gives This can be plotted as a function of and the value of is chosen that gives . The constant in Eq. 1 is then determined by imposing on the discretized form of Eq. 2:where and determine the composition of the phantom.The phase function of the mixture is obtained by adding the individual phase functions weighted by the relative contributions of each size of microspheres to the total scattering coefficient of the phantom The tissues whose optical properties we have chosen to mimic are the white matter of adult brain, measured by Van der Zee, 11 and liver, measured by Marchesini 12 Our scattering particles are a set of polystyrene microspheres of diameters suspended in water. For brain the chosen different diameters (choice dependent on supplier availability) are , , , , , and (Bangslabs, Fishers, Indiana); for liver the chosen diameters are , , , (Fluka, Buchs, Switzerland), and (Bangslabs). We applied the procedure already described at the wavelengths of for brain and for liver. At these wavelengths (we chose 0.82 since this was the value derived from the phase function we produced from the published graph of van der Zee) and the quoted average value for is 0.68. The refractive indexes of water and polystyrene at these wavelengths are calculated from Refs. 25, 26, respectively. This gives very close values: , , and . The value for each suspension of microspheres (brain or liver phantoms) is calculated as a function of fractal dimension through Eq. 5. The selected values of are those that originate a value of equal to and . These values are and (see Fig. 1 ). Using these values, is determined from Eq. 6 by imposing the measured values for the scattering coefficients: and . With and known, the densities of the spheres, given by Eq. 1, are also known. Fig. 1Plot of the phantom anisotropy factor versus for the different sets of available diameters for the adult brain white matter and liver phantoms. In the first case, the value of that yields is and in the latter it is . 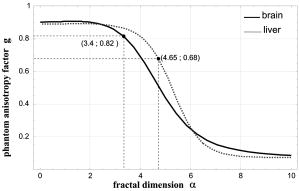 The relative concentrations (number per volume) of microspheres and the weight of each class contribution to the phase function of Eq. 7 are listed in Table 1 . Numerical tests showed that these concentrations must be respected within an error of 5% to keep the value of within an error of . The resulting phase function is described in Sec. 4(A). Table 1Composition of the adult brain white matter and liver phantoms. Here d is diameter of the microspheres, %ρ is the percentage contribution of each class to the number density, and %μs is the percentage contribution of each class to the scattering coefficient, which, by Eq. 7, is equivalent to the weight in the phase function.
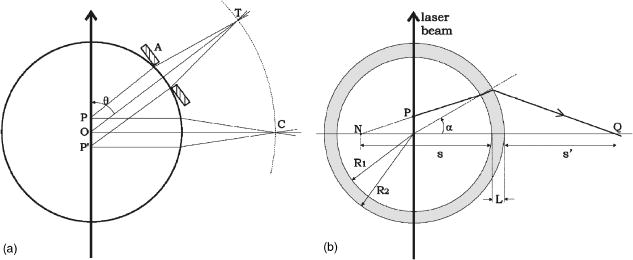
Finally, note that matching the values of tissue and phantom also ensures the best fit of the phase function. The chi square calculation [where are the angles and the phase function of the phantom for each ] for brain, for example, has a minimum for ( data not shown). 3.Basic Principles of the GoniometerTo measure the phase function of the mixture of microspheres we performed light scattering goniometric measurements. For a real biological tissue, the condition of single scattering requires thin samples with a thickness of the order of or less. In our case, however, we can ensure single scattering by reducing the concentration of spheres so that , where is the length of the vessel containing the microsphere suspension and the subscript dil refers to the diluted phantom. Goniometer measurements on tissue and phantom samples also require suitable compensation to be made for the difference between the refractive index of the sample and that of the external medium. This can be achieved by placing a tissue sample in a saline solution13 or between a pair of glass semicylinders.11 We chose a simple hollow cylindrical glass cell. An advantage of this method is the fact that the cell behaves like a lens for the scattered rays, providing a means of separating them angularly. At the same time, a broad angular range is allowed and no refraction corrections are required. The lens effect of a scattering cylindrical cell has been used in a dynamic light scattering (fixed angle) extension to turbid media15 and in Bragg scattering by crystals of hard spheres at high volume fractions.16 To our knowledge, however, it has not been applied to goniometric static light scattering measurements. The basic optics of the cell is depicted in Fig. 2(a) . A laser beam is incident on the cell, and passes through its center. The scattering plane corresponds to a cross section across the cylindrical cell. Consider a scattered ray at an angle , originating at the center of the cell . This ray will not suffer deflection since it is normal to the cell surface. Two other rays scattered at the same angle and originating at points and along the incident beam will intersect each other and the central ray at a point lying within what we can call the focal circle. This will be true for any beam of parallel rays as long as geometrical optics apply. An aperture close to the cell may be required to select only paraxial rays. Parallel rays scattered at another angle are focused at another point of the focal circle, e.g., . Thus, the cell angularly separates the scattered rays and the detector should be placed on the focal circle to achieve maximum angular selectivity and light collection due to the focusing of the scattered light. The angular range of the measurements comes from physical constraints. The minimum angle allowed is that which can be sampled before the edge of the beam is incident directly on the detector, producing saturation. The maximum angle accesible is determined by obstruction of the incident beam by the detector. The focal circle radius is obtained from paraxial optics, as indicated in Fig. 2(b). The laser beam is shown propagating along the vertical axis and we arbitrarily chose the horizontal axis as the scattering direction. By symmetry, the results apply to any other scattering angle. Consider a scattered ray leaving (refractive index ). We can calculate the image of by backpropagating the ray to point on the horizontal axis and applying the lensmakers equation. Together with the thin lens approximation this gives: where and are the inner and outer radius of the glass-walled cylindrical cell, respectively; and are the distances to the object and image, respectively; and is the refractive index of glass. As the scattered ray at becomes increasingly parallel to the optical axis, the point tends towards infinity and . This limit gives the distance from the focal circle to the cell:As already stated, this is valid for a beam of parallel rays scattered at any angle. Note again that these expressions are valid within the range of paraxial optics, i.e., for , or up to in practice. Since typically and , we have , i.e., the focal circle radius is approximately four cell radii.Ideally the system’s angular resolution per unit length (measured along the focal circle) would be given by [in degrees per millimeter] if is expressed in millimeters. This should be multiplied by the detector width to obtain the resolution for a particular system. In practice, however, it is more accurate to determine the angular resolution by ray tracing. For a given scattering angle , detector width , and an aperture stop of width , we search for rays scattered at that also reach the detector. The resolution will be , where and are the maximum and minimum values of . Decreasing and increases resolution but decreases the detector signal, so that a compromise is necessary. For smooth phase functions such as those observed in biological tissues, a low resolution is acceptable. For our system, the ray-tracing calculations indicate a resolution of the order of . 4.Method and Results4.1.Phase Function MeasurementA light-scattering goniometer was assembled as described in the preceding. For the brain phantom measurements, the source of light was a polarized diode laser operating at , with (Vector Beta TX, Global Laser Technology Solutions); for the liver phantom measurements, the source of light was a polarized diode laser operating at , with (Hitachi HL6314MG) and controlled by a diode laser current driver (Thorlabs LDC 500). Both diode lasers were modulated in amplitude using the output of a lock-in amplifier (Stanford Research Systems SR830). The phase function measurements of Van der Zee and Marchesini were performed with unpolarized light. However, unpolarized and scattering are equivalent for calculations of the total scattered intensity, and therefore we oriented the polarization of the laser beam at with respect to the scattering plane. Laser light scattered by a sample within the cylindrical cell was measured using a amplified photodiode (IPL 10530 DAW, Integrated Photomatrix Limited) mounted on a goniometer arm rotated along the focal circle. The output of the photodiode was sent to the lock-in for synchronous detection. A small aperture was placed close to the cell to ensure validity of paraxial optics. No collecting optics are necessary, since the focusing of light on to the detector is achieved by the cell itself. Note that one half of the cylindrical cell was painted black so that light scattered at an angle is uncontaminated by light scattered at an angle reflected off the wall of the cell. This is particularly important for measuring backscattered light, which is much weaker than the forward scattered light. The prepared phantom solution is diluted so that the probability of multiple scatters within the sample is negligible. If is a dilution factor , then the scattering coefficient of the diluted phantom is , where is chosen so that , where is the inner radius of the cell. Figure 3 shows a validation measurement performed on a sample composed of polystyrene spheres (Bangslabs, Fishers, Indiana). The experimental curve is shown with a theoretical curve for a quasi-monodisperse distribution of particles with 5% size dispersion, averaged over . This curve was found to give the best fit to the data (calculations using a modified version of the program described by Bohren and Huffmann24). This suggests that the angular resolution of the goniometer is around , slightly worse than expected. In addition, the phase function also indicates evidence of residual reflections at large angles. Slight aggregation of the microspheres was observed using a microscope, which could also contribute to differences between the measured and the expected phase functions. Fig. 3Phase function measured with a diode laser at for polystyrene particles suspended in water. Also shown is the theoretical curve for a size dispersion of 5% averaged over 4°.  Figure 4 shows the measurement of the phase function for the brain phantom at and Fig. 5 shows the measurement for the liver phantom at . Also shown are the Mie scattering calculations for each mixture, and the real tissue phase functions of adult brain white matter and liver measured respectively by Van der Zee and Marchesini. In both cases, the agreement between the phantom and the Mie curves is very good, which are also shown to be very good approximations for the real tissue phase functions. Fig. 4Plot of the phase functions of adult brain white matter measured at . Open squares: phantom (composition of the phantom in Table 1); black squares: phase function measured by Van der Zee 11; line: theoretical phase function for the phantom, obtained from Eq. 7.  Fig. 5Plot of the phase functions of liver measured at . Open squares: phantom (composition of the phantom in Table 1); black squares: phase function measured by Marchesini 12; line: theoretical phase function for the phantom, obtained from Eq. 7.  The excellent agreement observed in Figs. 4 and 5 should not be surprising despite the lesser agreement exhibited in Fig. 3. The phase function of Fig. 3 has salient features demanding high angular resolution in the measurements, while those in Figs. 4 and 5 are monotonic, requiring much lower angular resolution. The anisotropy factors are calculated from the experimental points of Figs. 4 and 5. We obtained for the brain phantom and for the liver phantom . The assigned uncertainties come from the angular extrapolations assumed for the data and from a maximum 5% uncertainty in the concentrations of the different classes of spheres. The use of a suspension of microspheres with a fractal size distribution is thus shown to be an effective method of simulating realistic tissue phase functions. However, observations with a microscope revealed significant aggregation of microspheres after in suspension. Light scattering measurements showed that the value of increases with the age of the solution. In addition, polystyrene microspheres represent a very expensive material for phantoms, which have only a relatively short shelf-life. These difficulties may be overcome by constructing solid phantoms according to the same principles, and using alternative scattering particles, such as titanium dioxide or silica. Note, however, that particles are not spherical and Mie calculations do not apply. 4.2.Total Attenuation CoefficientStandard transmission spectrophotometry provides a measurement of . For a suspension of polystyrene particles in water, is given by Eq. 6. The absorption coefficient includes contributions from water and polystyrene, and is given by where is the fraction volume of polystyrene (around 0.04 for our mixture), with and being the total volume of polystyrene and total volume, respectively; is the absorption coefficient for polystyrene; and is the absorption coefficient of water.Measurements are performed on various dilutions of the phantom. If is the length of the cuvette, and is the dilution factor, then upon dilution and , and the absorbance measured by the spectrophotometer, (where corresponds to the distilled water reference measurement), is given by For each dilution an absorbance spectrum was recorded. A plot of as a function of for each wavelength has a slope (assuming is comparable to ). The measurements were performed in a GBC Cintra 40 spectrophotometer (GBC Scientific) with an aperture of placed in front of the spectrophotometer exit window. Taking into account the refraction at the water/air boundary, this meant an angular field of view of . Using a Henyey-Greenstein phase function the underestimation error is approximately 4% for (brain) and 1% for (liver). The results of the spectrophotometer measurements are plotted in Fig. 6 . We can observe that at 670 and the values of obtained for each phantom are very close to the ones given by Van der Zee and Marchesini. The error bars come from uncertainty in the sphere concentrations and dilutions for the measurements. The expected values of are, in general, inside the error bars. This includes the target values at and at . Fig. 6Values obtained for in the spectrophotometer measurements. The target values were at (measured: ) and at (measured: ). 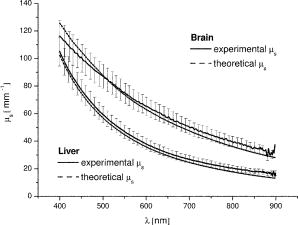 However, the measurements of van der Zee reveal an increase of with wavelength, contrary to the phantom behavior displayed in Fig. 6. Thus, an assembly of microspheres may not provide a good model for tissue when it is necessary to simulate wavelength dependency. This is probably due to the high degree of anisotropy of the tissue. Table 2 summarizes the measurements of and . Table 2Summary of tissue and phantom measured values of g and μs .
Line 1: measurements of adult brain white matter by Van der Zee 11 The assigned errors come from graphics error bars in this paper. Line 2: Measurements on our phantom (diluted)—
g
obtained from light scattering goniometry measurements,
μs≈μt
obtained from spectrophotometry. Line 3: measurements of liver by Marchesini 12 Line 4: Measurements on our phantom (diluted)—same as line 2. The refractive indices for water25 and polystyrene26 are also indicated. We also checked that the absorbance of the medium does not influence the Mie scattering cross section up to . This is important, since Mie theory strictly applies to a nonabsorbing medium. First we measured the absorbance of a suspension of polystyrene microspheres in distilled water at , obtaining the total extinction coefficient of the suspension . Then we added methylene blue in increasing concentrations. For each concentration, we determined the total extinction coefficient . This value was then compared with the value one should obtain if the scattering cross section is independent of absorption, . If the absorption of the medium changes the scattering cross section, then . Figure 7 displays the results as a percentage change in as follows: The points on the graph are averages over five repeated measurements and the error bars are the corresponding standard deviations. The results indicate no dependence of on up to . A final note concerning methylene blue fluorescence is in order. The measurements were performed in the GBC Cintra, which is a scanning spectrophotometer. Hence, wavelengths are separated prior to the incidence on the sample cell and no residual fluorescence from excitation at smaller wavelengths can be observed at since the fluorescence lifetime of methylene blue is27 .4.3.Time-Resolved Measurements of andIf one can assume that the contribution to absorption by both water and polystyrene are negligible (when compared to the real tissue values), then the phantoms characterization performed so far is sufficient: from and one obtains ; the last parameter, , is obtained by simply adding the correct amount of dye. However, as discussed in detail in the following, one can not assume negligible absorption by polystyrene in view of the available measurements of in the visible. Hence, we performed a third measurement on the brain phantom to measure and (phantom with dye) and to cross check . The measurement was not repeated for liver since we have concluded that is negligible in the visible. The parameters and were determined using time-of-flight measurements across samples of phantom material with and without added absorber. This was performed using the time-resolved imaging system built at University College London, described in detail elsewhere.28, 29, 30 The sample was contained in a rectangular cuvette [optical pathlength , transverse section ]; the thickness of the glass slides is ) illuminated with laser pulses at , and transmitted photons were detected by a microchannel-plate photomultiplier tube. Histograms of photon flight times were accumulated with a temporal resolution of about . Each sample measurement is deconvolved by the temporal response of the system, which is characterized in a separate measurement by connecting source and detector fibers directly. Since the suspension of microspheres is contained within a glass-walled cell, the small temporal delay due to the passage of photons through the glass was subtracted. The calibrated temporal profiles obtained for the phantom with and without dye (Indian ink in this measurement) are shown in Fig. 8 . A diffusion-based model for the temporal dispersion of light across a slab, described by Contini, 31 was then fitted using a least-squares algorithm to the calibrated temporal profiles. The procedure involves fitting the parameters and , an amplitude term related with the total intensity, and a temporal offset term. Typical uncertainties in the values of and range between 5 and 10%, depending on the SNR. These uncertainties are due to a degree of crosstalk between and in the fit. Detailed investigation of this method is available in Ref. 32. Strictly speaking, the Contini model applies to a simple boundary between diffusing and external media. To take account of the multiple reflections inside the glass slide a new reflection coefficient may be defined which represents the net effect of the two interfaces. The procedure is described in the Appendix A of Ref. 33. With the new reflection coefficient the model may be applied. The results show only around a 1% variation between the results obtained with and without the glass slide taken into account. We expect the phantom absorption coefficient to be determined primarily by the amount of dye added, although it is possible that the microspheres themselves also contribute to the overall absorption. Indeed, some of the few available data on polystyrene absorption21, 23 imply the contribution could be significant. Using independent methods, these authors determined an imaginary part of polystyrene refractive index in the range at (we used a plausible interpolation value, in the case of Ref. 23), which corresponds to an unrealistically large absorption coefficient, . For the brain phantom, with 4% volume fraction of polystyrene, this would imply a polystyrene contribution to , , Meanwhile, Inagaki 22 find that is below their measurable limit (less than ) over the entire wavelength range from to . First, we measured the absorption coefficient of the phantom without dye, . We obtained . The quoted error, 10%, comes from Ref. 32. Note that this measurement is consistent with the absorption coefficient for water at . An average over nine available published measurements34, 35, 36, 37, 38, 39, 40, 41, 42 gives . This indicates clearly that the absorption of the phantom without dye is basically that of water and that cannot exceed [compare with Eq. 13]. Then we added Indian ink to the phantom to match the value of to that measured by Van der Zee at , using the known extinction coefficient value for the ink. The measured absorption coefficient of the phantom was in good agreement with the expected value. This is a second confirmation that the absorption by polystyrene within the phantom is negligible and that is determined by the added dye. Indian ink is not a pure absorber.43 Thus, spectrophotometric measurements lead to an overestimation of its absorption coefficient, . We have used the time of flight system to measure , using the emitter and receiver optical fibers to measure the intensity attenuation through the ink solution. All the scattered photons into a cone of are collected by the system since the numerical aperture of the collecting fiber is , where is the refractive index of the medium, and the maximum allowed angle of entrance. Assuming a typical Indian ink albedo of to 0.4, a typical anisotropy factor43 to 0.8, and a Henyey-Greenstein phase function, this means that the fraction of photons effectively lost is to 0.9. The measured total extinction coefficient is and the overestimation in is , which is between 24 and 36%. The amount of Indian ink added to the phantom was calculated taking into account an overestimation of of 30% and also taking into account the contribution of absorption by water. The uncertainty in the measurement of can also be used to determine an interval of confidence for . We believe that this data may be relevant to the question of polystyrene absorption. We included it in Appendix A, together with a discussion of the polymerization chemistry, which can elucidate the inconsistency between published measurements. The values of derived with and without the ink were and , respectively. The expected result was around 50% higher, since Mie calculations at yield , , and . Table 3 summarizes the measurements of and . Table 3Summary of Mie simulation and phantom values of μs′ and μa measured at 780nm .
Line 1: Mie simulations for the phantom without dye. It is assumed that the absorption by polystyrene is negligible and
μa=μw±Δμw
is calculated from the average of measurements34, 35, 36, 37, 38, 39, 40, 41, 42 (
μw
is the absorption coefficient of water). Line 2: time-of-flight measurements of the phantom without dye; 10% uncertainty assigned to each coefficient.32 Line 3: Mie simulations for the phantom with dye at
780nm
. It is assumed that
μa=μdye+μw
. Uncertainty comes from
Δμw
and from uncertainty in the albedo of Indian ink, estimated from Ref. 43. Line 4: time-of-flight measurements of the phantom with dye. The refractive indices for water25 and polystyrene26 are also indicated. The disagreement between the values of was probably due to increased aggregation of particles within the sample during the interval between the goniometry and time-resolved transmission measurements. A suspension of microspheres is said to be colloidally stable if they remain suspended and separate. This is achieved by electric repulsion of the surface charges (arising from initiator fragments and surfactant molecules). Any change in the host medium, for example, using nondeionized water for dilutions, changes the surface charges and thus colloidal stability. This effect is probably enhanced when particles of very different sizes are present. As already discussed, aggregation increases , causing a decrease in . 5.SummaryIn this paper, we have demonstrated a method for generating a tissue-equivalent phantom for optical measurements, based on a suspension of microspheres with a fractal size distribution. Our results show that it is possible to accurately reproduce the phase function and the , , and values of a selected biological tissue at a given wavelength. This was demonstrated specifically for the case of adult brain white matter, measured by Van der Zee 11 at , and for liver, measured by Marchesini 12 The continuous fractal distributions were approximated by discrete distributions containing microspheres of six (brain)/five (liver) different diameters. It was found that good results for the phase function were obtained even with a small number of diameters. For applications where the shape of the phase function is important, such as for spatially resolved reflectance measurements using small source-detector separations, we showed that suitable phantoms can be generated relatively easily in the laboratory. As part of our investigation we also showed that (1) Mie theory is applicable within the range of values of the absorption coefficient typical for biological tissue, at least up to ; and (2) at , the contribution of polystyrene absorption to the total phantom absorption is negligible. However, we have seen (see Appendix B) that in the visible to near-IR (Vis-NIR) the absorption of polystyrene depends on the contaminants inevitably present and that other measurements21, 23 indicate that a nonnegligible contribution to absorption may be introduced by polystyrene. Finally, the light-scattering goniometer proved to be a good option for the measurement of phase functions for liquid phantoms. There are several disadvantages to the demonstrated method of generating phantoms. First, the optical properties of polystyrene suspensions are unstable over time. Second, the microspheres are relatively expensive. And third, the fractal method is unlikely to be able to reproduce tissue optical properties over a broad range of wavelengths simultaneously. AppendicesAppendix A: Determination of an Interval forThe purpose of this appendix is to determine an interval of confidence for . To do that, we use the measured absorption coefficient of the phantom without dye , determine , and propagate the errors of all the variables involved in this determination. The absorption coefficient obtained from the diffusion model fit for the phantom without dye was . The 10% error in the measurement of comes from Ref. 32. We adopt, however, a more conservative estimate for the error, and attribute significance to the first digit only. Thus, we write . For the absorption coefficient of water, we adopt an average over nine available published measurements,34, 35, 36, 37, 38, 39, 40, 41, 42 which gives . We are now in position to determine an interval of confidence for on the basis of the reported errors. The total absorption coefficient of the phantom is , with . Thus, the central value for is and the error attributed to this measurement is given by propagation of errors as follows: We also attributed an overestimated error of 25% in . In any case, Eq. 14 is largely dominated by the contribution of . Overall, this gives , which translates in the interval .From , one obtains at ( at ). Thus, within our experimental error, we have found higher bounds for and . These bounds clearly exclude the values of Refs. 21, 23. Appendix B: Polystyrene ChemistryThe contradictions between the data on polystyrene absorption, including our data, can be solved by noting that polystyrene is very unlikely to be pure. Polystyrene is produced by different processes of polymerization, including bulk, solution, emulsion and suspension polymerization. Microspheres are produced either by emulsion or suspension polymerization.44 For example, emulsion polymerization takes place in water containing surfactant (a soap, forming micelles), monomer (styrene), and a water-soluble initiator. The initiator is a molecule that breaks into two free radicals (molecules having one unpaired electron). Polymerization takes place inside the micelles and in the end, each polymer chain has an initiator fragment attached to both ends. The chains fold up as they become insoluble, forming a surface-active seed particle. The growing spheres are stabilized (that is, they do not coalesce) in water by the absorption of surfactant and by orienting with the hydrophobic styrene groups inside and the charged initiator fragments on the surface. The final result is a collection of microspheres with initiator fragments attached and surfactant molecules adsorbed on the surface. A commonly used initiator is , which decomposes in upon heating (in the formula, the dot represents an unpaired electron). In this case, the polystyrene spheres present sulphate groups on the surface. The use of another initiator determines a different coating. The suppliers of polystyrene spheres may also use different additives to improve the chemical process and different physical (temperature) and chemical conditions (concentrations), leading to different molecular weights of the polymer chains. In conclusion, polystyrene always has small amounts of other substances whose nature is determined by the process and conditions of polymerization. The presence of these substances may determine completely the Vis-NIR absorption spectrum of a polystyrene sample, since the absorption by the polymer is expected to be extremely low. In other words, in this wavelength range the absorption of a polystyrene sample probably is not determined by polystyrene itself. This is a plausible explanation for the inconsistency observed between the measurements of presented by Refs. 21, 23 (high ), and those of Ref. 22 (low ). AcknowledgmentsThis work was supported by FCT—Fundação para a Ciência e a Tecnologia—under project POCTI/FAT/42850/2001, and by the Conselho de Reitores das Universidades Portuguesas and British Council under Acção Integrada Luso Britânica No. B-16/03. ReferencesB. Beauvoit,
H. Liu,
K. Kang,
P. D. Kaplan,
M. Miwa, and
B. Chance,
“Characterization of absorption and scattering properties of various yeast strains by time-resolved spectroscopy,”
Cell Biophys., 23 91
–109
(1993). 0163-4992 Google Scholar
R. Drezek,
A. Dunn, and
R. Richards-Kortum,
“Light scattering from cells: finite-difference time-domain simulations and goniometric measurements,”
Appl. Opt., 38 3651
–3661
(1999). 0003-6935 Google Scholar
B. Gélébart,
E. Tinet,
J. M. Tualle, and
S. Avrillier,
“Phase function simulation in tissue phantoms: a fractal approach,”
Pure Appl. Opt., 5 377
–388
(1996). https://doi.org/10.1088/0963-9659/5/4/005 0963-9659 Google Scholar
J. M. Schmitt and
G. Kumar,
“Optical scattering properties of soft tissue: a discrete particle model,”
Appl. Opt., 37 2788
–2797
(1998). 0003-6935 Google Scholar
S. T. Flock,
S. L. Jacques,
B. C. Wilson, and
W. M. Star,
“Optical properties of Intralipid: a phantom medium for light propagation studies,”
Lasers Surg. Med., 12 510
–519
(1992). 0196-8092 Google Scholar
G. Mitic,
J. Kolzer,
J. Otto,
E. Plies,
G. Solkner, and
W. Zinth,
“Time-gated transillumination of biological tissues and tissuelike phantoms,”
Appl. Opt., 33 6699
–6710
(1994). 0003-6935 Google Scholar
M. Firbank and
D. T. Delpy,
“A design for a stable and reproducible phantom for use in near infra-red imaging and spectroscopy,”
Phys. Med. Biol., 38 847
–853
(1993). https://doi.org/10.1088/0031-9155/38/6/015 0031-9155 Google Scholar
M. Firbank,
M. Oda, and
D. T. Delpy,
“An improved design for a stable and reproducible phantom for use in near infra-red imaging and spectroscopy,”
Phys. Med. Biol., 40 955
–961
(1995). https://doi.org/10.1088/0031-9155/40/5/016 0031-9155 Google Scholar
U. Sukowski,
F. Schubert,
D. Grosenick, and
H. Rinneberg,
“Preparation of solid phantoms with defined scattering and absorption properties for optical tomography,”
Phys. Med. Biol., 41 1823
–1844
(1996). https://doi.org/10.1088/0031-9155/41/9/017 0031-9155 Google Scholar
L. Servant,
E. Tinet,
S. Avrillier, and
F. Carmona,
“Atmospheric propagation and remote sensing II,”
Proc. SPIE, 1968 154
–163
(1993). 0277-786X Google Scholar
P. Van der Zee,
M. Essenpreis, and
D. T. Delpy,
“Optical properties of brain tissue,”
Proc. SPIE, 1888 454
–465
(1993). 0277-786X Google Scholar
R. Marchesini,
A. Bertoni,
S. Andreola,
E. Melloni, and
A. E. Sichirollo,
“Extinction and absorption coefficients and scattering phase functions of human tissues in vitro,”
Appl. Opt., 28 2318
–2324
(1989). 0003-6935 Google Scholar
S. L. Jacques,
C. A. Alter, and
S. A. Prahl,
“Angular dependence of HeNe laser light scattering by human dermis,”
Lasers Life Sci., 1 309
–334
(1987). 0886-0467 Google Scholar
J. R. Mourant,
J. P. Freyer,
A. H. Hielscher,
A. A. Eick,
D. Shen, and
T. M. Johnson,
“Mechanisms of light scattering from biological cells relevant to noninvasive optical-tissue diagnostics,”
Appl. Opt., 37 3586
–3593
(1998). 0003-6935 Google Scholar
W. V. Meyer,
D. S. Cannell,
A. E. Smart,
T. W. Taylor, and
Padetha Tin,
“Multiple-scattering suppression by cross correlation,”
Appl. Opt., 36 7551
–7558
(1997). 0003-6935 Google Scholar
R. B. Rogers,
W. V. Meyer,
J. Zhu,
P. M. Chaikin,
W. B. Russel,
M. Li, and
W. B. Turner,
“Compact laser light-scattering instrument for microgravity research,”
Appl. Opt., 36 7493
–7500
(1997). 0003-6935 Google Scholar
W.-F. Cheong,
S. A. Prahl, and
A. J. Welch,
“A review of the optical properties of biological tissues,”
IEEE J. Quantum Electron., 26 2166
–2185
(1990). https://doi.org/10.1109/3.64354 0018-9197 Google Scholar
P. Chylek,
“Light scattering by small particles in an absorbing medium,”
J. Opt. Soc. Am., 67 561
–563
(1977). 0030-3941 Google Scholar
Q. Fu and
W. B. Sun,
“Mie theory for light scattering by a spherical particle in an absorbing medium,”
Appl. Opt., 40 1354
–1361
(2001). 0003-6935 Google Scholar
P. Yang,
B.-C. Gao,
W. Biscombe,
M. I. Mishchenko,
S. Platnick,
H.-L. Huang,
B. A. Baum,
Y. X. Hu,
D. Winker,
S.-C. Tsay, and
S. K. Park,
“Inherent and apparent scattering properties of coated or uncoated spheres embedded in an absorbing host medium,”
Appl. Opt., 41 2740
–2759
(2002). 0003-6935 Google Scholar
X. Ma,
J. Q. Lu,
R. S. Brock,
K. M. Jacobs,
P. Yang, and
X.-H. Hu,
“Determination of complex refractive index of polystyrene microspheres from ,”
Phys. Med. Biol., 48 4165
–4172
(2003). https://doi.org/10.1088/0031-9155/48/24/013 0031-9155 Google Scholar
T. Inagaki,
E. T. Arakawa,
R. N. Hamm, and
M. W. Williams,
“Optical properties of polystyrene from the near-infrared to the x-ray region and convergence of optical sum rules,”
Phys. Rev. B, 15 3243
–3253
(1977). https://doi.org/10.1103/PhysRevB.15.3243 0163-1829 Google Scholar
C. Jung and
B. K. Rhee,
“Simultaneous determination of thickness and optical constants of polymer thin film by analyzing transmittance,”
Appl. Opt., 41 3861
–3865
(2002). 0003-6935 Google Scholar
C. F. Bohren and
D. R. Huffman, Absorption and Scattering of Light by Small Particles, Wiley, New York
(1983). Google Scholar
, “Release on refractive index of ordinary water substance as a function of wavelength, temperature and pressure,”
(1997) Google Scholar
Styrene. Its Polymers, Coploymers and Derivatives, 523
–525 Reinhold, New York
(1952). Google Scholar
E. Tuite,
J. M. Kelly,
G. S. Beddard, and
G. D. Reid,
“Femtosecond deactivation of thionine singlet state by mononucleotides and polynucleotides,”
Chem. Phys. Lett., 226 517
–524
(1994). https://doi.org/10.1016/0009-2614(94)00759-4 0009-2614 Google Scholar
K. Wells,
J. C. Hebden,
F. E. W. Schmidt, and
D. T. Delpy,
“The UCL multichannel time-resolved system for optical tomography,”
Proc. SPIE, 2979 599
–607
(1997). 0277-786X Google Scholar
F. E. W. Schmidt,
M. E. Fry,
E. M. C. Hillman,
J. C. Hebden, and
D. T. Delpy,
“A 32-channel time-resolved instrument for medical optical tomography,”
Rev. Sci. Instrum., 71 256
–265
(2000). https://doi.org/10.1063/1.1150191 0034-6748 Google Scholar
J. C. Hebden,
F. E. W. Schmidt,
M. E. Fry,
M. Schweiger,
E. M. C. Hillman,
D. T. Delpy, and
S. Arridge,
“Simultaneous reconstruction of absorption and scattering images using multi-channel measurement of purely temporal data,”
Opt. Lett., 24 534
–536
(1996). 0146-9592 Google Scholar
D. Contini,
F. Martelli, and
G. Zaccanti,
“Photon migration through a turbid slab described by a model based on diffusion approximation. I. Theory,”
Appl. Opt., 36 4587
–4599
(1997). 0003-6935 Google Scholar
J. C. Hebden,
S. R. Arridge, and
M. Schweiger,
“Investigation of alternative data types for time resolved optical tomography,”
OSA Trends in Optics and Photonics, 21 162
–167 OSA, Washington
(1998). Google Scholar
S. Prahl,
“Light transport in tissue,”
University of Texas at Austin,
(1988). Google Scholar
S. A. Sullivan,
“Experimental study of the absorption in distilled water, artificial sea water, and heavy water in the visible region of the spectrum,”
J. Opt. Soc. Am., 53 962
–968
(1963). 0030-3941 Google Scholar
G. M. Hale and
M. R. Querry,
“Optical constants of water in to wavelength region,”
Appl. Opt., 12 555
–563
(1973). https://doi.org/10.1007/BF00934777 0003-6935 Google Scholar
K. F. Palmer and
D. Williams,
“Optical properties of water in the near infrared,”
J. Opt. Soc. Am., 64 1107
–1110
(1974). 0030-3941 Google Scholar
M. R. Querry,
P. G. Cary, and
R. C. Waring,
“Split-pulse laser method for measuring attenuation coefficients of transparent liquids: application to deionized filtered water in the visible region,”
Appl. Opt., 17 3587
–3592
(1978). 0003-6935 Google Scholar
D. J. Segelstein,
“The complex refractive index of water,”
(1981) Google Scholar
R. C. Smith and
K. S. Baker,
“Optical properties of the clearest natural waters ,”
Appl. Opt., 20 177
–184
(1981). 0003-6935 Google Scholar
K. S. Shifrin, Physical Optics of Ocean Water, American Institute of Physics, New York
(1988). Google Scholar
L. Kou,
D. Labrie, and
P. Chylek,
“Refractive indices of water and ice in the spectral range,”
Appl. Opt., 32 3531
–3540
(1993). 0003-6935 Google Scholar
H. Buiteveld and
J. M. H. Hakvoort, and
M. Donze,
“The optical properties of pure water,”
Proc. SPIE, 2258 174
–183
(1994). 0277-786X Google Scholar
S. J. Madsen,
M. S. Patterson, and
B. C. Wilson,
“The use of India ink as an optical absorber in tissue-simulating phantoms,”
Phys. Med. Biol., 37 985
–993
(1992). https://doi.org/10.1088/0031-9155/37/4/012 0031-9155 Google Scholar
Seradyn technical paper, “Polystyrene and carboxylate—modified microparticles,”
(1999) http://www.seradyn.com/technical/pdf/polystyrene.pdf Google Scholar
|
|||||||||||||||||||||||||||||||||||||||||||||||||||||||||||||||||||||||||||||||||||||||||||||||||||||||||||||