
|
|
1.IntroductionProtecting human skin against the harmful influence of UV solar radiation causing such dangerous diseases as skin cancer is an acute problem. Conventionally, skin is considered as a multilayered medium. It consists of a horny layer, living epidermis, papillary dermis, upper blood net dermis, reticular dermis, deep blood net dermis, and subcutaneous fat.1 Optical properties of different layers, such as scattering and absorption coefficients, refractive indices, and anisotropy factors, differ.2 The outermost layer, called stratum corneum (or horny layer), serves as a natural barrier for deeper skin layers with living cells. From the optical viewpoint, its property is in particular to prevent penetration of UV radiation into epidermis and dermis. To strengthen its protective functions, a variety of sunscreens containing chemical (absorbing) UV filters have been developed.3 To increase the amount of backscattered radiation and avoid allergic reaction of individuals, currently chemical components are partially replaced by so-called “physical components”4 (nanosized particles of titanium dioxide or zinc oxide ZnO). In addition to absorption (within the definite UV spectral region), they have increased scattering properties and decrease the amount of transmitted light by both mechanisms. The UV solar spectrum consists of the three ranges:5 UVA , UVB , and UVC . The most harmful rays from the UVC range are almost completely absorbed by the stratospheric ozone layer in the upper part of the Earth’s atmosphere, while the UVA and UVB fractions reach the ground surface.6 The influence of the UV radiation on human skin can be divided into two categories: acute and chronic effects.6 The former includes sunburn (caused by UVB) and suntanning (by UVA) as well as production of vitamin D (by UVB). The chronic effects are skin cancer (malignant and nonmalignant melanoma) and photoaging (both induced by UVB). All the effects caused by the UVB radiation, except for the synthesis of vitamin D, are negative. Recently, due to the depletion of the ozone layer, an increasing portion of high-energy UVB penetrates through the atmosphere. Another reason that would probably also lead to larger doses of the solar UV radiation affecting people is the greenhouse effect. The proposed climate change would make summers warmer, causing a change of people’s behavior and willingness to remain longer outdoors.7 In sunscreens, nanoparticles are supposed to protect skin in the UVA and UVB spectral regions. Due to difference in electronic structure, ZnO particles absorb radiation with the wavelengths shorter than ; while , with those shorter4 than ; in longer wavelength regions only scattering occurs. Therefore, ZnO powder is mainly used in sunscreens for protection in the UVA range; and for the shortwave UVA (because of higher refractive index than that of ZnO) and UVB ranges.4 Photocatalytic activity of titanium dioxide resulting in free-radical generation in skin is a negative factor, which is essentially suppressed by coating the particles with silica, dimethicone or alumina.8, 9 Nanoparticles tend to form aggregates and agglomerates of size, worsening their protecting properties in the UVB range and shifting the pronounced attenuation to the longer wavelengths of UVA and visible regions of the solar spectrum. Nevertheless, novel manufacturing technologies, e.g., mechanochemical processing (MCP™) enable us to produce nanopowders without such disadvantages and with a narrow size distribution , which can be successfully used in sunscreens.4 The usual size distribution of particles is 15 to 20% from the mean value.10 In this paper, we consider nonaggregating particles of , which are more efficient than aggregates in attenuating the UV radiation. Computer simulations implementing the Monte Carlo method were carried out to evaluate the effect of nanospheres of different diameters . The tape-stripping technique was used in experiments to determine the in-depth distribution of the fine particles embedded into the stratum corneum by means of a sunscreen. It was revealed that most of the nanospheres were located at a depth range of from the skin surface. A computational model of the stratum corneum treated with a sunscreen was developed. Simulations of light transport in this layer were performed for two wavelengths of the incident radiation: 310 and . Such wavelengths were selected for the model calculations due to the complete difference in physical nature of interaction between the nanoparticles and light of such wavelengths. The wavelength of is located on the border between UV and visible parts of the solar spectrum. The line represents the central wavelength in the UVB part of the spectrum. It is responsible for the peak of the erythemal (redness) susceptibility of the skin,11 which more or less correlate with DNA damage of cells.12 This feature and also an impossibility to produce all particles of the same diameter mean that the particles protecting from the radiation at best, should be used in sunscreens as the main compound. Fine particles of such size will also protect skin against the radiation of the most harmful UVB spectral range . A linear combination of the Henyey-Greenstein and Mie scattering phase functions was used as a hybrid phase function of the horny layer with particles embedded. Dependences of the absorbed, backscattered, and transmitted radiation through the whole horny layer ( -thick) on the size of particles (volume concentration is 5%) were obtained. The optimal (in regard to minimizing the amount of transmitted light) diameters of nanospheres for the mentioned wavelengths were revealed. 2.Experiment and Monte Carlo Simulations2.1.ExperimentThe tape-stripping technique was used in the experiment. This method is widely applied to determine the in-depth distribution of topically applied substances within the stratum corneum.13, 14, 15 Sunscreen including rutile particles (mean diameter ) was administered five times over a period of onto the surface area of flexor forearm skin.16, 17 The applied concentration of the sunscreen was following the COLIPA standard.18 The determination of the sun protection factor (SPF) declared on sunscreen products is based on this protocol. A skin area of was marked with a permanent marker. Then of the emulsion was applied with a syringe and distributed homogeneously with a saturated gloved finger. The treated skin was not protected by any kind of textile and was allowed to be washed as well to simulate the situation during holidays on a beach. The tape-stripping procedure started on the fourth day after application. Such a long period is caused by requirement to apply sunscreens before every exposure to the sun, and reapply frequently and liberally, at least every , as long as the person stays in the sun, and especially after swimming. This was required to provide homogeneous superficial distribution of topically administered particles. Following such rules, the effectiveness of sunscreens can be increased19 by a factor of 10 in terms of SPF. Thin cell layers of the stratum corneum (each is about -thick) were removed one by one from the treated skin area. The penetration profile was obtained by analyzing the amount of the stratum corneum (number of corneocytes) and that of removed with each tape strip. The amount of stratum corneum on the tape strips and thickness of the skin strip relative to the whole thickness of the horny layer were determined by a spectroscopic method fully described elsewhere.20, 21 The total thickness of the stratum corneum was determined by means of laser scanning confocal microscopy.22 The surface density of particles on the tape strips was analyzed by x-ray fluorescent measurements:17 about on the first tape strip and almost zero on those taken at the depth of . The particles were mainly located at a depth range of . The penetration profile reconstructed from the measurements of the particles in the stratum corneum is shown in Fig. 1 . The volume concentration of the particles, (%, if multiplied by 100) in the uppermost strip (see Fig. 1), can be estimated as follows: where is the number of particles with volume and density each, within a strip with volume . The total mass of all the particles inside the strip is . The volume is equal to the thickness (in our case ) multiplied by the surface area . As seen from Fig. 1, mass equals to (because the area is ). The specific weight of (rutile form) is . Therefore, it can be calculated that the volume concentration of particles within the uppermost strip is . In deeper parts of the horny layer, the skin contains considerably fewer particles.2.2.Mie CalculationsOptical parameters, such as scattering and absorption coefficients ( and , respectively) for a medium partially filled with particles are required as input data for the Monte Carlo simulations. They can be expressed using scattering and absorption cross-sections of a particle. These cross-sections can be either smaller or larger than the geometrical cross-section of a particle because they are a measure of interaction (scattering and absorption) between a photon and a particle. So, using the same notations as in Eq. 1, we find that here and are relative (dimensionless) light scattering and absorption efficiency factor, respectively, and is the geometrical cross-section of the particle, is the particle diameter ( in the experiment), and is volume concentration of particles. The efficiency factors and were determined using the Mie scattering theory with the help of MieTab 7.23 software.23 Real and imaginary parts of the refractive index of particles for the light with the wavelength required for this software are represented in Table 1 . The sum of the two values and is called the relative light extinction efficiency factor .Table 1Real and imaginary parts of refractive indices of TiO2 for the wavelengths used in the simulations, derived from Ref. 24.
The larger the extinction efficiency factor, the higher the attenuation (absorption and scattering) of the radiation transmitted through a sample. However, there is one more parameter of particle-light interaction characterizing light propagation inside a medium, namely, the average cosine of scattering (scattering anisotropy factor), ; it varies within the interval . Unity is related to the fully forward scattering; negative unity, to the fully backward scattering; while a zero value corresponds to isotropic or symmetrical scattering. Assuming the refractive index of the horny layer (Ref. 1), we calculated the relative scattering, absorption, and extinction efficiency factors referred to the particle diameter , , and , respectively, and for the radiation of the two already-mentioned wavelengths for the diameters of particles ranging from with a step. The results of the calculations are depicted in Fig. 2 . The ratios , , and are more representative than , , and because further in our Monte Carlo simulations we use values of and [see Eqs. 2, 3] as input parameters. As we see from Fig. 2, plots of and have local maxima and minima. In contrast to three curves for light, there is only one for light. The extinction and scattering curves for are very close because of low absorption, so one curve is depicted. The most pronounced effect of sun protection is assumed to be for those particles, which have the largest and the smallest values. Table 2 shows the diameters of particles corresponding to such values. Fig. 2Relative scattering, absorption, and extinction efficiency factors referred to (a) the particle diameter , , and , respectively, and (b) anisotropy factor for different diameters of particles for incident radiation of 310 and .  Table 2Diameters of TiO2 particles corresponding to the maximal values of relative extinction efficiency factor referred to the particle diameter (Qext∕d) and minimal values of anisotropy factor g for the considered wavelengths.
2.3.Monte Carlo SimulationsThe Monte Carlo method implemented into a developed computer 3-D code using Delphi® software environment, was applied to simulate the propagation of light of the UVA and UVB spectral regions within the stratum corneum with imbedded particles. Figure 3 illustrates the geometry of the sample model. Incident light is directed perpendicularly to the air-skin interface. The collimated incidence is modeled instead of diffuse light, which perhaps would be more relevant for a sunbather (because of the curvature of body parts and if some overcast takes place) due to the following reasons. The sample surface is infinite; and we consider the integral characteristics of the registered radiation (over the whole surface or within the whole layer). The computational model of the stratum corneum consists of an infinitely wide plain layer, the upper part of which ( -thick) contains particles. The total thickness of both parts is , which corresponds to the real dimension of this skin layer on most areas of the human body to be protected by sunscreens (face, back, shoulders, arms, legs); only palms and soles have thicker stratum corneum (up to ) caused by more intensive use of hands and feet.22, 25 The Monte Carlo method is used to simulate propagation of photons inside both parts of the horny layer. One million photons were injected into the skin. All results are normalized by this value. Such an amount ensures suitable calculation time of about for each set of parameters and statistical error of less than 3%. Imaginary detectors are located on the outer sides of each part of the horny layer. The lowermost one separates the stratum corneum from the epidermis. In vivo such tissue-detector localization can hardly be achieved noninvasively, making simulations very important. Some experiments were performed recently in vivo to reveal the protection effect of administered sunscreens, but disturbing living tissue with detectors situated between epidermis and dermis.26 The detectors collect photons coming from the horny layer into the air or epidermis. In this paper, we consider only “unshaded” effect of the horny layer with nanoparticles added, not taking into account deeper localized skin layers as scattering and absorbing media. The epidermis in this paper affects only the mismatch of refractive indices between itself and the stratum corneum. It is not described by any optical parameters except the refractive index [ (Ref. 1)] because all UV photons penetrating into the epidermis are considered as potentially dangerous for its viable cells. Therefore, the topically applied substances are used to decrease the amount of UV light transmitted through the horny layer. Further consideration of photons migration within the epidermis and lower layers is not involved in this paper, but we realize that these layers affect the total amount of radiation detected on the surface of the skin and inside. Namely, UV photons penetrating into the epidermis can also be scattered back into the stratum corneum without inflicting any damage. Once in the stratum corneum, they may (1) exit the skin into air, thus becoming completely harmless; (2) be absorbed in the stratum corneum (adding to the temperature rise in there); or (3) get scattered back into the epidermis. Not only does this reduce the fluence level in the epidermis, but the ratios between the already-mentioned three events varies strongly with particle diameter and light wavelength. In this paper, the following components of the radiation are registered: the amount of photons totally reflected in the backward direction (detected on the surface of the skin), absorbed within each part of the stratum corneum, and transmitted both through the upper part and the whole horny layer. Fig. 3Schematic model of stratum corneum used for simulations: 1, incident light; 2, diffusely scattered light; 3, absorbed light; 4, transmitted light; 5, upper part of the horny layer ( thick, with particles); 6, lower part (without particles); 7 and 8, imaginary photodetectors. Total thickness of both parts of stratum corneum (5 and 6) is .  Cells of the stratum corneum are known to be shaped as flat cylinders.27 Although they differ from other cells of internal skin layers such as the epidermis and the dermis, the Henyey-Greenstein (HG) phase function28 seems to give a satisfactory characterization for the stratum corneum scattering behavior in the UV region, which was deduced from the comparison of experimental data and calculations results:29 where is the scattering anisotropy factor. The circumferential angle is defined30 as , where Random is a Delphi®-software-generated random value, evenly distributed within the interval of (0,1).In this paper, we consider a superposition of the horny layer matrix (host medium) and particles imbedded into it. These particles are of nanosize and are assumed to be spherical. Light scattering from such particles is described31 by the Mie phase function obtained by the software MieTab 7.23 mentioned earlier. The hybrid scattering phase function for the upper part of the horny layer (with particles) used in these simulations is where , is a scattering coefficient of particles of the concentration determined by Eq. 2, and is a scattering coefficient of the horny layer matrix. Equation 5 is a simplified form of the scattering phase function of a mixture of polydisperse particles, where each kind of particle has its own scattering phase function.32 The use of a linear combination of two phase functions is not unusual: previously, the HG function and an isotropic term were suggested to describe light scattering in human dermis33 and dental enamel and dentin,34 a modified HG function with a normalization factor was used for human-brain and stomach,35 while a double HG function was used for white matter of a neonate brain.36 The mean free path and a free path of a photon are defined as where is an absorption coefficient of particles of the concentration determined by Eq. 3, and is an absorption coefficient of the horny layer matrix. The optical properties of the matrix for the considered wavelengths are shown in Table 3 . Interaction between a photon and an equivalent quasiparticle is simulated. The medium consisting of such quasiparticles combines optical properties of both the horny layer matrix and the nanoparticles. A quasiparticle can scatter or absorb an incident photon. The photon is scattered with the probability determined asIn any other case it is absorbed. A more detailed description of the algorithm can be found elsewhere.38 The volume concentration of particles was 5%.Table 3Optical properties of the horny layer matrix for the wavelengths used in simulations (Refs. 1 and 37).
3.Results and DiscussionFigures 4, 5, 6, 7, 8, 9, 10 represent different aspects of the interaction between the nanoparticles at various sizes with the volume concentration of 5% within the horny layer matrix and the incident radiation of 310- and wavelengths. Fig. 4Absorption within the upper part of the horny layer (with particles) for incident radiation of 310 (∎) and (◻). The volume concentration of particles is 5%.  Fig. 5Total reflection from the whole horny layer ( -thick) for incident radiation of 310 (◆) and (◇). The volume concentration of particles is 5%.  Fig. 6Transmission through the upper part of the horny layer for 310- (●) and (엯) light. The volume concentration of particles is 5%.  Fig. 7Absorption within the lower part of the horny layer (pure stratum corneum, without titanium dioxide particles) for incident radiation of 310 (●) and (엯). The volume concentration of particles is 5%.  Fig. 8Absorption within the whole horny layer ( -thick) for the light of 310 (▴) and (▵). The volume concentration of particles is 5%. 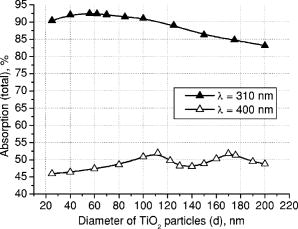 Fig. 9Transmission through the whole horny layer ( -thick) for different wavelengths of incident light: 310 (●) and (엯). The volume concentration of particles is 5%. 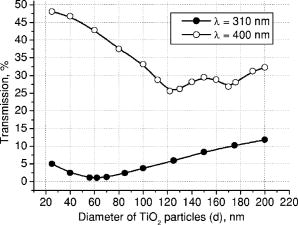 Fig. 10Effect of the “best” particles [sizes of (a) 62 and (b) ] distributed homogeneously within the -thick upper part (volume concentration 5%) of the -thick horny layer for (a) 310- and (b) light.  Absorption inside the upper part of the stratum corneum is shown in Fig. 4. As Fig. 2(a) illustrates, the extinction curve for the wavelength (the left uppermost curve) is obtained as a sum of the absorption (middle left) and scattering (lower left) curves. The absorption dominates almost all over the range of considered sizes (up to the sizes of about ), especially at small diameters. The maxima of absorption and extinction correspond to the sizes of 56 and , respectively, which provide the highest absorption among all the diameters (at a level of about 90% of the incident light) within the upper part of the stratum corneum (see Fig. 4). The large particles (size more than ) absorb less radiation than the smaller ones (Fig. 4, the upper curve); this corresponds to the feature of the absorption curve of Fig. 2(a). The extinction curve at radiation represented in Fig. 2(a) (the right curve) almost entirely coincides with the scattering curve due to very weak absorption properties of the nanoparticles for this wavelength. It has two maxima, at sizes of 122 and , which also show the most pronounced absorption in the upper part of the horny layer (Fig. 4, the lower curve). This is not a contradiction as perhaps could be supposed at the first glance: because of strong scattering, the trajectories of photons inside the medium become curlier and the probability of being absorbed increases (the host medium can absorb light). This phenomenon of synergy was investigated experimentally also for some kinds of scattering microparticles increasing the absorption of inorganic UV filters.39 Absorption of light induced by particles is weak, correlating with a low magnitude of the extinction (scattering) curve, as shown in Fig. 2(a), that results in weak interaction between particles and photons. In contrast to the extinction curve, large particles (more than in diameter) absorb radiation more intensively than the smaller ones (Fig. 4, the lower curve). Figure 5 shows totally reflected (specular and diffusely scattered in backward direction) light from the whole horny layer (partially filled with particles) detected on the surface of the sample. Reflection of radiation is rather low and does not exceed 7.5% even for most reflecting particles of in diameter. Such size corresponds to the maximum of scattering curve in Fig. 2(a) although particles (corresponding to the maximum of extinction curve) are only a bit less reflecting (scattering). Particles that are of and larger reflect almost at a constant level because the scattering curve in Fig. 2(a) is not steep at these sizes and decreases moderately. The picture changes drastically if the curve for radiation is considered (Fig. 5, the upper curve). There is a pronounced maximum at the size of , matching neither the first (at ) nor the second (at ) maximum of the extinction (scattering) curve in Fig. 2(a). This location is caused by both the extinction [Fig. 2(a)] and anisotropy [Fig. 2(b)] curves. Intensive scattering (maximum near the size of ) combined with moderate value of the anisotropy factor (local minimum near the size of ) result in the value of as the most reflecting size for light. Note that the -factor does not significantly influence the reflection of light because scattering is strongly suppressed by high absorption [Fig. 2(a)]. Both absorption in the upper part and total reflection affect transmission (Fig. 6) into the lower part of the horny layer (free of the particles). The more photons are absorbed in the upper part of the horny layer, the fewer reach the lower part, which is 19 times thicker than the upper one, so the plots look like inverted ones from Fig. 4. For most particles (122 and in size) attenuating the light, the transmission is still higher than 60% of the incident radiation, while light is attenuated to 50% by particles and to less than 5% by those with the sizes of 56 and . Absorption of 310- and light within the lower part of the stratum corneum is depicted in Fig. 7. The sizes responsible for high transmission into the lower part (Fig. 6) cause also high absorption there. High absorption of light in the upper part for 56- and particles causes insignificant (less than 5%) absorption in the lower part, although the horny layer matrix is more absorbing at radiation than at light. Particles from the upper part with sizes strongly shifted from the maximum of the absorption curve [56 nm, see Fig. 2(a)] to the larger sizes , affect in such a way that absorption in the lower part (Fig. 7) is comparable with that in the upper part (Fig. 4), although the former contains no particles at all (but the lower part is 19 times thicker than the upper one). Absorption of radiation is within a range of 35 to 42%, which is considerably higher than in the upper part due to the thicker lower layer. Figure 8 shows the total absorption in both parts of the stratum corneum. These plots were obtained by summation of the plots from Figs. 4 and 7. We see that absorption of light exceeds that of light about two times. Note that the maximum of the curve coincides with that of the absorption curve in Fig. 2(a), while the maxima of the curve do not entirely: the largest absorption corresponds to the 112- and particles. This follows from the features of the curves in Figs. 4 and 7. Large absorption in the lower part if particles (see Fig. 7, the upper curve) are present in the upper part, in combination with comparable large (but not the highest) absorption in the upper part (see Fig. 4) result in the position of the first maximum at size in Fig. 8. Particles of 170 and achieve the largest total absorption mainly because of high absorption in the upper layer (see Fig. 4, the lower curve). Total transmission from the whole horny layer into the epidermis is represented in Fig. 9. This property of the host medium partially filled with particles is the most important because it shows the amount of the incident UV radiation reaching the epidermal viable cells. The protection effect of sunscreens is focused on decreasing this value. Transmission is the lowest in presence of 56- and particles (for light)—about 1%—and 122- and particles (for radiation)—about 25%. The results demonstrate that the “best” sizes in regard to minimizing the transmitted light coincide with the peaks of the extinction and absorption (for light, similarly to light40) and extinction (scattering) (for light) curves. Figure 10 illustrates the effect of the “best” particles if they are distributed homogeneously within the -thick upper part (volume concentration 5%) of the -thick horny layer. As it is seen, transmission of light in particle-free stratum corneum (the 0% column) is about 25% caused mostly by absorption in the lower part (65%), due to larger thickness than the upper part; the total reflection is insignificant (5%). If the particles are added, the transmission goes down to 1%, mostly because of large absorption in the upper part (about 90%); reflection increases (to more than 6%). In case of light, the horny layer without particles transmits almost half of the incident radiation (49%), with 45% absorbed totally in both parts (42% in the lower part) and 6% reflected. The particles decrease the whole transmission to 25% due to pronounced total reflection (25%). An increase of absorption in the upper part (from 3 to 15%) and a decrease in the lower part (from 42 to 35%) follow from the increase of the total absorption by 5% only. 4.ConclusionsThis paper considered the effect of particles on UV light protection properties of the outer layer of human skin, the horny layer, or stratum corneum. Incident UV radiation of (UVB spectral region) and (UVA spectral region) was used in the simulations. Our results show the definite sizes of particles which are preferable for the task. These sizes are usually related to the maxima of the dependence of extinction efficiency factor referred to the particle diameter (extinction curve) on the particle size. Alongside such diameters, sizes corresponding to maxima of the absorption curve for highly absorbable radiation are also a subject to consider. For the light, the best protective particle sizes (diameters) are 56 and , decreasing transmission through the horny layer to 1%, mostly due to the absorption mechanism. Being the best reflectors among the size range, the 122- and spheres decrease the transmission of 400–nm light by more than two times from around 50 to 25%. Taking into account that the UV spectrum includes a band of wavelengths, and as is seen from the calculations, each wavelength dictates its own “best” particle size (the longer wavelength to be attenuated, the larger particles should be applied), the sunscreen yielding the most efficient protection from all UV rays should contain, to our mind, a mixture of nanoparticles with diameters between 50 and (roughly). The peak of the distribution should be shifted to the smaller sizes. AcknowledgmentsA.P.P. and A.V.P. acknowledge partial support by the grant of the President of Russian Federation “Scientific schools” No. 2071.2003.4. A.P.P. acknowledges also Infotech Graduate School and the DAAD (Germany) for financial support. ReferencesV. V. Tuchin, Tissue Optics, SPIE Press, Bellingham, WA (2000). Google Scholar
V. V. Tuchin, Handbook of Optical Biomedical Diagnostics, SPIE Press, Bellingham, WA (2002). Google Scholar
R. F. Edlich,
K. L. Winter,
H. W. Lim,
M. J. Cox,
D. G. Becker,
J. H. Horovitz,
L. S. Nichter,
L. D. Britt, and
W. B. Long,
“Photoprotection by sunscreens with topical antioxidants and systematic antioxidants to reduce sun exposure,”
J. Long-Term Effects Med. Implants, 14 317
–340
(2004). Google Scholar
B. Innes,
T. Tsuzuki,
H. Dawkins,
J. Dunlop,
G. Trotter,
M. R. Nearn, and
P. G. McCormick,
“Nanotechnology and the cosmetic chemist,”
Cosmet., Aerosols Toilet. Austr., 15 1021
–1224
(2002). Google Scholar
A. F. McKinlay and
B. L. Diffey,
“A reference action spectrum for ultraviolet induced erythema in human skin,”
CIE J., 6 17
–22
(1987). 0252-9246 Google Scholar
B. L. Diffey,
“Solar ultraviolet radiation effects on biological systems,”
Phys. Med. Biol., 36 299
–328
(1991). https://doi.org/10.1088/0031-9155/36/3/001 0031-9155 Google Scholar
B. Diffey,
“Climate change, ozone depletion and the impact on ultraviolet exposure of human,”
Phys. Med. Biol., 49 R1
–R11
(2004). https://doi.org/10.1088/0031-9155/49/1/R01 0031-9155 Google Scholar
W. G. Warner,
J. J. Yin, and
R. R. Wei,
“Oxidative damage to nucleic acids photosensitized by titanium dioxide,”
Free Radic Biol. Med., 851
–858
(1997). 0891-5849 Google Scholar
J. Lademann,
H.-J. Weigmann,
H. Schaefer,
G. Mueller, and
W. Sterry,
“Investigation of the stability of coated titanium microparticles used in sunscreens,”
Skin Pharmacol. Appl. Skin Physiol., 13 258
–264
(2000). 1422-2868 Google Scholar
P. P. Ahonen,
J. Joutensaari,
O. Richard,
U. Tapper,
D. Brown,
J. Jokiniemi, and
E. Kauppinen,
“Mobility size development and the crystallization path during aerosol decomposition synthesis of particles,”
J. Aerosol Sci., 32 615
–630
(2001). https://doi.org/10.1016/S0021-8502(00)00107-5 0021-8502 Google Scholar
A. F. McKinlay and
B. L. Diffey,
“A reference action spectrum for ultraviolet induced erythema in human skin,”
Human Exposure to Ultraviolet Radiation: Risks and Regulations, 83
–87 Elsevier, Amsterdam (1987). Google Scholar
R. B. Setlow,
E. Grist,
K. Thompson, and
A. D. Woodhead,
“Wavelengths effective in induction of malignant melanoma,”
Proc. Natl. Acad. Sci. U.S.A., 90 6666
–6670
(1993). 0027-8424 Google Scholar
H.-J. Weigmann,
J. Lademann,
S. Schanzer,
U. Lindemann,
R. von Pelchrzim,
H. Schaefer,
W. Sterry, and
V. Shah,
“Correlation of the local distribution of topically applied substances inside the stratum corneum determined by tape-stripping to differences in bioavailability,”
Skin Pharmacol. Appl. Skin Physiol., 14 98
–102
(2001). 1422-2868 Google Scholar
U. Lindemann,
K. Wilken,
H.-J. Weigmann,
H. Schaefer,
W. Sterry, and
J. Lademann,
“Quantification of the horny layer using tape stripping and microscopic techniques,”
J. Biomed. Opt., 8 601
–607
(2003). https://doi.org/10.1117/1.1609200 1083-3668 Google Scholar
H.-J. Weigmann,
U. Jacobi,
C. Antoniou,
G. Tsikrikas,
V. Wendel,
C. Rapp,
H. Gers-Barlag,
W. Sterry, and
J. Lademann,
“Determination of penetration profiles of topically applied substances by means of tape stripping and optical spectroscopy: UV filter substance in sunscreen,”
J. Biomed. Opt., 10 014009
(2005). https://doi.org/10.1117/1.1854683 1083-3668 Google Scholar
H.-J. Weigmann,
J. Lademann,
H. Meffert,
H. Schaefer, and
W. Sterry,
“Determination of the horny layer profile by tape stripping in combination with optical spectroscopy in the visible range as a prerequisite to quantify percutaneous absorption,”
Skin Pharmacol. Appl. Skin Physiol., 12 34
–45
(1999). 1422-2868 Google Scholar
J. Lademann,
H.-J. Weigmann,
C. Rickmeyer,
H. Barthelmes,
H. Schaefer,
G. Mueller, and
W. Sterry,
“Penetration of titanium dioxide microparticles in a sunscreen formulation into the horny layer and the follicular orifice,”
Skin Pharmacol. Appl. Skin Physiol., 12 247
–256
(1999). 1422-2868 Google Scholar
, COLIPA SPF Test Method,
(1994) Google Scholar
J. Lademann,
A. Rudolph,
U. Jacobi,
H.-J. Weigmann,
H. Schafer,
W. Sterry, and
M. Meinke,
“Influence of nonhomogeneous distribution of topically applied UV filters on sun protection factors,”
J. Biomed. Opt., 9 1358
–1362
(2004). https://doi.org/10.1117/1.1805557 1083-3668 Google Scholar
U. Jacobi,
N. Meykadeh,
W. Sterry, and
J. Lademann,
“Effect of the vehicle on the amount of stratum corneum removed by tape stripping,”
J. Dt. Dermatol. Gesell., 1 884
–889
(2003). Google Scholar
H.-J. Weigmann,
U. Lindemann,
C. Antoniou,
G. N. Tsikrikas,
A. I. Stratigos,
A. Katsambas,
W. Sterry, and
J. Lademann,
“UV∕VIS absorbance allows rapid, accurate, and reproducible mass determination of corneocytes removed by tape stripping,”
Skin Pharmacol. Appl. Skin Physiol., 16 217
–227
(2003). 1422-2868 Google Scholar
J. Lademann,
H. Richter,
N. Otberg,
F. Lawrenz,
U. Blume-Peytavi, and
W. Sterry,
“Application of a dermatological laser scanning confocal microscope for investigation in skin physiology,”
Laser Phys., 13 756
–760
(2003). 1054-660X Google Scholar
M. W. Ribarsky,
“Titanium dioxide (rutile),”
Handbook of Optical Constants of Solids, 795
–804 Academic Press, Orlando, FL (1985). Google Scholar
P. J. Caspers,
G. W. Lucassen, and
G. J. Pupplels,
“Combined in vivo confocal Raman spectroscopy and confocal microscopy of human skin,”
Biophys. J., 85 572
–580
(2003). 0006-3495 Google Scholar
J. Lademann,
U. Jacobi,
H. Richter,
N. Otberg,
H.-J. Weigmann,
H. Meffert,
H. Schaefer,
U. Blueme-Peytavi, and
W. Sterry,
“In vivo determination of UV-photons entering into human skin,”
Laser Phys., 14 234
–237
(2004). 1054-660X Google Scholar
H. Schaefer and
T. Redelmeier, Skin Barrier: Principles of Percutaneous Absorption, Karger, Basel (1996). Google Scholar
L. G. Henyey and
J. L. Greenstein,
“Diffuse radiation in the galaxy,”
Astrophys. J., 93 70
–83
(1941). https://doi.org/10.1086/144246 0004-637X Google Scholar
W. A. G. Bruls and
J. C. van der Leun,
“Forward scattering properties of human epidermal layers,”
Photochem. Photobiol., 40 231
–242
(1984). 0031-8655 Google Scholar
E. D. Cashwell and
C. J. Everett, A Practical Manual on the Monte Carlo Method for Random Walk Problems, Pergamon Press, New York (1959). Google Scholar
H. C. van de Hulst, Light Scattering by Small Particles, Wiley, New York (1957). Google Scholar
J. R. Murant,
J. P. Freyer,
A. H. Hielscher,
A. A. Eick,
D. Shen, and
T. M. Johnson,
“Mechanisms of light scattering from biological cells relevant to noninvasive optical-tissue diagnostics,”
Appl. Opt., 37 3586
–3593
(1998). 0003-6935 Google Scholar
S. L. Jacques,
C. A. Alter, and
S. A. Prahl,
“Angular dependence of HeNe laser light scattering by human dermis,”
Lasers Life Sci., 1 309
–333
(1987). 0886-0467 Google Scholar
D. Fried,
R. E. Glena,
J. D. B. Featherstone, and
W. Seka,
“Nature of light scattering in dental enamel and dentin at visible and near-infrared wavelengths,”
Appl. Opt., 34 1278
–1285
(1995). 0003-6935 Google Scholar
P. Thueler,
I. Charvet,
F. Bevilacqua,
M. St. Ghislain,
G. Ory,
P. Marquet,
P. Meda,
B. Vermeulen, and
C. Depeursinge,
“In vivo endoscopic tissue diagnostics based on spectroscopic absorption, scattering, and phase function properties,”
J. Biomed. Opt., 8 495
–503
(2003). https://doi.org/10.1117/1.1578494 1083-3668 Google Scholar
A. Kienle,
F. K. Forster, and
R. Hibst,
“Influence of the phase function on determination of the optical properties of biological tissue by spatially resolved reflectance,”
Opt. Lett., 26 1571
–1573
(2001). 0146-9592 Google Scholar
M. J. C. van Gemert,
S. L. Jacques,
H. J. C. M. Sterenborg, and
V. M. Star,
“Skin optics,”
IEEE Trans. Biomed. Eng., 36 1146
–1154
(1989). https://doi.org/10.1109/10.42108 0018-9294 Google Scholar
A. P. Popov and
A. V. Priezzhev,
“Laser pulse propagation in turbid media: Monte Carlo simulation and comparison with experiment,”
Proc. SPIE, 5068 299
–308
(2003). https://doi.org/10.1117/12.518792 0277-786X Google Scholar
J. Lademann,
S. Schanzer,
U. Jacobi,
H. Schaefer,
F. Pflücker,
H. Driller,
J. Beck,
M. Meinke,
A. Roggan, and
W. Sterry,
“Synergy effects between organic and inorganic UV filters in sunscreens,”
J. Biomed. Opt., 10 014008
(2005). https://doi.org/10.1117/1.1854112 1083-3668 Google Scholar
A. P. Popov,
M. Yu. Kirillin,
A. V. Priezzhev,
J. Lademann,
J. Hast, and
R. Myllylä,
“Optical sensing of titanium dioxide nanoparticles within horny layer of human skin and their protecting effect against solar UV radiation,”
Proc. SPIE, 5702 113
–122
(2005). 0277-786X Google Scholar
|
||||||||||||||||||||||||||||||||


