
|
|
1.IntroductionPhotosensitization is an important process in biological and medical applications, including photodynamic therapy (PDT),1, 2, 3 and it has been a subject of extensive studies over the last two decades. While continuous wave (cw) light is more widely used for PDT, photosensitization using pulsed light excitation exhibits unique features derived from the nature of pulsed light with transient high-density photon flux, involving various reaction kinetics related to the sensitizer triplet state such as triplet-triplet reactions,4 multiphoton excitation,5 and saturated absorption by the ground-state photosensitizer.6, 7, 8 The last phenomenon may lead to a clinical advantage in PDT because it may result in deeper optical penetration in tissue than that using cw light excitation.9, 10 However, it is not clear whether the treatable tissue depth can be increased by the use of pulsed light irradiation;8 the mechanism of pulsed photosensitization has not been fully elucidated. We previously demonstrated that in -mediated PDT using nanosecond pulsed light excitation, phototoxicity to A549 cells was increased by lowering the pulse repetition rate in the range of 5– , though lowering the pulse repetition rate resulted in no significant difference in either the magnitude of decrease in oxygen partial pressure measured above the cells or the amount of fluorescence degradation (photobleaching) for the cells.11 To understand the photosensitization mechanism, we proposed a method for analysis of photochemical reaction dynamics using fluorescence-oxygen diagrams (Fig. 1 ) that show the correlation between decrease in oxygen partial pressure and photobleaching during treatment. On the basis of the analysis, we observed complex behaviors in the reaction dynamics at high repetition rates.11 At 30 and , photobleaching initially proceeded with decrease in oxygen partial pressure, but this was switched to a regime of fluorescence degradation with limited oxygen consumption, which was reswitched to a regime of efficient oxygen consumption accompanying fluorescence degradation [Figs. 1a and 1b]; in these cases, phototoxicities were limited.11 At , on the other hand, such complex behaviors were not clearly seen [Fig. 1c]; photobleaching proceeded with decrease in oxygen partial pressure over the whole irradiation period and the highest phototoxicity was obtained.11We presumed that the complex behaviors observed in the diagrams at 30 and were associated with the subcellular distribution characteristics of during the treatment.11 In the present study, we investigated how the intracellular kinetics of the sensitizer is correlated with the photochemical reaction dynamics in the course of pulsed photodynamic treatment. On the basis of the results, we discuss the photochemical reaction dynamics shown by the fluorescence-oxygen diagrams. We also discuss how the intracellular kinetics of the sensitizer affects the resultant photosensitization efficacy. Fig. 1Fluorescence-oxygen diagrams for irradiations at repetition rates of (a), (b), and (c); these are reproduced from Ref. 11. The diagrams show correlation between photochemical oxygen consumption and photobleaching for -sensitized A549 cells during photodynamic treatment with nanosecond pulsed light; the experimental conditions were the same as those in the present study. Photobleaching with limited oxygen consumption is seen at 10 and ; linear fitting curves for the plots before the appearance of the photobleaching with limited oxygen consumption are shown (a and b). Distinct discontinuity in the correlation is not seen at ; a linear fitting curve is given for all plots in this case (c). 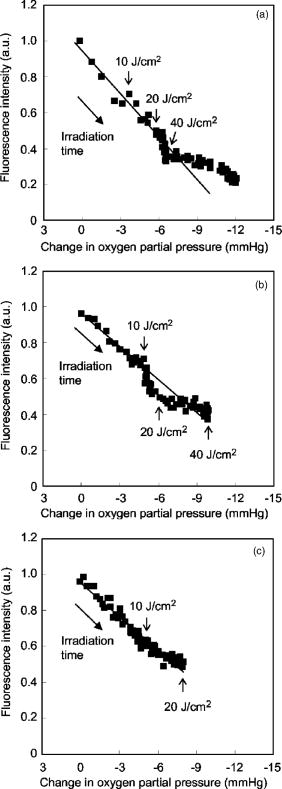 2.Materials and Methods2.1.Photosensitiser[13,17-bis (1-carboxypropionyl) carbamoylethyl-8-etheny-2-hydroxy-3-hydroxyiminoethyl-idene-2,7,12,18-tetraethyl porphyrin sodium] was kindly provided by Photochemical Company (Okayama, Japan). Stock solutions were prepared by dissolving the sensitizer in phosphate-buffered saline (PBS; Invitrogen Corp., Carlsbad, CA) at a concentration of and were stored at . Immediately before use, further dilutions of the stock solution were made in culture medium with the final concentration of . 2.2.Cell CultureA549, a human lung adenocarcinoma cell line, was obtained from RIKEN BioResource Center (Tsukuba, Japan). The cells were grown in suspension at under a humidified atmosphere of 95% air–5% using Dulbecco’s modified Eagle’s medium (DMEM; Invitrogen Corp., Carlsbad, CA) supplemented with 10% heat-inactivated fetal bovine serum (FBS; Sigma, Tokyo, Japan), 10,000-U/mL crystalline penicillin G potassium (Meiji, Tokyo, Japan), and streptomycin sulfate (Meiji, Tokyo, Japan). 2.3.Laser SystemAn OPO pumped by the third harmonics of an Nd:YAG laser (Quantra-Ray MOPO-710 and Quantra-Ray GCR-290; Spectra Physics, CA) was used as an excitation light source; the beam had a pulse width of in FWHM and the output pulses were tuned at . The beam was reflected by a silica prism, expanded by a silica concave lens with a 25-mm focal length, and delivered to cells on the microscope. The cells were irradiated with the light pulses at a repetition rate of 5, 10, or . Since the original pulse repetition rate of the OPO was fixed at , a mechanical laser shutter was used for tuning the repetition rate to 5 or . The pulse peak intensity was set at , the corresponding irradiances at 5, 10, and being 50, 100, and , respectively. 2.4.Subcellular Localization ofA549 cells were grown on glass coverslips in 35-mm culture dishes ( cells per dish). Following of incubation, the cells were incubated with solutions of in culture medium. After of incubation, the cells were washed twice with PBS and stained with LysoTracker Green DND-26 (Molecular Probes, Inc., Eugene, OR), a fluorescent probe for labeling acidic organelles in living cells, for in the incubator. They were washed with PBS again, and the fluorescence of and that of LysoTracker Green were observed with an inverted fluorescence microscope (TE2000-U, Nikon, Tokyo, Japan) equipped with a xenon lamp source for epifiuorescence illumination and a CCD camera (ORCA-ER, Hamamatsu Photonics, Shizuoka, Japan). In the microscope, a (1.40 NA) oil immersion plane apochromat objective (Nikon, Tokyo, Japan) and sets of filters appropriate for fluorescence excitation and collection of (excitation, ; collection, ; dichroic, ) (Chroma Technology Corp., Rockingham, VT) and for those of LysoTracker Green (excitation, ; barrier, , dichroic, ) (B-2A, Nikon, Tokyo, Japan) were used. 2.5.Subcellular Distribution of during Photodynamic TreatmentsSubcellular distribution of during photodynamic treatment was obtained from fluorescence images as a function of radiant exposure using an inverted fluorescence microscope (TE2000-U, Nikon, Tokyo, Japan) equipped with a xenon lamp source for epifluorescence illumination and a CCD camera (ORCA-ER, Hamamatsu Photonics, Shizuoka, Japan). In the microscope, a (0.95 NA) plane apochromat objective (Nikon, Tokyo, Japan) and a set of filters appropriate for fluorescence excitation and collection of (excitation, 510– ; barrier, ; dichroic, ) (G-2A, Nikon, Tokyo, Japan) were used. Captured images were processed on a PC using Aquacosmos software (Hamamatsu Photonics, Shizuoka, Japan). A549 cells were seeded on glass coverslips in 35-mm culture dishes ( cells per dish). After of incubation, the cells were exposed to solutions of in culture medium. After a further of incubation, the cells were rinsed twice and covered with PBS. Immediately after this procedure, the dish was mounted on the microscope, and a 667-nm pulsed light from an OPO was delivered to the cells on the microscope. Fluorescence micrographs were taken immediately after irradiation with an exposure time of , for which different samples were used to minimize the effect of fluorescence excitation on the cells. 2.6.Analysis of Localization Characteristics ofWe previously observed that in A549 cells, was mainly localized in lysosomes before photodynamic treatment and that the localization characteristics were shown by a bright and spotty pattern in a fluorescence micrograph. After treatment with irradiation of at , the sensitizer was redistributed to the cytosol. To investigate such intracellular dynamics of the sensitizer, we analyzed fluorescence micrographs in which bright spots indicate sensitizer-accumulated lysosomes. To quantify the extent of lysosomal localization of the sensitizer, the number density of high-intensity fluorescent spots for a cell was evaluated by the following procedure. Using image analyzing software (Aquacosmos software, Hamamatsu Photonics), the average fluorescence intensity for each cell, i.e., integrated fluorescence intensity divided by the area of cell, was calculated. The threshold intensity was determined to be seven-times higher than the average intensity of the cell; this was found to be the most appropriate criterion for evaluating cells with various stages of sensitizer localization. Using the threshold intensity, a binary image of spots was obtained [Fig. 2b ] and the number of spots per cell was counted. The number of spots was then divided by the area of the cell, and the number density of spots for the cell was obtained. In this analysis, a decrease in the number density of spots for a cell indicates release of the sensitizer from lysosomes and consequent increase in density of the sensitizer or fluorescence intensity within the whole cytoplasm. In each irradiation condition, at least 48 cells in at least three different dishes were analyzed; for each dish, more than four different areas were imaged. Since the number density of spots for a cell was determined on the basis of average fluorescence intensity of an individual cell in this method, it was possible to evaluate the extent of subcellular sensitizer localization despite decrease in the total fluorescence intensity due to photobleaching. Fig. 2(a) Typical fluorescence micrograph of an -sensitized A549 cell before photodynamic treatment. (b) Binary image obtained from image (a) with threshold fluorescence intensity that is seven-times higher than the average intensity within the cell. Dashed line shows the outline of the cell. The white bar at the bottom of panel (a) represents . 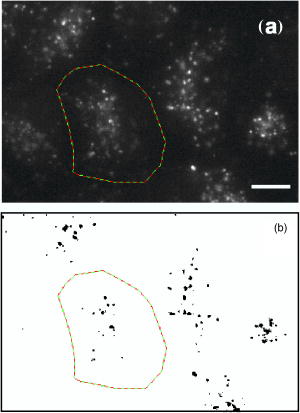 3.Results3.1.Subcellular Localization ofFluorescence micrographs of A549 cells double-stained with and LysoTracker Green are shown in Fig. 3 . A comparison of Fig. 3a [fluorescence from ] and Fig. 3b (fluorescence from LysoTracker Green) shows similar patterns of localization, indicating that molecules accumulate mainly in lysosomes after incubation for . Fig. 3Fluorescence micrographs showing subcellular localization of in LysoTracker Green and A549 cells; image (a) shows fluorescence from and image (b) shows fluorescence from LysoTracker Green, a fluorescent probe for labeling acidic organelles in living cells. The white bar at the bottom of each panel represents . 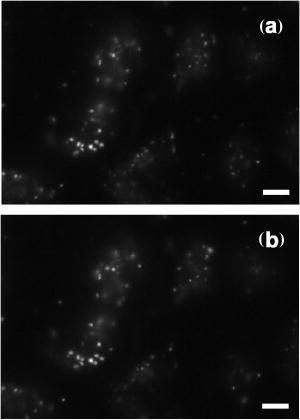 3.2.Dose-dependent Intracellular Distribution ofTo investigate the correlation between the fluorescence-oxygen diagram (Fig. 1) and intracellular dynamics of , we acquired fluorescence micrographs of A549 cells that had been photodynamically treated with different radiant exposures at repetition rates of 5, 10, and . At , subcellular distributions of after irradiations of 10 and were shown by bright and spotty patterns [Figs. 4b and 4c ], which were similar to the initial localization characteristics [Fig. 4a]. After an irradiation of , fluorescence intensity in the spots, i.e., in the lysosomes, became slightly weaker and that in the cytoplasm became stronger [Fig. 4d]. Bright spots almost disappeared after an irradiation of , and fluorescence completely diffused within the whole cytoplasm [Fig. 4e]. Cross-sectional profiles of the fluorescence intensity distributions for 0, 20, and are shown in Figs. 4f, 4g, 4h, respectively. The profiles in the early periods of irradiations (0 and ) consist of a low-intensity, gentle curve showing the sensitizer in the cytosol and a high-intensity, sharp peak showing the sensitizer localized in lysosomes. For the initial localization profile [Fig. 4f], the peak fluorescence intensity in lysosomes was about three-times higher than that in the cytosol. On the other hand, the fluorescence profile after an irradiation of was almost flat [Fig. 4h]. At , dose-dependent characteristics of subcellular distribution of the sensitizer were similar to those at , i.e., initial localization characteristics were maintained after an irradiation of , but after an irradiation of , fluorescence in the spots became weaker accompanying an increase in the fluorescence intensity within the cytoplasm; this tendency continued after (data not shown). At , a spotty pattern remained after an irradiation of , the radiant exposure at the end of the fluorescence-oxygen diagram [Fig. 1c]. A comparison of the cross-sectional profile for at [Fig. 5d ] and that at [Fig. 4g] indicates that fluorescence intensities in the lysosomes are much lower at than at , while fluorescence intensities in the cytosols are comparable. Fig. 4Fluorescence micrographs showing subcellular distribution of in A549 cells before and during photodynamic treatment at : (a) , (b) , (c) , (d) , and (e) . Subcellular distributions in the early irradiation periods are shown by a bright and punctate fluorescence pattern. The cross-sectional fluorescence intensity profiles of A-A’ in image (a) and C-C’ in image (c) are shown in (f) and (g), respectively. These profiles consist of a low-intensity, gentle profile showing the sensitizer in the cytosol and a high-intensity, spotty profile showing the sensitizer localized in lysosomes. After irradiations of 40 and , fluorescence became much weaker and diffuse within the whole cytoplasm. The fluorescence intensity profile of E-E’ in image (e) is shown in (h); the profile is almost flat. The white bar at the bottom of each panel from (a) to (e) represents . 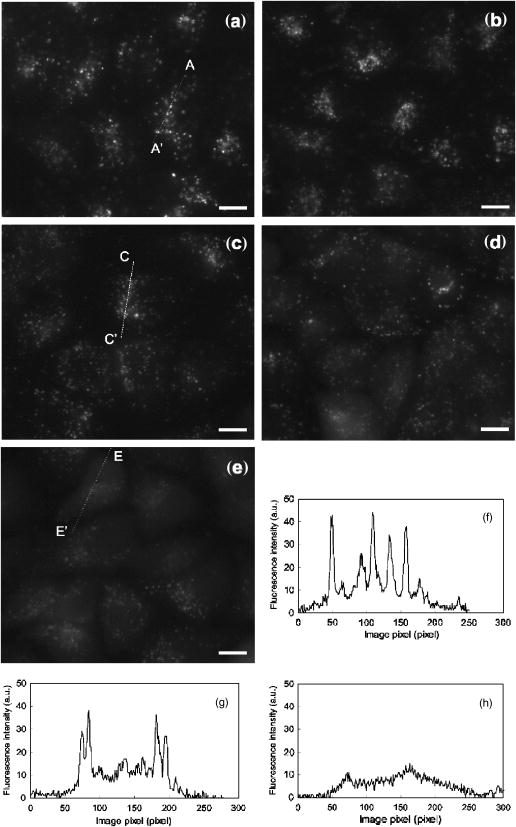 Fig. 5Fluorescence micrographs showing subcellular distribution of in A549 cells before and during photodynamic treatment with light irradiations at : (a) , (b) , and (c) . A spotty pattern remained after and fluorescence intensity in the cytoplasm increased gradually with increasing radiant exposure. The cross-sectional fluorescence intensity profile of C-C’ in image (c) is shown in (d). The white bar at the bottom of each panel from (a) to (c) represents . 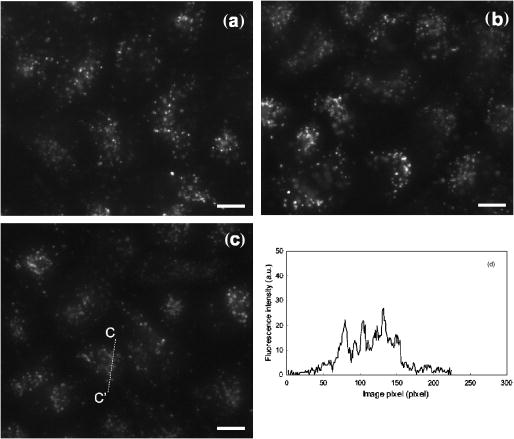 3.3.Analysis of Localization Characteristics ofSince cell-to-cell variation was observed in subcellular distributions of the sensitizer, the degree of sensitizer localization for each cell was quantified by the method described in the previous section. This enabled us to statistically analyze the characteristics of subcellular distribution of the sensitizer under different irradiation conditions. The results of analysis at 5, 10, and are shown in Fig. 6 , in which the number densities of spots for cells are shown as a function of radiant exposure. In Figs. 6a and 6b, gray zones indicate the radiant exposure ranges in which fluorescence degradation appeared with limited oxygen consumption in the diagrams, i.e., 23– at and at [Figs. 1a and 1b]. At [Fig. 6a], in the early period of irradiation (up to ), spot density did not change greatly, while it decreased significantly from 20 to ; at , spot density was reduced to about one-third of that before light irradiation. After an irradiation of , spot density was almost zero, corresponding to the totally diffused fluorescence pattern within the whole cytoplasm [Fig. 4e]. Since the spot density was determined on the basis of the average fluorescence intensity of an individual cell, the spot density indicates the extent of sensitizer localization in the cell despite decrease in the fluorescence intensity due to photobleaching in both lysosomes and cytoplasm. Similarly, at , spot density did not decrease in the initial phase (up to ) but decreased significantly from 10 to [Fig. 6b]. Both at 30 and , there was no significant difference between the spot densities at 0 and [Figs. 6a and 6b]. At , on the other hand, spot density decreased with increase in radiant exposure; a significant difference was seen between the number densities of spots at 0 and [Fig. 6c]. In addition, the spot density at was significantly lower at than at . On the basis of the data shown in Fig. 6, mean rate of sensitizer redistribution was defined as the decreasing rate of the number density of spots per unit radiant exposure (Fig. 7 ). At 30 and , there were remarkable increases in the mean rate of sensitizer redistribution for and for , respectively. Fig. 6Number density of spots for a cell as a function of radiant exposure obtained from analysis of fluorescence micrographs: (a) , (b) , and (c) . The number density of spots indicates the extent of subcellular localization of the sensitizer in lysosomes. Gray zones in (a) and (b) show the ranges of radiant exposure in which fluorescence degradation appeared with limited oxygen consumption in the fluorescence-oxygen diagrams [Figs. 1a and 1b], i.e., at and at . Significant decreases in the number density of spots were seen between 20 and and between 10 and at (a) and (b), respectively; such discontinuity was not clearly seen at (c). An asterisk (*) indicates statistical significance. Each plot represents the average value for more than 48 cells. 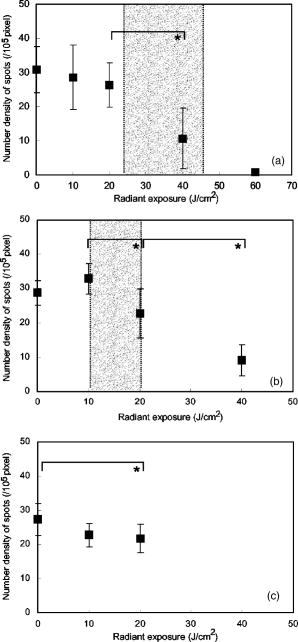 Fig. 7Mean rate of sensitizer redistribution per unit radiant exposure at three repetition rates. The rate was defined as the decreasing rate of the number density of spots in Fig. 6, showing the efficiency of sensitizer redistribution to the cytosol. Remarkable increases in the mean rate of sensitizer redistribution are seen for at and for at . 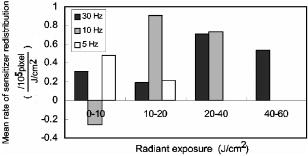 4.DiscussionIn our previous study, we revealed that in photodynamic treatment of A549 cells with using pulsed light excitation, cytotoxicity was increased by decreasing pulse repetition rate in the range of .11 We found no significant difference between either the magnitudes of decrease in oxygen partial pressure measured above the cells or the amounts of fluorescence degradation for the cells (photobleaching) in treatments at repetition rates of 5, 10, and , while the correlation between decrease in oxygen partial pressure and photobleaching during the treatment showed unique characteristics depending on pulse repetition rate (Fig. 1).11 At the higher repetition rates of 30 and , we observed tri-phasic behaviors [Figs. 1a and 1b]; photobleaching initially proceeded with decrease in oxygen partial pressure (phase I), and this was temporally switched to a regime of fluorescence degradation without decrease in oxygen partial pressure (phase II). In this regime, oxygen consumption might be considerably reduced and balanced with oxygen supply through diffusion. This regime was followed by a regime of photobleaching accompanying efficient oxygen consumption (phase III). On the other hand, at the lower repetition rate of , photobleaching proceeded with decrease in oxygen partial pressure during the whole irradiation period [Fig. 1c]. We speculated that the discontinuous and complex behaviors observed in the diagrams at 30 and were associated with the subcellular distribution characteristics of during the treatments. In the present study, in order to verify this speculation, we investigated radiant exposure-dependent subcellular distributions of quantitatively in pulsed photodynamic treatments at three repetition rates (5, 10, and ) and examined how the intracellular kinetics of the sensitizer correlate with the reaction dynamics shown by the fluorescence-oxygen diagrams. During photodynamic treatments at the higher repetition rates (10 and ), subcellular fluorescence distributions were drastically changed from bright and spotty patterns to weak and diffuse patterns in the whole cytoplasm in certain ranges of radiant exposure. These changes in the fluorescence distribution are quantified in Figs. 6a and 6b, showing that at 30 and , the number density of spots for the cell significantly decreased between 20 and and between 10 and , respectively. These ranges of radiant exposure coincided with the ranges indicated by gray zones ( at and at ) in which photobleaching with limited oxygen consumption (phase II) appeared in the diagrams [Figs. 1a and 1b]. At , on the other hand, such a discontinuous decrease in the number density of spots for the cell was not seen [Fig. 6c]; this is consistent with the fact that no switching was observed during the whole irradiation period at this repetition rate [Fig. 1c]. These findings demonstrate that the discontinuous and complex behaviors that appeared in the diagrams at 10 and are directly connected with the significant change in the subcellular distribution of . As we described in our previous paper, a regime of fluorescence degradation with limited oxygen consumption (phase II) may appear due to the involvement of an oxygen-independent reaction such as type-I reaction.11 The initial localization of the sensitizer in lysosomes at a high concentration might temporally induce an oxygen-independent reaction12, 13 due to local hypoxia under high-frequency and high-intensity pulsed light irradiation. However, once the sensitizer is redistributed to the cytosol, the sensitizer can interact with abundant oxygen molecules, by which the oxygen-consuming mechanism (type-II reaction) could predominate again (phase III). Aveline suggested that oxygen-independent reactions predominate over type-II reactions when hypoxia is induced by a high local concentration of the sensitizer in a confined cellular compartment.14 In their experiments on flash photolysis using dueteroporphyrin-sensitized L1210 cell suspensions, the sensitizer was mostly distributed in the plasma membrane; they observed that the initial decay lifetime of the sensitizer triplet state was significantly shorter under deaerated conditions with a high concentration of sensitizer than that under aerated conditions in which the triplet state was quenched by oxygen.14 In the present study, we observed that the subcellular fluorescence distributions were significantly changed from bright and spotty patterns (phase I) to weak and diffuse patterns in the whole cytoplasm (phase III) at the higher repetition rates of 10 and . To examine the possibility of the occurrence of local hypoxia, direct measurement of local oxygen concentration in the lysosomes would be helpful, but it is difficult to perform. In our previous work, we observed that the oxygen partial pressure measured above the cells rapidly decreased immediately after starting irradiation.11 This fact suggests that the oxygen concentration within the whole cells becomes low; the regions adjacent to the lysosomes as well as in the lysosomes might become hypoxic in a certain period of irradiation. Under such conditions, oxygen perfusion to the lysosomes cannot be explained on the basis of the one-dimensional oxygen diffusion gradient over the scale of lysosomes, i.e., around a few microns. Thus, oxygen diffusion over the whole range of the cell should be considered to explain the frequency-dependent intracellular local oxygen concentration. Since it is known that chlorine-type sensitizers tend to be aggregated due to electrostatic interactions, i.e., interactions,15, 16 molecules of , which is a chlorine-type sensitizer, probably existed in a highly aggregated form in lysosomes in the initial phase of irradiation (phase I). However, redistribution of the sensitizer can entail dilution and disaggregation of the sensitizer within the cytosol; this might restart an efficient photochemical reaction (phase III). Such an effect of the aggregation of sensitizers on photochemical oxygen consumption has been suggested by Georgakoudi for lysosomal sensitizers, nile blue derivatives.17 They demonstrated two well-defined phases of photochemical oxygen consumption with multicell EMT6 spheroids under cw light irradiation; the fluence at which the second oxygen consumption started coincided with the fluence at which the sensitizer redistribution was observed.17 In our results, it should also be noted that in phase III, plateaus appeared in the diagrams, which may also be associated with disaggregation; in this region, increase in the quantum yield of the fluorescence due to disaggregation may be balanced with photobleaching.15 In this phase, photobleaching rate may be decreased since singlet oxygen should have various types of biological substances as targets other than sensitizer. Another possible explanation for the appearance of phase II is the effect of change in the microenvironment such as pH caused by lysosomal photodamage. It is known that the pH in lysosomes is approximately 5 (acidic), while that in the cytosol is approximately 7 (neutral).18 Accordingly, the sensitizer that accumulated in lysosomes might be exposed to a rapid increase in pH through lysosomal photodamage. This might cause fluorescence degradation if the sensitizer had a negative dependence of fluorescence intensity on pH. In this phase, most of or some of the sensitizer might still be aggregated, to which inefficient photodynamic oxygen consumption is attributable. Unfortunately, however, the pH dependence of fluorescence intensity has not been revealed for and it is therefore difficult to further discuss this speculation at present. To understand the complex behavior of the reaction dynamics shown in the diagrams, the effect of microenvironment on the photochemical properties of in cells must be investigated. For lysosomal sensitizers, it has been demonstrated that the release of sensitizer into the cytosol is a critical event to determine efficiency of photodynamic treatment; one possible reason for this is that photochemical damage of secondary intracellular targets other than lysosomes, e.g., mitochondria, is more lethal to the cells. 19, 20, 21, 22 Consistent with these facts, at 30 and , cytotoxicity was significantly increased after redistribution of the sensitizer. As shown in our previous study, cytotoxicity was significantly increased from 20 to and from 10 to at and , respectively. These ranges coincide with the radiant exposure ranges in which the number density of spots remarkably decreased at these repetition rates. Even more important is the fact that the number density of spots started to decrease in the lower radiant exposure range at than at . This indicates that redistribution of the sensitizer from lysosomes to cytosol occurred more efficiently at the lower repetition rate. At the lowest repetition rate of , the number density of spots significantly decreased with increase in radiant exposure for [Fig. 6c], while in this range of radiant exposure, there was no significant difference in the number density of spots either at or [Figs. 6a and 6b]. These findings suggest that redistribution of the sensitizer occurred more efficiently at than at 10 and in this radiant exposure range . Such an efficient redistribution of the sensitizer might be connected with the highest phototoxicity at among the three repetition rates.11 The results of this study show the possibility of controlling intracellular dynamics of a sensitizer by changing pulse repetition rate. An interesting application of this is photochemical internalization (PCI) for light-induced delivery of therapeutic molecules such as genes to cells.23 PCI is based on the light activation of a photosensitizer that is specifically located in the membranes of endocytic vesicles and/or lysosomes; these membranes can be photodynamically ruptured by light illumination, releasing the therapeutic molecules into the cytosol. Currently, cw light is used for PCI, but there is a disadvantage associated with photochemical damage of therapeutic molecules, resulting in limited internalization efficiency.22 By the use of pulsed light irradiation for PCI, photochemical damage of the molecules can be suppressed, because singlet oxygen is generated intermittently. Furthermore, by using a lower pulse repetition rate, endocytic membranes and/or lysosomes may be more efficiently ruptured, and the molecules can therefore be released more efficiently, leading to higher internalization efficiency. 5.ConclusionsIn the nanosecond pulsed photodynamic treatment of A549 cells with , we analyzed subcellular distributions of the sensitizer as a function of radiant exposure at repetition rates of 5, 10, and . It was revealed that the intracellular kinetics of the sensitizer was closely related to the photochemical reaction dynamics shown by the fluorescence-oxygen diagram in our previous paper. At high repetition rates of 30 and , the sensitizer remained in lysosomes in the initial phase of irradiation and started to be redistributed to the cytosol in certain ranges of radiant exposure; the ranges were found to coincide with a regime of fluorescence degradation with limited oxygen consumption. On the other hand, at a low repetition rate of , such a discontinuous behavior was not observed in the sensitizer redistribution characteristics; this was thought to be related to the fact that no reaction switching was observed in the diagram at this repetition rate. We offered two possible explanations for the appearance of the regime of fluorescence degradation with limited oxygen consumption; one is participation of an oxygen-independent reaction and the other is change in the microenvironment of the sensitizer caused by lysosomal photodamage. These findings explain our previous results showing higher cytotoxicity at than at 10 and . It can be concluded that in pulsed PDT, pulse repetition rate is a crucial parameter affecting the intracellular kinetics of the sensitizer and hence the photosensitization mechanism of PDT. AcknowledgmentsThe authors thank Isao Sakata, PhD, Photochemical Company, Okayama, Japan, for providing . ReferencesT. J. Dougherty,
J. E. Kaufman,
A. Goldfarb,
K. R. Weishaupt, D. Boyle, and
A. Mittleman,
“Photoradiation therapy for the treatment of malignant tumors,”
Cancer Res., 38
(8), 2628
–2635
(1978). 0008-5472 Google Scholar
J. A. Carruth,
“Clinical applications of photodynamic therapy,”
Int. J. Clin. Pract., 52
(1), 39
–42
(1998). 1368-5031 Google Scholar
T. J. Dougherty,
C. J. Gomer,
B. W. Henderson,
G. Jori,
D. Kessel,
M. Korbelik,
J. Moan, and
Q. Peng,
“Photodynamic therapy,”
J. Natl. Cancer Inst., 90
(12), 889
–905
(1998). https://doi.org/10.1093/jnci/90.12.889 0027-8874 Google Scholar
F. Ricchelli,
K. Olsen, and
L. Lindqvist,
“Influence of the gel-liquid phase transition on hematoporphyrin triplet deactivation in liposomes,”
J. Photochem. Photobiol., B, 2
(4), 475
–481
(1988). 1011-1344 Google Scholar
A. Andreoni,
“Two-step photoactivation of hematoporphyrin by excimer-pumped dye-laser pulses,”
J. Photochem. Photobiol., B, 1
(2), 181
–193
(1987). 1011-1344 Google Scholar
C. R. Lambert,
H. Stiel,
D. Leupold,
M. C. Lynch, I. E. Kochevar,
“Intensity-dependent enzyme photosensitization using nanosecond laser pulses,”
Photochem. Photobiol., 63
(2), 154
–160
(1996). 0031-8655 Google Scholar
B. W. Pogue,
L. Lilge,
M. S. Patterson,
B. C. Wilson, and
T. Hasan,
“Absorbed Photodynamic dose from pulsed versus continuous wave light examined with tissue-simulating dosimeters,”
Appl. Opt., 36
(28), 7257
–7269
(1997). 0003-6935 Google Scholar
B. W. Pogue,
T. Momma,
H. C. Wu, and
T. Hasan,
“Transient absorption changes in vivo during photodynamic therapy with pulsed-laser light,”
Br. J. Cancer, 80
(3–4), 344
–351
(1999). 0007-0920 Google Scholar
T. Okunaka,
H. Kato,
C. Konaka,
H. Sakai,
H. Kawabe, and
K. Aizawa,
“A comparison between argon-dye and excimer-dye laser for photodynamic effect in transplanted mouse tumor,”
Jpn. J. Cancer Res., 83
(2), 226
–231
(1992). 0910-5050 Google Scholar
B. C. Wilson and
M. S. Patterson,
“Theoretical study of the influence of sensitizer photobleaching on depth of necrosis in photodynamic therapy,”
Proc. SPIE, 2133 260
–271
(1994). 0277-786X Google Scholar
S. Kawauchi,
S. Sato,
Y. Morimoto, and
M. Kikuchi,
“Correlation between oxygen consumption and photobleaching during in vitro photodynamic treatment with using pulsed light excitation: dependence of pulse repetition rate and irradiation time,”
Photochem. Photobiol., 80
(2), 216
–223
(2004). 0031-8655 Google Scholar
M. Ochsner,
“Photophysical and photobiological processes in the photodynamic therapy of tumours,”
J. Photochem. Photobiol., B, 39
(1), 1
–18
(1997). https://doi.org/10.1016/S1011-1344(96)07428-3 1011-1344 Google Scholar
C. S. Foote,
“Type I and Type II mechanisms of photodynamic action,”
Light-Activated Pesticides, 22
–38
(1987) Google Scholar
B. M. Aveline,
R. M. Sattler, and
R. W. Redmond,
“Environmental effects on cellular photosensitization: correlation of phototoxicity mechanism with transient absorption spectroscopy measurements,”
Photochem. Photobiol., 68
(1), 51
–62
(1998). 0031-8655 Google Scholar
R. Bonnet,
“Photobleaching,”
Chemical Aspects of Photodynamic Therapy, 237
–256
(2000) Google Scholar
R. Bonnet,
“Chlorins and Bacteriochlorins,”
Chemical Aspects of Photodynamic Therapy, 177
–198
(2000) Google Scholar
I. Georgakoudi and
T. H. Foster,
“Effects of the subcellular redistribution of two nile blue derivatives on photodynamic oxygen consumption,”
Photochem. Photobiol., 68
(1), 115
–122
(1998). 0031-8655 Google Scholar
A. L. Lehninger,
D. L. Nelson, and
M. M. Cox,
“Cells,”
Principles of Biochemistry, 34
(1993) Google Scholar
C. W. Lin,
J. R. Shulok,
Y. K. Wong,
C. F. Schanbacher,
L. Cincotta, and
J. W. Foley,
“Photosensitization, uptake, and retention of phenoxazine Nile blue derivatives in human bladder carcinoma cells,”
Cancer Res., 51
(4), 1109
–1116
(1991). 0008-5472 Google Scholar
D. Kessel,
K. Woodburn,
C. J. Gomer,
N. Jagerovic, and
K. M. Smith,
“Photosensitization with derivatives of chlorin p6,”
J. Photochem. Photobiol., B, 28
(1), 13
–18
(1995). 1011-1344 Google Scholar
K. Berg and
J. Moan,
“Lysosomes and microtubules as targets for photochemotherapy of cancer,”
Photochem. Photobiol., 65
(3), 403
–409
(1997). 0031-8655 Google Scholar
J. Morgan and
A. R. Oseroff,
“Mitochondria-based photodynamic anti-cancer therapy,”
Adv. Drug Delivery Rev., 49
(1–2), 71
–86
(2001). 0169-409X Google Scholar
A. Hogset,
L. Prasmickaite,
P. K. Selbo,
M. Hellum,
B. O. Engesaeter,
A. Bonsted, and
K. Berg,
“Photochemical internalisation in drug and gene delivery,”
Adv. Drug Delivery Rev., 56
(1), 95
–115
(2004). 0169-409X Google Scholar
|


