
|
|
1.IntroductionRemineralization of dental enamel is a physiological repair process that can reverse the damaging effects of mineral loss from early caries (dental decay). Topical fluoride applied to the tooth surface can enhance the effects of remineralization. The fluoride-mediated remineralization produces fluorapatite or fluoridated hydroxyapatite crystals, from salivary calcium and phosphate ions, that are more acid resistant than the carbonated hydroxyapatite naturally found in enamel. Fluoride treatment, accompanied with antibacterial therapies, also can target the pathogenic bacteria that cause dental caries, which further enhances the tissue repair.1, 2 Since remineralization is a nondestructive process, opposed to invasive restorative procedures, it is the first therapeutic treatment option for early caries. However, it is imperative that caries lesions are longitudinally monitored during a period of remineralization treatment, since decay can rapidly progress instead of remineralize. Because conventional methods, including clinical digital x-ray systems, are not capable of safely and accurately monitoring early dental caries, reliable detection methods are needed to image and evaluate the remineralization of caries while it is still in the enamel. Optical coherence tomography (OCT), which uses low coherence interferometry, has found broad applications in the cross sectional imaging of biological structures,3, 4, 5, 6 including dental hard and soft tissue.7, 8 Polarization-sensitive OCT (PS-OCT) systems, which utilize polarized incident light and measure the polarization information from the backscattered signal in two separate channels, have been used for imaging birefringent tissues.9, 10, 11 Due to the rod-like organization of hydroxyapatite crystals, dental enamel is usually birefringent, and initial measurements of tooth enamel with PS-OCT emphasized characterization of the tissue birefringence.12, 13 PS-OCT images by Baumgartner 14 resolved enamel demineralization through an increase in backscattered intensity and changes in the enamel birefringence. Later studies have demonstrated that there is a 2 to 3 order of magnitude increase in the scattering coefficient at of dental enamel on demineralization.15 If the incident illuminating light is linearly polarized, the light scattered from the demineralized lesion area will rapidly depolarize.16 Previous studies have shown that PS-OCT can be used to quantify the severity of early caries and has several advantages over conventional OCT.17, 18 Conventional OCT is especially susceptible to the strong Fresnel surface reflection from the high refractive index enamel; however, PS-OCT uses linearly polarized light, which does not depolarize from surface reflection near normal incidence. Since carious enamel depolarizes incident polarized light, PS-OCT images both the surface and subsurface enamel by recording changes in the magnitude of scattering and depolarization without interference from the strong surface reflection. Several studies have demonstrated that remineralization has a significant effect on the mineral volume on the outer perimeter of the lesion, near the enamel surface.19, 20, 21, 22 This suggests that PS-OCT could be valuable in imaging the remineralization of caries lesions. In this work, we use an all-fiber-based PS-OCT system operating at , where dental enamel has been shown to be nearly transparent,23, 24 to image demineralized and fluoride-enhanced remineralized artificial lesions on smooth enamel surfaces. We postulated that PS-OCT was capable of measuring changes in the optical reflectivity on enamel remineralization. PS-OCT images of artificial lesions before and after remineralization were compared with the relative mineral loss , obtained from high resolution digital microradiography (DM), and chemical composition changes measured with infrared spectroscopy. 2.Materials and Methods2.1.Artificial Smooth Surface Caries40 sound human posterior teeth were mounted on acrylic blocks after root resection. Teeth were sterilized using gamma irradiation and stored in a moist environment to preserve tissue hydration with 0.1% thymol added to prevent bacterial growth. The outer enamel surface was polished to remove any previous remineralized enamel and expose normal sound enamel. An acid resistant varnish was applied on the teeth on all areas outside the smooth surface test region, which was scanned using the PS-OCT system. Artificial, or in vitro, lesions on the teeth were formed using a well-characterized pH cycling model, replicating the cycle of demineralization and remineralization that takes place naturally in the oral environment.25, 26 Teeth were exposed to either a 3 or daily regimen of demineralization and remineralization.27 Teeth exposed to the pH cycling for were intended to represent severe early caries, and the teeth exposed for represent a less advanced lesion in both depth and overall mineral loss. During demineralization, each tooth was exposed for a day to a aliquot buffer solution containing calcium, phosphate, and acetate maintained at pH 4.3 and a temperature of . After demineralization, each tooth was immersed for in a mineralizing solution of calcium, phosphate, KCl, and cacodylate buffer maintained at pH 7.0 and . Sample teeth from both the and regimens were subsequently exposed to a fluoride containing remineralization solution. This solution was identical in composition to the mineralizing solution used in the pH cycling during the formation of the artificial lesions, except that in the form of NaF was added to the solution to enhance the remineralization effect. Teeth were then continuously exposed for to the fluoride remineralization solution. For histological evaluation, -thick transverse sections from the demineralized and remineralized samples were obtained with a microtome and a digital micrometer, after embedding the samples in a resin polymer to preserve the lesion surface layer. Other tooth sections were also embedded in a resin polymer, polished to a finish, so that the entire transverse lesion and underlying enamel was exposed for high resolution IR spectromicroscopic analysis. 2.2.Polarization-Sensitive Optical Coherence TomographyThe fundamentals of PS-OCT are detailed in numerous publications,28, 29 and the system used in this study has been described previously.18 PS-OCT measures the intensity and polarization state of backscattered light as a function of depth at a specific lateral position. In this study, the PS-OCT system integrated an optical coherence domain reflectometer (OCDR), which measured the backscattered signal defined as an -scan, with a computer-controlled high speed -scanning stage (Newport Corporation, Irving, California) to produce a 2-D optical tomographic image or -scan. The all-fiber-based OCDR system (Optiphase Incorporated, Van Nuys, California) shown in Fig. 1 is based on a polarization-sensitive Michelson interferometer. Linearly polarized light at emitted from a diode source was coupled into the slow or parallel axis of a polarization-maintaining (PM) fiber, and the focused beam illuminated the tooth sample. The reflected/backscattered light from the sample was collected in two orthogonal polarization states of the PM fiber: the slow or parallel axis to the original incident plane and the fast or perpendicular axis. The OCDR used two high speed piezoelectric fiber stretchers, in a push-pull configuration, to alter the path length of the reference beam relative to the sample beam, and a fiber coupler combined the two beams. A polarized beamsplitter (PBS) then split the two orthogonal components of the combined beam into the parallel and perpendicular axis signals. The two orthogonal signals were then measured by two balanced InGaAs receiver modules. The signals were then electronically demodulated and stored on a Labview™ controlled computer (National Instruments, Austin, Texas). Fig. 1PS-OCT system: 1310-nm light from the SLD is linearly polarized and coupled into the slow axis of a polarization-maintaining fiber and equally split between the sample and reference arms of a polarization-sensitive optical coherence domain reflectometer (OCDR). The path length difference between the sample and reference arms is varied using piezoelectric fiber stretchers. The quarter-wave plate (QWP) in the reference arm splits the linearly polarized light equally between both polarization states. A polarizing beamsplitter (PBS) in the detection arm splits the fast (perpendicular) and slow (parallel) axis components of the light onto the two detectors. The OCDR is integrated with a computer-controlled scanning stage to produce tomographic PS-OCT images.  The PS-OCT system used a broadband superluminescent diode (SLD), (Covega, Jessup, Maryland). The incident beam was focused onto the sample surface using a focal length antireflective (AR)-coated plano-convex lens. This optical configuration produced a lateral resolution that was measured by translating a knife edge across the beam waist and then calculating the diameter.30 The SLD source possessed a spectral bandwidth [full width at half maximum (FWHM)] of that produced within the system an axial resolution of in air. The system axial resolution is increased to as much as when imaging the higher refractive index enamel tissue . Using a single reflective signal from a mirror, the signal-to-noise ratio (SNR) of the PS-OCT system was measured to be . 2-D OCT -scans were obtained by collecting a series of depth-resolved signals by laterally scanning the beam across of the wet tooth. The axial depth of each image was controlled by the maximum path length difference between the sample and reference beams at an -scan rate of . Each full -scan was done in less than one minute. The acrylic blocks attached to each tooth was fitted into a custom metal jig that allowed orientation and coordinates to be precisely replicated, within , for every scan.31 The fixed coordinate position and a reference focus point of sound enamel were necessary to ensure that both the demineralization and remineralization samples were placed into a fixed position. The PS-OCT -scan images were acquired at day 0 for the 40 teeth in the study. After either 3 or of pH cycling to create the artificial lesions, PS-OCT images were again collected. Demineralized caries lesion in each group were saved for histological evaluation, and the remaining teeth were again scanned with PS-OCT following of remineralization. A total of eight serial -scan images were acquired for each tooth at intervals, which encompassed a area of the exposed tooth surface. A series of line profile integrations over the depth of each lesion that encompassed the entire demineralized area were averaged and used to assess the overall lesion severity. This integration of the line profiles, a summation of the logarithmic reflectivity (dB), is presented in arbitrary units (a.u.). Using a single line profile of the lesion, the real lesion depth was determined by dividing the measured optical depth by the index of refraction of the enamel . 2.3.Histological Analysis (Digital Microradiography)Digital microradiography (DM) of -thick transverse tooth sections was used to measure the mineral loss or gain from each of the four groups : the 3 and demineralized caries lesions, and the 3 and fluoride remineralized lesions. High resolution microradiographs were taken using Cu radiation from a Philips 3100 x-ray generator. A Photonics Science FDI x-ray digital imager (Microphotonics, Allentown, Pennsylvania), consisting of a interline charge-coupled device (CCD) directly bonded to a coherent microfiber optic coupler that transfers the light from an optimized gadolinium oxysulphide scintillator to the CCD sensor, was used to acquire the microradiographic images. Images were acquired in real time at a frame rate of . The image size was with a pixel resolution of . The imaging system consisted of a high speed motion control system with Newport UTM150 and 850G stages and an ESP300 controller coupled to a video microscopy and laser targeting system for precise positioning of the tooth sections in the field of view of the imaging system. The volume percent (%) mineral content of each section was determined by comparison with a calibration curve of x-ray intensity versus sample thickness created using sound enamel sections of volume percent mineral varying from in thickness. The calibration curve was validated via comparison with cross sectional microhardness measurements. The volume percent mineral determined using microradiography for section thickness ranging from highly correlated with the volume percent mineral determined using microhardness . From the DM technique, we obtained the quantitative mineral loss profiles32 taken normal to the outer enamel surface. The relative mineral loss was calculated as the difference between the sound and lesion profiles on the same sample. Lesion depth was measured from the outer surface, where the mineral volume equaled 20%, to a position where the volume reached a level equal to 95% of the sound enamel.33 2.4.Synchrotron Radiation Fourier Transform Infrared SpectroscopyHigh resolution IR spectra of laser-irradiated surfaces were obtained using a Nicolet Magna 760 Nic-Plan IR microscope (Nicolet, Madison, Wisconsin) interfaced to Beamline 1.4 at the Advanced Light Source at Lawrence Berkeley National Laboratory.34 The high brightness provided by the synchrotron radiation source allows IR spectra to be acquired with a spatial resolution of . The specular reflectance spectra were acquired by scanning the spot imaged by the Fourier transform infrared (FTIR) microscope across the cross sectional surfaces of selected remineralized lesions from each group. 3.Results3.1.Remineralization of Severe Early Artificial CariesPS-OCT -scan images, in both the parallel and perpendicular axes, of the pH cycled demineralized caries lesions are presented in Fig. 2 . The reflectivity in the parallel axis shows the intense scattering of the demineralized lesion compared to the bordering sound enamel. In the perpendicular axis, the caries lesion rapidly depolarizes the incident polarized light, and the signal is markedly greater than that of the signal in the sound enamel caused by the native birefringence. After exposure to the fluoride remineralization solution for , the lesion demonstrated an increase in both scattering and depolarization. Integration of the perpendicular-axis line profiles of the lesion for both the demineralized samples and the samples exposed to the remineralization solution are presented in Table 1 . The paired data, from identical samples, showed that the caries lesions exposed to of remineralization had a higher integrated reflectivity compared to the demineralized lesions (repeated-measures analysis of variance, ). The integrated reflectivity of the sound enamel in both groups was equal. The estimated real lesion depths, using the index of refraction of sound enamel, showed no difference in depth between the two groups. Fig. 2PS-OCT -scan images of a pH cycled artificial caries lesion before and after a regimen of fluoride remineralization. Images are displayed in a false-color scale (bottom). (a) The blue scale bar is of optical depth, and the dentin-enamel junction (DEJ) is labeled. Parallel-axis images of (a) the demineralized caries lesion and (c) the remineralized lesion show an increase in backscattering of the lesion area after remineralization. (b) Perpendicular-axis images of the demineralized and (d) remineralized lesion show both the increase of backscattering and depolarization after remineralization. The reflectivity increase in the perpendicular axis is quite evident near the surface of the lesion.  Table 1Lesion assessment with PS-OCT of the 10day lesions.
The high resolution digital micrographs of the lesions, obtained after cross sectioning, indicated that these teeth were severely demineralized with a large reduction in the volume percent mineral versus the sound samples [Figs. 3a and 3b ]. The quantitative mineral content profiles from the lesion and sound enamel were acquired [ Figs. 3c and 3d]. From these profiles, it is apparent that the artificial process of creating the lesions produced an intact -thick “surface zone” of higher mineral volume near the enamel surface. After the fluoride remineralization, samples showed higher volume percent mineral within the entire lesion [Figs. 3b and 3d]. The quantitative mineral content profile illustrated the increase in the mineral volume, with the most dramatic increase near the surface of the lesion. Within a -deep surface zone region, the volume percent mineral of the remineralized lesion was restored to close to that of sound enamel. The relative mineral loss was calculated from the mineral volume profiles to quantify lesion severity for each sample. The and lesion depths from the lesions and the fluoride remineralized lesions are summarized in Table 2 . The remineralized samples showed a statistically significant (student’s test, , ) reduction in the value compared with the lesions. This indicated that the samples remineralized with new mineral and the lesion surface zone showed significant restoration of mineral volume. The lesion depth slightly decreased with remineralization (student’s test, , ) but only to a marginal degree. Fig. 3High resolution digital micrographs of (a) the pH cycled lesions and (b) the lesions after fluoride remineralization treatment were obtained after tooth sectioning. The quantitative mineral content profiles from (c) the demineralized lesion and (d) remineralized lesion were acquired, in addition to the sound enamel profiles. The relative mineral loss was calculated as the difference between the sound and lesion profiles on the same sample. 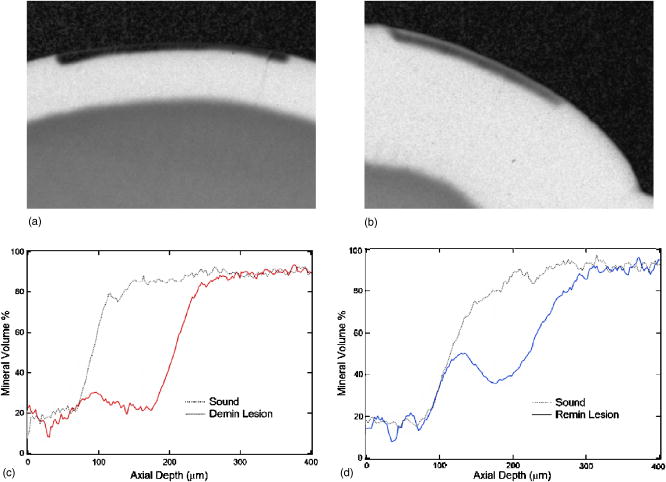 3.2.Remineralization of Mild Early Artificial CariesPS-OCT -scan images of the demineralized caries lesions are presented [Figs. 4a and 4b ]. The images in both axes show that the lesions are much shallower in depth than the lesions created after of pH cycling. Before these lesion samples were placed in the fluoride remineralization solution, the bordering sound enamel, which is normally protected by a varnish, was deliberately exposed to the solution as well [Fig. 4d, arrows]. After , it is evident [Figs. 4c and 4d] that a highly scattering and depolarizing outer layer of mineral approximately thick is formed on the surface of the lesion and extended to the area of the exposed sound enamel. The boundary between this outer layer and the underlying lesion is clearly resolved in the perpendicular axis, due to the minimal effects of surface reflection in this axis. Fig. 4PS-OCT -scan images of the pH cycled artificial caries lesion are presented in (a) the parallel and (b) perpendicular axes. The lesions exposed to of fluoride remineralization are shown in (c) the parallel and (d) perpendicular axes. Before these lesions were remineralized, the bordering sound enamel, which is normally protected by a varnish, was also deliberately exposed to the solution [d, arrows]. After remineralization, a highly scattering [(c) and (d)] and depolarizing (d) outer growth layer is formed on the surface of the lesion and extended to the area of the exposed sound enamel.  After carefully sectioning the samples, the DM images of the remineralized samples (Fig. 5 top) showed a highly mineralized outer -thick layer with a mineral volume content equal to that of the sound enamel. The presence of this outer layer confounds an accurate lesion severity analysis, since is a product of both mineral volume and depth. The remineralized lesions have a larger depth than the demineralized lesions, because of the addition of the outer surface layer. Synchrotron radiation IR spectroscopy was employed to identify the chemical composition of this outer layer. Spectra were acquired from the different regions of the remineralized lesion (Fig. 5 bottom). The first spectra [Fig. 6a ] represents the normal sound enamel with the three characteristic peaks due to the phosphate group in carbonated hydroxyapatite near , and the two smaller peaks near due to the carbonate group. The carbonate group is absent in the second spectra [Fig. 6b] of the lesion body. The apatite phosphate bands are also altered from both the initial preferential dissolution of carbonated enamel crystals and the subsequent remineralization from the pH cycling mineralizing solution. The spectra of the remineralized outer layer [Fig. 6c] displays the characteristic apatite bands, with an absence of the carbonate group, and the narrowness of the phosphate band indicates this layer has high crystallinity. Fig. 5(Top) A high resolution digital micrograph image, after transverse sectioning, of the pH cycled artificial lesion after the of fluoride-enhanced remineralization illustrates the high mineral volume of the outer growth layer (arrows). (Bottom) A image of the various regions of the remineralized lesion: (a) sound enamel, (b) lesion body, (c) outer remineralization layer, and (d) the embedding resin for sample analysis. The bordering sound enamel (arrow) near the lesion illustrates that the remineralization layer is formed above the surface.  Fig. 6Spectra by FTIR microscopy were acquired from the different regions of the remineralized lesion. (a) Sound enamel spectra with the characteristic peaks due to the phosphate group in carbonated hydroxyapatite near and the two smaller peaks near due to the carbonate group. (b) Spectra of the lesion body shows that the carbonate group is absent, which is likely due to the preferential loss of carbonate during demineralization. (c) The outer remineralization layer displays narrow characteristic hydroxyapatite bands, indicating high crystallinity, with an absence of the higher solubility carbonate substitution group.  Table 2Lesion assessment with digital microradiography of the 10day lesions.
4.DiscussionThis present study determined that PS-OCT can nondestructively image the effects of fluoride-enhanced remineralization of mild and severe early artificial caries. For the severe caries, using the pH cycled lesion model, an increase in the integrated reflectivity in the perpendicular-axis image was measured after exposure to a fluoride remineralization solution. Digital microradiography of the sectioned samples proved that the entire lesion body accumulated mineral volume from the remineralization, with a significant increase of mineral near the surface of the lesion. This observation is consistent with previous studies investigating caries remineralization models.19, 20, 21, 22 Those studies have shown that, as a caries lesion undergoes remineralization, the deeper porosities accumulate mineral, but to a more limited extent than the lesion surface zone. In fact, it is suggested that successful remineralization of the surface zone limits the continued diffusion of ions into the deeper regions of the lesion. This observation is in accord with in vivo remineralization studies of early caries,35 where the restoration of the surface zone with an acid resistant fluoride-containing apatite has a large effect on preventing decay in the subsurface lesion body. This is due in part to the fact that the pathogenic bacteria in early caries are populated above the enamel surface, dissolving subsurface enamel mineral through acid diffusion byproducts. Although the remineralized surface zone is only microns thick, it prevents any further increase in mineral loss and lesion depth, and the lesion is termed “arrested.” Studies of artificial and natural caries have shown that the lesion depth is not radically decreased by remineralization, which may be caused by surface zone restoration.19 In this study, PS-OCT did not show any measurable change in depth, whereas the DM showed a minor change of , which is near the PS-OCT system resolution. Previous work by our group has shown a strong correlation between lesion depth and lesion severity in DM and PS-OCT.36, 37 In this study, it should be noted that the PS-OCT lesion depth comparison was a paired dataset, and the final samples were then used for the lesion depth calculation of the remineralization DM images. Therefore, the lesion depth agreement was within , despite the experimental difficulties in comparing the tomographic slice thickness of PS-OCT with the DM sectional slices. Another possible source of error was using the refractive index of sound enamel in the calculations to convert optical depth to real depth. It is likely that the refractive index of the lesions are different than sound enamel; if the refractive index decreased to a value similar to that of the less mineralized dentin tissue , the real lesion depth would be thicker than the calculated depth using the sound enamel refractive index. Lesion severity is determined by both the integration of the perpendicular-axis image and calculation of the lesion depth. In the case of remineralization of early caries, analyzing both these properties is important. This is because the integrated reflectivity has been shown to increase as a caries lesion progresses during pH cycling.17 This increase is accompanied with an increase in the depth of the lesion. Other artificial lesion studies have shown that as a lesion progresses, the mineral content at a specific depth does not significantly change after a certain volume; instead, the diffusion of ions pass through the area without affecting the mineral volume.38 In remineralization, mineral volume is increased by the growth of remaining crystals, the restoration of partially demineralized crystals, and the deposition of newly formed crystals.39 The influx of deposited crystals and restored crystals within a caries lesion can be a variety of sizes and irregular shapes, thus not perfectly emulating the organized rod-like structure of sound enamel.40 The random orientation of crystallite mineral deposition during remineralization22 is expected to increase the number of crystal grain boundaries within the lesion, resulting in greater lesion scattering and depolarization. An increase in the integrated reflectivity without an increase in lesion depth may be indicative of in vivo caries remineralization, although future work is necessary. A recent study of the remineralization of enamel erosion, which is the straight surface dissolution caused by exposure of gastric acids, found a reduction in the enamel reflectivity after a single exposure to a remineralization solution.41 Although this study lacked histological evidence to support the increase in surface mineral volume, the findings may suggest that repairing surface roughness caused by straight demineralization, may initially decrease reflectivity. In our recent study of the remineralization of in vitro caries lesions with porous surface zones, we measured the repair of a 35-μm-thick surface zone within the lesion of low reflectivity using PS-OCT after exposure of the lesions to a remineralization solution.43 This suggests that the remaining enamel crystal structure and lesion porosity of a caries lesion prior to remineralization strongly dictate the reflectivity and depolarization properties of the remineralized lesion. The PS-OCT images of the remineralization of the lesions showed an outer growth layer on the surface of the lesion and the bordering sound enamel. From the DM images and FTIR analysis, this outer layer was found to have a mineral volume equal to that of sound enamel with a crystalline apatite structure. Previous studies have shown that the mineral volume increase, a change in the , within a lesion during remineralization is correlated to the severity of a caries lesion.19 This indicates that the less severe caries lesions had a surface zone that rapidly remineralized. This remineralization prevented further mineral deposition into the lesion and caused the growth of an outer layer of highly crystalline phase resembling apatite. This outer layer, without the highly soluble carbonate group, is likely to be more resistant to acid dissolution. It is not clear from this study how integrated this outer layer is with the underlying sound enamel surface, and whether this layer can withstand the mechanical forces that exist in vivo. Since the perpendicular PS-OCT axis image is minimally affected by surface reflection, the boundary and thickness of this outer caries resistance layer is resolved in the perpendicular-axis image. This is the first evidence, to the best of our knowledge, to show the highly crystalline growth of the outer layer. Because this thin outer layer was detected by PS-OCT prior to sectioning, a resin embedding technique to preserve the integrity of the outer layer was used before DM analysis. We found that the outer layer was severely damaged if a high speed diamond grit cutting blade was used on the surface without embedding, which may explain the reason that this layer was not found during DM analysis in other studies. In conclusion, this study demonstrates that PS-OCT can be used to quantify the remineralization of severe early artificial caries by measuring an increase in the perpendicular-axis integrated reflectivity with no accompanying change in lesion depth. For less severe lesions, PS-OCT images the highly scattering and depolarizing outer layer after fluoride-enhanced remineralization. The results of this work call for future studies investigating the ability of PS-OCT to image and analyze different synthetic42 and in vivo enamel repair and remineralization treatments. AcknowledgmentsThis work was supported by NIH/NIDCR grant 1-R01 DE14698, T32 DE07306-09, and the DOE grant DE-AC03-76SF00098. The authors gratefully acknowledge Michael Martin of LBL for his assistance at the ALS, and Charles Le and Patara Ngaotheppitak for their contributions at University of California, San Francisco. ReferencesJ. S. van der Hoeven,
D. Cummins,
M. J. Schaeken, and
F. J. van der Ouderaa,
“The effect of chlorhexidine and zinc/triclosan mouthrinses on the production of acids in dental plaque,”
Caries Res., 27 298
–302
(1993). 0008-6568 Google Scholar
I. R. Hamilton,
“Biochemical effects of fluoride on oral bacteria,”
J. Dent. Res., 69
(1990). 0022-0345 Google Scholar
D. Huang,
E. A. Swanson,
C. P. Lin,
J. S. Schuman,
W. G. Stinson,
W. Chang,
M. R. Hee,
T. Flotte,
K. Gregory,
C. A. Puliafito, and
J. G. Fujimoto,
“Optical coherence tomography,”
Science, 254 1178
–1181
(1991). 0036-8075 Google Scholar
A. F. Fercher,
C. K. Hitzenberger,
W. Drexler,
G. Kamp, and
H. Sattmann,
“In vivo optical coherence tomography,”
Am. J. Ophthalmol., 116 113
–114
(1993). 0002-9394 Google Scholar
G. J. Tearney,
M. E. Brezinski,
B. E. Bouma,
S. A. Boppart,
C. Pitris,
J. F. Southern, and
J. G. Fujimoto,
“In vivo endoscopic optical biopsy with optical coherence tomography,”
Science, 276 2037
–2039
(1997). https://doi.org/10.1126/science.276.5321.2037 0036-8075 Google Scholar
J. G. Fujimoto,
S. A. Boppart,
G. J. Tearney,
B. E. Bouma,
C. Pitris, and
M. E. Brezinski,
“High resolution in vivo intra-arterial imaging with optical coherence tomography,”
Heart, 82 128
–133
(1999). 1355-6037 Google Scholar
B. W. Colston,
U. S. Sathyam,
L. B. DaSilva,
M. J. Everett,
P. Stroeve, and
L. L. Otis,
“Dental OCT,”
Opt. Express, 3 230
–238
(1998). 1094-4087 Google Scholar
E. S. Matheny,
N. M. Hanna,
W. G. Jung,
Z. Chen,
P. Wilder-Smith,
R. Mina-Araghi, and
M. Brenner,
“Optical coherence tomography of malignancy in hamster cheek pouches,”
J. Biomed. Opt., 9
(5), 978
–981
(2004). https://doi.org/10.1117/1.1783897 1083-3668 Google Scholar
M. R. Hee,
D. Huang,
E. A. Swanson, and
J. G. Fujimoto,
“Polarization-sensitive low-coherence reflectometer for birefringence characterization and ranging,”
J. Opt. Soc. Am. B, 9 903
–908
(1992). 0740-3224 Google Scholar
J. A. Izatt,
M. R. Hee,
D. Huang,
J. G. Fujimoto,
E. A. Swanson,
C. P. Lin,
J. S. Schuman, and
C. A. Puliafito, Medical Optical Tomography: Functional Imaging and Monitoring, IS11 450
–472 SPIE Press, Bellingham, WA
(1993). Google Scholar
J. F. de Boer,
T. E. Milner,
M. J. C. vanGemert, and
J. S. Nelson,
“Two-dimensional birefringence imaging in biological tissue by polarization-sensitive optical coherence tomography,”
Opt. Lett., 22 934
–936
(1997). 0146-9592 Google Scholar
X. J. Wang,
T. E. Milner,
J. F. de Boer,
Y. Zhang,
D. H. Pashley, and
J. S. Nelson,
“Characterization of dentin and enamel by use of optical coherence tomography,”
Appl. Opt., 38 2092
–2096
(1999). 0003-6935 Google Scholar
A. Baumgartner,
C. K. Hitzenberger,
S. Dicht,
H. Sattmann,
A. Moritz,
W. Sperr, and
A. F. Fercher,
“Optical coherence tomography for dental structures,”
Proc. SPIE, 3248 130
–136
(1998). 0277-786X Google Scholar
A. Baumgartner,
S. Dicht,
C. K. Hitzenberger,
H. Sattmann,
B. Robi,
A. Moritz,
W. Sperr, and
A. F. Fercher,
“Polarization-sensitive optical coherence tomography of dental structures,”
Caries Res., 34 59
–69
(2000). 0008-6568 Google Scholar
G. Huynh,
C. L. Darling, and
D. Fried,
“Changes in the optical properties of dental enamel at after demineralization,”
Proc. SPIE, 5313 118
–124
(2004). 0277-786X Google Scholar
M. J. Everett,
B. W. Colston,
U. S. Sathyam,
L. B. D. Silva,
D. Fried, and
J. D. B. Featherstone,
“Non-invasive diagnosis of early caries with polarization sensitive optical coherence tomography (PS-OCT),”
Proc. SPIE, 3593 177
–183
(1999). 0277-786X Google Scholar
R. S. Jones,
M. Staninec, and
D. Fried,
“Imaging artificial caries under composite sealants and restorations,”
J. Biomed. Opt., 9
(6), 1297
–1304
(2004). https://doi.org/10.1117/1.1805562 1083-3668 Google Scholar
D. Fried,
J. Xie,
S. Shafi,
J. D. B. Featherstone,
T. Breunig, and
C. Q. Lee,
“Early detection of dental caries and lesion progression with polarization sensitive optical coherence tomography,”
J. Biomed. Opt., 7
(4), 618
–627
(2002). https://doi.org/10.1117/1.1509752 1083-3668 Google Scholar
Y. Iijima,
O. Takagi,
J. Ruben, and
J. Arends,
“In vitro remineralization of in vivo and in vitro formed enamel lesions,”
Caries Res., 33 206
–213
(1999). 0008-6568 Google Scholar
J. M. Cate and
J. Arends,
“Remineralization of artificial enamel lesions in vitro,”
Caries Res., 11 277
–286
(1977). 0008-6568 Google Scholar
J. M. ten Cate and
J. Arends,
“Remineralization of artificial enamel lesions in vitro:III. A study of the deposition mechanism,”
Caries Res., 14 351
–358
(1980). 0008-6568 Google Scholar
J. M. ten Cate,
W. L. Jongebloed, and
J. Arends,
“Remineralization of artificial enamel lesions in vitro. IV. Influence of fluorides and diphosphonates on short- and long-term reimineralization,”
Caries Res., 15 60
–69
(1981). 0008-6568 Google Scholar
D. Fried,
J. D. B. Featherstone,
R. E. Glena, and
W. Seka,
“The nature of light scattering in dental enamel and dentin at visible and near-IR wavelengths,”
Appl. Opt., 34 1278
–1285
(1995). 0003-6935 Google Scholar
R. S. Jones,
G. D. Huynh,
G. C. Jones, and
D. Fried,
“Near-infrared transillumination at for the imaging of early dental decay,”
Opt. Express, 11 2259
–2265
(2003). 1094-4087 Google Scholar
D. J. White and
J. D. B. Featherstone,
“A longitudinal microhardness analysis of fluoride dentifrice effects on lesion progression in vitro,”
Caries Res., 21 502
–512
(1987). 0008-6568 Google Scholar
J. D. B. Featherstone,
M. M. O’Reilly,
M. Shariati, and
S. Brugler, Factors Relating to Demineralization and Remineralization of the Teeth, IRL Press, Oxford, UK
(1986). Google Scholar
J. D. B. Featherstone,
R. Glena,
M. Shariati, and
C. P. Shields,
“Dependence of in vitro demineralization and remineralization of dental enamel on fluoride concentration,”
J. Dent. Res., 69 620
–625
(1990). 0022-0345 Google Scholar
J. M. Schmitt,
“Optical coherence tomography (OCT): a review,”
IEEE J. Sel. Top. Quantum Electron., 5 1205
–1215
(1999). https://doi.org/10.1109/2944.796348 1077-260X Google Scholar
J. de Boer, Handbook of Optical Coherence Tomography, 1
–40 Marcel Dekker AG, New York
(2002). Google Scholar
T. F. Johnston and
M. W. Sasnett, Handbook of Optical and Laser Scanning, 1
–70 Marcel Dekker, Inc., New York
(2004). Google Scholar
R. S. Jones,
M. Staninec, and
D. Fried,
“Imaging secondary caries under composite sealants and restorations,”
Proc. SPIE, 5313 7
–16
(2004). 0277-786X Google Scholar
B. Angmar,
D. Carlstrom, and
J. E. Glas,
“Studies on the ultrastructure of dental enamel. IV. The mineralization of normal human enamel,”
J. Ultrastruct. Res., 8 12
–23
(1963). 0022-5320 Google Scholar
A. I. Issa,
K. P. Preston,
A. J. Preston,
K. J. Toumba, and
M. S. Duggal,
“A study investigating the formation of artificial sub-surface enamel caries-like lesions in deciduous and permanent teeth in the presence and absence of fluoride,”
Arch. Oral Biol., 48 567
–571
(2003). 0003-9969 Google Scholar
W. R. McKinney,
C. J. Hirschmugl,
H. A. Padmore,
T. Lauritzen,
N. Andresen,
G. Andronaco,
R. Patton, and
M. Fong, Proc. SPIE, 3153 59
–67
(1997). 0277-786X Google Scholar
J. Arends and
T. Gelhard, Demineralization and Remineralization of the Teeth, 1
–16 IRL Press, Oxford, UK
(1983). Google Scholar
R. S. Jones,
C. L. Darling,
J. D. B. Featherstone, and
D. Fried,
“Imaging artificial caries on the occlusal surfaces with polarization sensitive optical coherence tomography,”
Caries Res.,
(0008-6568) Google Scholar
P. Ngaotheppitak,
C. L. Darling, and
D. Fried,
“Measurement of the severity of natural smooth surface (interproximal) caries lesions with polarization sensitive optical coherence tomography,”
Lasers Surg. Med., 37 78
–88
(2005). 0196-8092 Google Scholar
J. Arends,
J. L. Ruben, and
D. Inaba,
“Major topics in quantitative microradiography of enamel and dentin: R parameter, mineral distribution visualization, and hyper-remineralization,”
Adv. Dent. Res., 11 403
–414
(1997). 0895-9374 Google Scholar
T. Yanagisawa and
Y. Miake,
“High-resolution electron microscopy of enamel-crystal demineralization and remineralization in carious lesions,”
J. Electron Microsc., 52 605
–613
(2003). 0022-0744 Google Scholar
Y. Miake,
Y. Saeki,
M. Takahashi, and
T. Yanagisawa,
“Remineralization effects of xylitol on demineralized enamel,”
J. Electron Microsc., 52 471
–476
(2003). 0022-0744 Google Scholar
P. Wilder-Smith,
C. Wilder-Smith,
M. Hammer-Wilson,
V. Nguyen,
M. Truong,
G. Jequinto,
J. Zhang,
W. Jung, and
Z. Chen,
“Non-invasive quantification of enamel erosion and demineralization,”
Lasers Surg. Med., 36 18
(2005). 0196-8092 Google Scholar
K. Yamagishi,
K. Onuma,
T. Suzuki,
F. Okada,
J. Tagami,
M. Otsuki, and
P. Senawangse,
“Materials chemistry: a synthetic enamel for rapid tooth repair,”
Nature (London), 433 819
(2005). 0028-0836 Google Scholar
R. S. Jones and
D. Fried,
“Quantifying the remineralization of artificial caries using PS-OCT,”
Proc. SPIE, 6137 0277-786X Google Scholar
|


