|
|
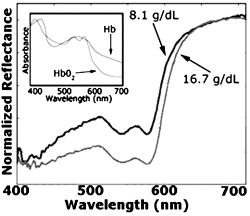
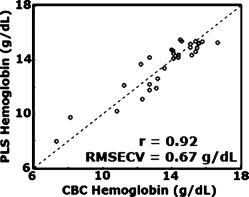
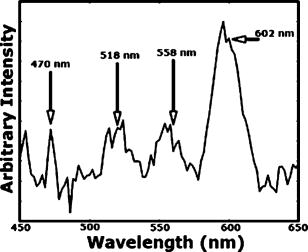
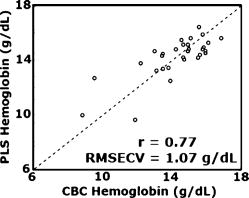
1.IntroductionAnemia afflicts 3.5 million Americans, while millions more go undiagnosed.1 Anemia is the shortage of the oxygen carrying protein hemoglobin in the bloodstream, specifically in concentrations less than for men and for women as is defined by the World Health Organization.2 While there are numerous forms and causes of anemia, it universally affects physical function through fatigue and weakness. More seriously, anemia has been shown to decrease myocardial function, increase peripheral arterial vasodilation, and activate the sympathetic and reninangiotensin-aldosterone system, which influences the progression of both heart and kidney failure.3, 4, 5 Current clinically accepted methods of diagnosing anemia include either collecting blood by finger lancet followed by centrifugation, or the more time-consuming complete blood count (CBC) test that requires a venipuncture and analysis of collected blood in a hematology laboratory. In the contemporary climate of expanding noninvasive optical diagnostic techniques, the CBC remains extremely accurate, yet antiquated. A CBC test is painful to the patient, expensive to perform when including the cost of instrumentation and labor, and takes time for analysis, causing it to be often excluded from routine physical exams. Drawing blood invasively also places the phlebotomist at risk for contracting blood-borne pathogens. Clearly, an alternative method of measuring hemoglobin levels that is both rapid and easy is necessary. The necessity of an enhanced technique to screen for anemia has resulted in investigations on numerous noninvasive hemoglobin measurement methods including retinal imaging,6 blood oxygenation monitoring,7, 8 and photoplethysmography.9 These techniques have shown degrees of success but often involve complicated, expensive instrumentation and are thus not viable in a rapid clinical setting. Several other noninvasive techniques using transmission and reflectance spectroscopy have also been explored. Kanashima 10 tested the performance of the Astrim noninvasive hemoglobin monitor, a commercial product from Sysmex (Kobe, Japan) that utilizes near-IR (NIR) transmission through the fingertip along with blood vessel imaging in calculation of hemoglobin concentration. Rendell 11 likewise explored NIR transmission through the fingertip as a marker of total hemoglobin concentration with some success. Geva 12 examined a technique termed occlusion spectroscopy that also uses transmitted and scattered NIR radiation through the fingertip to infer hemoglobin concentration. This signal is enhanced by occluding the blood flow, which in turn accelerates red blood cell aggregation, and then releasing the occlusion finger cuff and allowing red blood cells to disaggregate.13 Zonios 14 described the use of visible diffuse reflectance from the skin to measure total oxy- and deoxyhemoglobin concentration as well as melanin content. The utility of reflectance signals in monitoring total hemoglobin was demonstrated intrapatient through demonstration of the diffuse signal's ability to monitor reactive hyperemia following an occlusion and release of blood flow; however, interpatient predictive ability was not discussed here. Wu 15 as well examined the use of visible diffuse reflectance spectroscopy to measure total hemoglobin concentration. This group uniquely took one step further in improving accuracy by locally controlling the skin temperature, which has been shown to affect absorption and scattering coefficients of tissues by altering cutaneous blood flow. Here an alternative method of spectroscopically measuring total hemoglobin concentration noninvasively is presented. As a quick examination for severe anemia, clinicians expose the inner lining of the lower eyelid, the palpebral conjunctiva, and look for a pale and uniform tint across the surface indicating anemia as opposed to a bright red tint in healthy patients.16, 17, 18 The conjunctiva is an attractive location to diagnose anemia as it is a highly vascular area. The capillaries are close to the surface, and the overlying mucous membrane of the conjunctiva is quite transparent. More than 90% of physicians report the conjunctiva is the most attractive anatomical location for diagnosing anemia rather than nail beds, palmar creases, or the tongue.19 A clinician’s qualitative examination of the conjunctiva has only been shown to be, at best, 70% accurate in diagnosing anemia independent of training.19 Another report has shown diagnosing anemia using the palpebral conjunctiva hue (PCH) is 80 to 90% specific but only 40% sensitive and leaves numerous cases undiagnosed.20 Current attempts to take the examination of the conjunctiva from a qualitative inspection to a quantitative evaluation have been limited to the use of Commission Internationale de I’Eclairage (CIE)-based color charts as comparative tools;21, 22 however, this is still subject to clinician interpretive color matching and has only moderately improved the sensitivity and specificity of conjunctival anemia diagnosis. Recently, we examined the feasibility of applying an algorithm to digital photographs of the conjunctiva as a predictive model for the hemoglobin concentration with moderately successful results.23 In this paper, we report predicted hemoglobin concentrations using diffuse reflectance spectroscopy collected with a grating spectrometer as a quantitative measurement of the optical properties of the conjunctiva. A model based on the reflectance spectra will be used to assess the predictive ability of this method of analysis. As opposed to the spectroscopic techniques described previously, which uniformly involve characterization of skin tissues and thus are sensitive to melanin concentrations, the palpebral conjunctiva is a mucosal surface that has comparatively less melanin content and as a result is less sensitive to interpatient melanin variation (i.e., ethnicity differences). Furthermore, the closer proximity of capillaries to the surface than in other tissues enable reflectance signals to be stronger and afford less expensive instrumentation for adequate light collection. 2.Materials and Methods2.1.Patient DemographicsThirty-two patients from the emergency department at Rhode Island Hospital (Providence, Rhode Island) were enrolled in this study. All patients were at least 18 yr of age, able to give written and verbal consent, and willing to participate. The institutional review board of Rhode Island Hospital approved this study. Recruited patients were all ambulatory and had been approved for participation by an attending physician. Patients with a variety of complaints were enrolled to simulate a random patient population. Patients with acute cardiac symptoms, musculoskeletal injuries inhibiting comfortable relocation to the research location, symptoms of stroke, patients not yet seen or cleared by a physician and critically ill patients were excluded from this study. Of the 32 consented patients, 30 were able to participate. Two patients were unable to participate; one due to nausea and abdominal pain during the enrollment procedure, and one because the conjunctiva could not be sufficiently exposed for spectroscopic measurements. Additionally, only patients with oxygen saturation were enrolled to exclude hypoxic patients during preliminary evaluation of the efficacy of this technique. A list of chief complaints from patients enrolled is given in Table 1 . 2.2.Method for Diffuse Reflectance SpectroscopyPatients were seated with their heads resting on an in-house constructed mount to stabilize conjunctiva exposure location. These mounts were similar in fabrication to those of an ophthalmic slit lamp. A PR-705 visible spectrophotometer from Photoresearch (Chatsworth, California) with eyepiece to target collection region was mounted on a variable-height platform with a separation of approximately from the spectrometer to the exposed conjunctiva. Spectral signatures were collected from 380 to . The conjunctiva was illuminated through free space with a quartz-tungsten-halogen (QTH) source from Lot-Oriel (Surrey, United Kingdom) at an illumination angle of with respect to the plane of the conjunctiva and a separation of approximately from source element to conjunctiva. A total broadband source power of was used for all measurements, chosen to be as intense as possible without causing the subject discomfort. The irradiance of this source does not exceed across the visible wavelength range and thus does not pose a radiation exposure risk according to ANSI Z136.1 standards for incoherent radiation exposure.24 As a comfort measure, patients averted their eyes opposite the direction of illumination to avoid prolonged retinal exposure to illumination. Source spectral characteristics were recorded and behaved as expected for a QTH source with the intensity increasing close to linearly with increasing wavelength. Collimating optics were affixed to the source tower to provide uniform illumination of the conjunctiva, enabling rapid measurement of various spatial locations. Ambient sunlight and room lights were normalized from data by collecting reference source spectrum each day and comparing conjunctiva spectra to this respective source data. This method of ambient light correction was the optimal available technique as a dark room facility was unavailable during clinical trials. Data collection was controlled by the SpectraWin software platform from Photoresearch (Chatsworth, California). All spectra were collected in reflectance mode with an aperture size of 1-deg field of view, translating to an aperture size of approximately for spectrometer to conjunctiva separation of . While a smaller aperture would be more suited to collect reflectance spectra from single capillary vessels, the random movements of patients during acquisition prevented this procedure. A larger aperture enabled reflectance signal from numerous capillaries to be integrated together, eliminating artifacts from the aperture moving off and on individual capillaries. Acquisition times were varied by the SpectraWin software platform to integrate until a benchmark total signal level was obtained. This enabled reflectance signals to be comparable in intensity despite small patient-to-patient variations in conjunctival structure, illumination angles, and source/spectrometer/patient separations. The acquisition time for each spectrum was on average four seconds per spectra as set by the SpectraWin platform. The spatial location on the conjunctiva most representative of the hemoglobin concentration is suspected to be the portion closest to the mucocutaneous junction; where the conjunctiva meets the skin layer at the edge of the eyelid. This area of the anterior rim of the conjunctiva is the tarsal plate, while the posterior region closer to the sclera is termed the fornix (see Fig. 1 ). Spectra were taken from both regions to examine spectral correlations with hemoglobin concentration in each, and also to examine the difference in the two regions and those correlations to the hemoglobin concentration. Three spectra were taken from the anterior rim of the conjunctiva and two spectra were taken from the posterior region. These numbers were chosen to minimize the data collection time period while still providing multiple spectra. These spectra were averaged to eliminate as much intrapatient variation as possible due to inadvertent eye movements. Spectra were initially collected from both eyes, but data analysis was later limited to the right eye only due to (1) similarities of reflectance spectra from both eyes, and (2) difficulties providing uniform illumination on the other eye with the fixed optical setup due to shadowing from the nose bridge. 2.3.Spectral AnalysisCollected spectra were exported to Matlab (Mathworks, Natick, Massachusetts) to apply regression algorithms and for analysis of model quality. Two separate analytical techniques were used to quantify the correlation of the conjunctival reflectance spectra with varying hemoglobin concentration. The first method employed a coupled partial least-squares (PLS) multivariate calibration and quadratic regression to extract hemoglobin concentration values from spectral data. The PLS algorithm is similar to that of principle component regression (PCR) techniques, but it utilizes the known concentration information coupled with varying spectral features in forming optimal predictive orthogonal principle components (PLS loading vectors). PLS is a widely used technique in absorption spectroscopy that is described in detail elsewhere in the literature.25, 26 The quadratic function is applied to the results of the PLS calibration to adjust for the nonlinearity of diffuse reflectance spectra with concentration and is used here in place of a nonlinear multivariate technique. The second technique is based on ratios of specific regions of the spectra. This technique does not require collection of a continuous spectrum, but rather certain discrete data points. While it is anticipated this model will not be as accurate as the PLS calibration, the motivation for this technique is that a full spectral collection from the conjunctiva using a grating spectrometer may not be necessary, rather only reflectance measurements in a few predefined wavelength regions. 2.4.Digital PhotographyBecause the PR-705 spectrophotometer used for data collection is not additionally equipped with a CCD camera for capturing digital images, digital photographs were taken of patients following data collection. While a previous study has used photographs as an analytical tool,23 here they are purely for observation and not integrated into analysis. 3.ResultsAmong the 30 patients recruited for the study, the average age was 42 years old with 14 males and 16 females. Twenty-one of these patients were Caucasian, 6 were Hispanic, and 3 were African-American. The mean hemoglobin concentration was with range of 7.3 to . The average oxygen saturation was . Using the World Health Organization (WHO) definition of anemia, our sample contained seven patients with clinical anemia. Of these seven, two were a result of congenital hemoglobin defects thalassemia and sickle cell anemia respectively, and a third from pregnancy. The cause of anemia for the remaining four patients in this subset was not determined. Digital photographs of the conjunctiva from four patients with varying hemoglobin levels are displayed in Fig. 2 . While the gross difference in PCH from Fig. 2a to Fig. 2d is evident, clearly in a qualitative setting the subtle changes in hue from one concentration to the next is unclear. The results presented here show that a quantitative technique removes much of the subjectivity of a clinician’s analysis of the conjunctiva. Preliminary regression studies found, as was expected, the tarsal region of the conjunctiva demonstrated superior correlation over the fornix or a comparison of the fornix and tarsal regions. These respective regions along with the mucocutaneous junction are shown in Fig. 1. Hereafter, only reflectance spectra from the tarsal plate are explored with modeling techniques. Fig. 2Digital photographs of the palpebral conjuctiva of four patients with hemoglobin concentrations of (a) 7.3, (b) 12.7, (c) 14.0, and (d) . 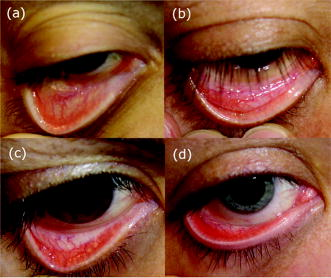 3.1.Precision TestingThe three repeated measurements of the tarsal region of the palpebral conjunctiva in each patient were compared to assess the repeatability of reflectance spectra measurements. This value encompassed both the reproducibility of the PR-705 spectrometer as well as spatial location stability. The coefficient of variation (CV) is calculated using a ratio of the standard deviation of the three samples at each wavelength to the mean at this wavelength. These values are then averaged to depict the intrapatient deviation. This is calculated for all 30 patients and averaged again to represent the mean CV across all spectra. CVs are calculated from 400 to , removing the high noise components of the spectra between 380 and caused primarily because of low QTH source energy at these short wavelengths. The mean CV of all 30 spectra averaged over all reflected wavelengths is 8.97%, implying that reflectance signals fluctuated on average around the mean value at each wavelength. The PR-705, when tested on a static surface (a Lambertian scattering plate) has shown CVs close to 1%. Because the three spectra were taken only apart, the higher CVs in this experiment are attributed to small shifts in sampling location from one measurement to the next rather than a temporal change in the conjunctival characteristics within this timeframe. This is discussed further in Sec. 4. 3.2.Partial Least-Squares AnalysisThirty reflectance spectra were normalized to the minima of hemoglobin absorbance at and sent into the PLS algorithm with a maximum of 25 PLS loading vectors. Two representative conjunctival reflectance spectra are shown in Fig. 3 , with the absorbance spectra of oxyhemoglobin and deoxyhemoglobin depicted in the inset. The two conjunctival reflectance spectra have been normalized to the minima of oxyhemoglobin absorbance at to emphasize the different lineshapes. Data was again excluded from 380 to preceding analysis due to high noise values in this region. Due to the limited sample size, predictive ability was examined using a leave-one-out cross validation. One spectrum was removed from the set while the remaining points were used to generate a PLS model and the quadratic scaling function for correcting nonlinearity. This model was then used to predict the concentration of the excluded patient. This process is repeated for all remaining data points such that a predictive value is generated for each patient. The results of the leave-one-out cross validation using a PLS calibration are shown in Fig. 4 . The Pearson coefficient of correlation was calculated to be 0.92 and root mean squared error of cross validation (RMSECV) to be using seven loading vectors in the PLS algorithm. The standard deviation about prediction is . The predictive accuracy reaches 97% (Pearson ) of its maximum correlation (using 15 loading vectors) with seven factors. Beyond 15 loading vectors, the predictive ability starts to worsen as the algorithm likely begins overfitting and modeling the noise as a component of the spectra. 3.3.Discrete Region Modeling AnalysisNumerous discrete parameters were examined and found to correlate with the changing hemoglobin concentration. These included single-point intensities after normalization, ratios of two-point intensities, and three-point ratios of three spectral points, all of which provided some degree of predictive ability. The optimum predictive parameter using only four inputs was determined based on the PLS calibration vector formed by the PLS model. Four Gaussian functions were chosen, each with the same linewidth and varying maxima location, to overlap significant features in the PLS loading vector. The Gaussian functions chosen were each wide with peak locations at 470, 518, 558, and (see Sec. 4 for explanation). The PLS calibration vector with seven factors is shown in Fig. 5 with Gaussian peak maxima labeled. The reflectance signal under the Gaussian function was then scaled according to the relative intensities of the PLS calibration vector and this parameter was quadratically fitted to predict the hemoglobin concentration. Square filter summed regions of 20-nm bandwidth at these same maxima locations provided similar predictive ability. Due to the limited sample size, the predictive ability of this model was again tested using a leave-one-out cross validation of the data points. The Pearson coefficient of correlation was 0.77 and the RMSECV was . The standard deviation about regression is . The predictive plot from this model is shown in Fig. 6 . 4.DiscussionThe palpebral conjunctiva was explored as an indicator of hemoglobin because of its high vascularity, its accessibility, its uniformity across ethnicity, and the transparency of its thin mucous membrane, which can provide strong reflectance signals. This is the first report on an analytical technique in assessing the quantitative degree of correlation of the palpebral conjunctiva with the total hemoglobin concentration. The sensitivity and specificity of the prediction should be passable for diagnosing most cases of anemia. Using the WHO definition of anemia for males and females, the PLS model and discrete region model can both be evaluated as a binary predictor of clinical anemia. For the seven patients whose CBC results found them clinically anemic, the PLS algorithm predicted six to be clinically anemic, resulting in a sensitivity of 86%. For the 23 patients whose CBC results showed them to have normal hemoglobin levels, the PLS algorithm predicted 21 to have normal hemoglobin levels, resulting in a specificity of 91%. This is an enhancement in both factors over color comparison charts or traditional clinician inspection methods. The utility of the PLS algorithm across ethnicities is additionally assessed. The results of the PLS/quadratic algorithm are presented as a Bland-Altman29 plot in Fig. 7 . Figure 7 shows the predictive capabilities for the Caucasian, Hispanic, and African-American demographics to be comparable. The average errors using the PLS model for the Caucasian population , Hispanic population , and African-American population were 0.63, 0.59, and , respectively. However, the limited numbers of participants of varying ethnicity limit clear assessment of the accuracy of the technique for each skin type. As stated previously, it is expected that a larger clinical trial will show little variation of accuracy among skin types because melanin content is minimal at the mucosal conjunctiva surface. Unfortunately, this study included no participants of Asian decent, another facet that will be addressed in a future study. Fig. 7Bland-Altman plot of PLS predicted hemoglobin concentrations versus CBC calculated hemoglobin concentration. Solid line is at the mean difference of CBC/PLS predicted hemoglobin and dashed lines are drawn at standard deviations to represent limits of agreement. Patients are divided into ethnicity to emphasize predictive ability across skin pigments. 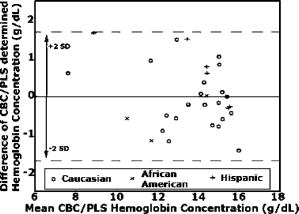 Table 1Chief complaints of study participants.
The discrete region model had a much lower coefficient of correlation, which is anticipated due to the spectral content discarded on summing Gaussian bands of signal. As a result of the degraded correlation, the discrete region model has reduced specificity and sensitivity. The sensitivity of this model is 57% as only four of the seven clinically anemic patients were predicted to be anemic by this algorithm. Of the 23 patients found to have normal hemoglobin levels, the discrete region model predicted 23 of the 23 to have normal levels, resulting in a specificity of 100%. Although the specificity here is improved over the PLS model, the low correlation coefficient makes it naive to believe this is more than an artifact of a small data set. With the lower correlation coefficient in the discrete region model, the accuracy is inferior to the PLS algorithm and demonstrates that more Gaussian regions are necessary to more effectively extract hemoglobin concentration. Multivariate regression techniques are the methods of choice for extracting quantitative information from spectral signals with numerous varying components. While hemoglobin (both oxyhemoglobin and deoxyhemoglobin) is the primary chromophore affecting the reflectance spectra, other varying blood constituents, scattering effects, and skin pigments minimally affect spectral signatures. A robust model is necessary to most effectively predict hemoglobin in the presence of these varying constituents. The PLS algorithm utilizes the entire spectral signature to create a model, and unlike a classical least-squares approach it does not necessitate a priori knowledge of each varying chromophore’s concentration in the calibration set, but rather only the chromophore of interest. As stated in Sec. 3, the predictive ability of the PLS model reaches 97% of its optimal value after only seven loading vectors were applied and concentrations calculated. This low number of loading vectors implies the spectra can be well modeled with a limited number of principal components. This is intuitive as reflectance spectra from the conjunctiva have a small number of appreciable chromophores contributing to their signature and thus can be accurately depicted with a limited number of components. The oxidation state of the hemoglobin is not represented in the PLS model; rather, hypoxic patients [as determined with a Nellcor (Pleasanton, California) pulse oximeter] were excluded from this study. Oxyhemoglobin and deoxyhemoglobin have similar spectral signatures in the visible range, as shown in the inset of Fig. 3. The primary differences are deoxyhemoglobin has a single absorption peak centered at , while oxyhemoglobin has a doublet in this region; and the lineshapes significantly differ beyond with being much more absorptive. The PLS algorithm breaks down the full spectral signature into its relative components and thus will decompose the spectra into both oxy- and deoxyhemoglobin signatures. However, because different linear combinations of the oxy- and deoxyhemoglobin signature represent total hemoglobin concentration in each patient, a factor that cannot be calculated by our algorithm, error is introduced into the prediction. The severity of errors in predictive accuracy depends both on the range of oxygen saturation values and the similarity of the spectral signatures in regions utilized for quantitative concentration extraction. The standard deviation of oxygen saturation as measured using pulse oximetry was only 1.5%, however, this value may not be an adequate depiction of the oxygen saturation of the palpebral conjunctiva. Drawing an arterial blood gas was unnecessary in the emergency department care of study participants and as such we cannot comment on the true arterial oxygen saturation of each patient, but rather only the photometric estimation of this parameter. The standard errors of pulse oximetry are between 1 and 2%. Capillary oxygen saturation varies as a result of the oxygen gradient from active metabolism, which depends on an individual’s oxygen consumption, and as a result may have higher variability than arterial saturation. This variability combined with standard errors of pulse oximetry causes the standard deviation of palpebral conjunctiva capillary oxygenation to potentially be greater than 1.5%. Regions of data weighted heavily in concentration prediction are represented by the PLS calibration vector. As shown in Fig. 5, a majority of information used for concentration prediction is at and below, primarily isosbestic regions for oxy- and deoxyhemoglobin. This implies that the variability of oxygen saturation states, although possibly greater than the estimated 1.5%, will have a lesser effect on overall technique efficacy. The final embodiment of this technique necessitates tolerance of all oxygen saturation states. This problem can be approached using a more robust spectral instrument and the operating principle of a commercial pulse oximeter. A pulse oximeter records the difference in absorbance at and of optical transmission during arterial pulses, correlating to the relative amount of oxy- and deoxyhemoglobin because of differing extinction coefficients for each species at these wavelengths. If a spectrophotometer capable of measuring reflectance wavelengths as long as is implemented, the same principal can be used on diffuse reflectance spectra from the conjunctiva to infer average capillary saturations. This could potentially be used as an input parameter for an alternative multivariate calibration from which it could more accurately predict total hemoglobin concentration independent of oxygen saturation. A drawback of our clinical study herein lies in the fact that our spectrometer does not capture images of the conjunctiva while it integrates signal. Because the aperture used to collect signal is large on the scale of the conjunctiva, even small movements cause a portion of the integrated signal to be collected from the edge of the eyelid. Although the patients’ heads are stabilized in mounts, small eye movements and inadvertent blinks can cause this to occur even after the spectrometer aperture has been centered on the appropriate region. The CVs shown in Sec. 3.1 show significant variability in sampling due to motion artifacts from sampling the edges of the eyelid, and from sampling slightly different spatial areas with resultant changing capillary densities in the conjunctiva. This is anticipated to be one source of error in our experimental method and can be addressed in further experimentation through an alternative spectrometer with video capture capabilities, or optimally a real-time spectral monitoring technique. Ideally, a spectral imaging device could be used to image the conjunctiva and process reflectance signals from spatially resolved individual capillary vessels. Results showing the correlation of hemoglobin concentration to a four-Gaussian-filter model, although as stated previously, is less accurate than a PLS calibration, demonstrate the feasibility of noninvasively measuring total hemoglobin with a simpler instrument than a grating-based spectrometer. Observing the absorbance spectra of oxy- and deoxyhemoglobin in the inset of Fig. 3, the Gaussian functions are located at important spectral features, specifically near local minima in the oxyhemoglobin spectra at 470 and , at a local maxima of oxyhemoglobin around , and at the center of the sloping edge of the reflectance spectra at . The PLS algorithm utilizes these features as they vary most accordingly with total hemoglobin concentration. Summed 30-nm bandwidth filters likely provide better predictive ability than individual wavelength intensities because they average small variations in the spectra again caused by the presence of two species of hemoglobin, especially at the singlet/doublet region at . Utilizing a model analogous to this but including more Gaussian regions, a multiple transmission filter and photodiode device can be envisioned as a compact and inexpensive method of noninvasive total hemoglobin measurement. 5.ConclusionsSupplementing a clinician’s inspection of the conjunctiva to diagnose anemia with a tool that spectroscopically analyzes the conjunctiva provides a more reliable methodology for detecting even marginal cases of anemia. The high vascularity and accessibility of the conjunctiva make it an attractive location to start developing a quantitative, yet noninvasive method of hemoglobin concentration measurement. Although only a small patient population was recruited for this pilot study, the utility of using reflectance spectra from the conjunctiva has been shown to have great promise for future experimentation. This preliminary study has shown that spectroscopically analyzing the conjunctiva has yet to approach the accuracy of widely accepted in vitro testing methods, but in its embryonic state has achieved comparable accuracies to alternative methodologies of noninvasive screening. 10, 11, 12, 13, 14, 15 While a multivariate algorithm such as PLS coupled with a nonlinear adjustment has shown to be effective at extracting the total hemoglobin concentration from the reflectance spectra, future studies will include investigation into nonlinear multivariate calibrations and their utility here. It was also shown that a simple ratio of certain bands of data does show potential to extract similar information. This fact may enable a device that can measure hemoglobin noninvasively and remain more compact than a commercial spectrometer. A device such as this will enable rapid screening for anemia of all at-risk patients. AcknowledgmentsThe authors would graciously like to thank Dr. Susan Duffy, Michelle Kollett, and Vigaya Potluri for their assistance in data collection and patient recruitment. Financial support is acknowledged from the Charles E. Culpeper Biomedical Initiative Pilot Project as well as the NASA Graduate Student Research Program Fellowship. ReferencesL. T. Goodnough and
A. R. Nissenson,
“Anemia anal its clinical consequences in patients with chronic diseases,”
Am. J. Med., 116 1
–2
(2004). 0002-9343 Google Scholar
S. J. Baker and
E. M. Demaeyer,
“Nutritional anemia—its understanding and control with special reference to the work of the World-Health-Organization,”
Am. J. Clin. Nutr., 32 368
–417
(1979). 0002-9165 Google Scholar
A. A. Pereira and
M. J. Sarnak,
“Anemia as a risk factor for cardiovascular disease,”
Kidney Int., 64 32
–39
(2003). 0085-2538 Google Scholar
D. S. Silverberg,
A. Iaina,
D. Wexler, and
M. Blum,
“The pathological consequences of anaemia,”
Clin. Lab Haematol., 23 1
–6
(2001). 0141-9854 Google Scholar
R. D. Toto,
“Anemia of chronic disease: past, present, and future,”
Kidney Int., 64 20
–23
(2003). 0085-2538 Google Scholar
M. J. Rice,
R. H. Sweat,
J. M. Rioux,
W. T. Williams, and
W. Routt,
“Non-invasive measurement of blood components using retinal imaging!,”
(2002) Google Scholar
P. B. Benni,
“Method for non-invasive spectrophotometric blood oxygenation monitoring,”
(2002) Google Scholar
V. Diaconu and
J. Faubert,
“On-line and real-time spectroreflectometry measurement of oxygenation in a patient's eye,”
(2000) Google Scholar
T. K. Aldrich,
M. Moosikasuwan,
S. D. Shah, and
K. S. Deshpande,
“Length-normalized pulse photoplethysmography: a noninvasive method to measure blood hemoglobin,”
Ann. Biomed. Eng., 30 1291
–1298
(2002). https://doi.org/10.1114/1.1527046 0090-6964 Google Scholar
H. Kanashima,
T. Yamane,
T. Takubo,
T. Kamitani, and
M. Hino,
“Evaluation of noninvasive hemoglobin monitoring for hematological disorders,”
J. Clin. Lab Anal, 19 1
–5
(2005). 0887-8013 Google Scholar
M. Rendell,
E. Anderson,
W. Schlueter,
J. Mailliard,
D. Honigs, and
R. Rosenthal,
“Determination of hemoglobin levels in the finger using near infrared spectroscopy,”
Clin. Lab Haematol., 25 93
–97
(2003). 0141-9854 Google Scholar
D. Geva,
B. Z. Sklar,
E. Menashkin, and
I. Fine,
“New approach in non-invasive measurement of Hb/Hct/Sp0(2),”
Anesthesiology, 93 U154
–U154
(2000). 0003-3022 Google Scholar
A. Berrebi and
I. Fine,
“Non-invasive measurement of hemoglobin/hematocrit over a wide clinical range using a new optical signal processing method,”
Blood, 94 10B
–10B
(1999). 0006-4971 Google Scholar
G. Zonios,
J. Bykowski, and
N. Kollias,
“Skin melanin, hemoglobin, and light scattering properties can be quantitatively assessed in vivo using diffuse reflectance spectroscopy,”
J. Invest. Dermatol., 117 1452
–1457
(2001). https://doi.org/10.1046/j.0022-202x.2001.01577.x 0022-202X Google Scholar
X. M. Wu,
S. Yeh,
T. W. Jeng, and
O. S. Khalil,
“Noninvasive determination of hemoglobin and hematocrit using a temperature-controlled localized reflectance tissue photometer,”
Anal. Biochem., 287 284
–293
(2000). https://doi.org/10.1006/abio.2000.4854 0003-2697 Google Scholar
T. N. Sheth,
N. K. Choudhry,
M. Bowes, and
A. S. Detsky,
“The relation of conjunctival pallor to the presence of anemia,”
J. Gen. Intern Med., 12 102
–106
(1997). 0884-8734 Google Scholar
R. J. Stoltzfus,
A. Edward-Raj,
M. L. Dreyfuss,
M. Albonico,
A. Montresor,
M. D. Thapa,
K. P. West,
H. M. Chwaya,
L. Savioli, and
J. Tielsch,
“Clinical pallor is useful to detect severe anemia in populations where anemia is prevalent and severe,”
J. Nutr., 129 1675
–1681
(1999). 0022-3166 Google Scholar
R. S. Strobach,
S. K. Anderson,
D. C. Doll, and
Q. S. Ringenberg,
“The value of the physical-examination in the diagnosis of anemia—correlation of the physical findings and the hemoglobin concentration,”
Arch. Intern Med., 148 831
–832
(1988). 0003-9926 Google Scholar
O. L. Hung,
N. S. Kwon,
A. E. Cole,
G. R. Dacpano,
T. Wu,
W. K. Chiang, and
L. R. Goldfrank,
“Evaluation of the physician’s ability to recognize the presence or absence of anemia, fever, and jaundice,”
Acad. Emerg. Med., 7 146
–156
(2000). 1069-6563 Google Scholar
A. R. Kent,
S. H. Elsing, and
R. L. Hebert,
“Conjunctival vasculature in the assessment of anemia,”
Ophthalmology, 107 274
–277
(2000). 0161-6420 Google Scholar
C. I. Sanchez-Carillo,
T. J. Ramirez-Sanchez,
M. Zambrana-Castaneda, and
B. J. Selwyn,
“Test of a noninvasive instrument for measuring hemoglobin,”
Int. J. Technol. Assess Health Care, 5 659
–667
(1989). 0266-4623 Google Scholar
N. I. Shapiro,
M. Stumpf,
N. Chiota,
M. Resciniti,
J. Nicolet, and
J. Ufberg,
“A standardized conjunctiva pallor tool predicts anemia,”
Acad. Emerg. Med., 11 478
(2004). 1069-6563 Google Scholar
K. Ernsting,
S. Suner, and
G. D. Jay,
“Use of digital imaging of conjunctiva to predict hemoglobin concentration,”
Acad. Emerg. Med., 8 528
–529
(2001). 1069-6563 Google Scholar
S. S. Charschan and
B. A. Rockwell,
“Update on ANSI Z136.1,”
J. Laser Appl., 11 243
–247
(1999). 1042-346X Google Scholar
D. M. Haaland and
E. V. Thomas,
“Partial least-squares methods for spectral analyses. 1. Relation to other quantitative calibration methods and the extraction of qualitative information,”
Anal. Chem., 60 1193
–1202
(1988). https://doi.org/10.1021/ac00162a020 0003-2700 Google Scholar
D. M. Haaland and
E. V. Thomas,
“Partial least-squares methods for spectral analyses. 2. Application to simulated and glass spectral data,”
Anal. Chem., 60 1202
–1208
(1988). 0003-2700 Google Scholar
W. G. Zijlstra,
A. Buursma, and
O. W. van Assendelft, Visible and Near Infrared Absorption Spectra of Human and Animal Hemoglobin,
(2000) Google Scholar
W. G. Sijlstra,
A. Buursma, and
W. P. Meeuwsen-van der Roest,
“Absorption spectra of human fetal and adult oxyhemoglobin, de-oxyhemoglobin, carboxyhemoglobin, and methemoglobin,”
Clin. Chem., 37 1633
–1638
(1991). 0009-9147 Google Scholar
J. M. Bland and
D. G. Altman,
“Statistical-methods for assessing agreement between 2 methods of clinical measurement,”
Lancet, 1 307
–310
(1986). https://doi.org/10.1016/S0140-6736(86)90837-8 0140-6736 Google Scholar
|


