|
|
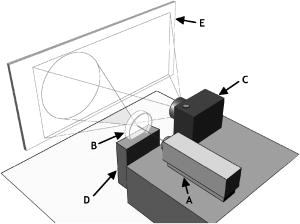
1.IntroductionThe identification of bacterial pathogens in a rapid and specific manner is important for applications in biodetection, especially in reducing food-poisoning incidents or counteracting bioterrorism. Conventional identification of bacterial pathogens usually takes 24 to 48 h following the growth of bacteria on an agar plate or in a culture broth, owing to the extent of biochemical or molecular testing required for confirming the identity of the culture. When time and speed are of vital importance, these methods are not sufficient and should be accompanied by rapid prescreening methods, which would provide preliminary results immediately. Hence, forward light-scattering technology was used in the present research as a novel method for identification of bacterial colonies on agar plates without the need for sample processing or preparation. The colonies analyzed were formed by strains belonging to the genus Listeria, a Gram-positive intracellular pathogen. This genus is comprised of six species: L. monocytogenes, L. innocua, L. ivanovii, L. seeligeri, L. welshimeri, and L. grayi. The pathogenic species are L. monocytogenes (in humans) and L. ivanovii (in animals); all the rest are considered nonpathogenic.1 The scatter patterns obtained from colonies formed by different species and strains of Listeria show noticeable visual differences. In this study, we describe the development and demonstration of an efficient feature extraction system, based on orthogonal Zernike moments, which is capable of quantifying the differences in bacterial scatterograms. The use of moments and functions polynomials has previously been associated with pattern recognition,2, 3 image normalization,4 measure of image focus,5 and character recognition in computer-vision applications.6, 7 To the best of our knowledge, the only successful use of these moments for classification of biological images is in the area of location proteomics.8, 9, 10 The advantages of the quantitative approach in this research are reproducibility, objectivity, robustness, and reliability of measurements and analysis. The identification of bacterial scatterograms was performed via shape analysis implemented using digital image-processing techniques. The process involved three major steps: image preprocessing (mainly image enhancement; e.g., adaptive histogram equalization), feature extraction utilizing Zernike moments (extraction of “best” distinguishable/distinctive properties of the objects/patterns), and discrimination and classification. 2.Methods and Algorithms2.1.Bacterial Colony PreparationThe bacterial strains used for this study were L. monocytogenes ATCC19113, L. innocua ATCC33090, L. ivanovii ATCC11919, L. welshimeri ATCC35897 (obtained from ATCC, Manassas, Virginia), L. grayi LM89, L. grayi LM37, L. ivanovii V12, L. ivanovii V199 (obtained from VICAM, Watertown, Massachusetts), L. monocytogenes F4393, L. innocua F4248 (obtained from USDHHS Centers for Disease Control and Prevention, Atlanta, Georgia), L. monocytogenes LCDC81-861, L. innocua C3-3(L), L. ivanovii LA29, L. welshimeri 105(2) to 2(L) (obtained from United States Department of Agriculture (USDA) Agricultural Research Service, Washington, DC), L. monocytogenes GG8, L. seeligeri LA15, L. seeligeri SE31 (obtained from Purdue Department of Food Science culture collection), and L. innocua NCTC11288 (obtained from Dr. T. Chakraborty, University of Giessen, Germany). The bacterial cultures were serially diluted in sterile 20-mM phosphate buffered saline (PBS), pH 7.4, so that the dilutions would produce about 30 to 50 colonies per plate. The dilutions were evenly distributed on the surface of brain heart infusion (BHI) agar plates in duplicate and were incubated at for 18 to or until the colony reached 1.8 to in diameter. The thickness of the colony (along the optical axis) was measured from the surface profile data obtained by a laser triangulation probe (Microtrak II Laser Displacement Sensor System, MTI Instruments Incorporated, Albany, New York), and was typically around 0.3 to . 2.2.Laser ScatterometerThe scatterometer system was built on an optical breadboard for precise and stable positioning of the optical components. The system included the following major components: a laser diode of 635-nm wavelength (1-mW power); an - moving stage holding the laser; a Petri-dish holder; a detection screen; and a digital camera (Fig. 1 ). The laser, the Petri-dish holder, and the detection screen were placed sequentially on the optical path ( axis) of the laser beam. The distance from the laser to the Petri-dish holder was , and the distance from the Petri-dish holder to the detecting plane was . The laser generated a collimated beam of light on the order of in diameter (at the 1/e2 irradiance points) that was directed through the center of the bacterial colony, and through the substrate of bacterial agar medium. A portion of the incident light was backscattered from the substrate interfaces and from the bacterial colony, and some was absorbed by the colony. A fraction of the laser beam was also transmitted unscattered through the substrate and through the bacterial colony. Finally, another portion of the incident beam was scattered by the colony in the forward direction (at relatively small angles to the transmitted laser beam). The forward-scattered light and the transmitted light formed the scatter patterns on the detection screen ( . white board). A digital camera located in the same plane as the Petri-dish holder imaged the scatter patterns. 2.3.Moment Invariants as FeaturesFeatures represent scalar properties of imaged objects. In many cases, a small number of features are not sufficient for capturing enough information about an object. Features like area, perimeter, compactness, and Fourier descriptors11 are too simplistic with their limitations (e.g., requirement of clear and closed boundaries), especially for many biological images, and therefore more complex features (e.g., geometric and Zernike moment invariants) found usage ranging from character and face recognition in computer vision to image registration. 2, 7, 12, 13, 14, 15, 16, 17, 18, 19 In general, moment invariants are tools to quantify the boundary and content characteristics (e.g., shape, pattern) in an image (and hence an object). Desirable properties of moment invariants are orthogonality (orthogonal features will have less redundancy of the image content), low sensitivity to noise (the lower the order of moment, the less sensitive the moment is to noise), low computation complexity (the calculation of features should be efficient enough for real-time applications), good retrieval accuracy (moments can be used to reconstruct the original image), high information content (more information exists about the fine details of an image in higher-order moments), and invariance under photometric (intensity changes) and geometric transformations (e.g., affine transformation, which includes scaling, rotation, translation, etc.). Appropriate selection of various features to be used for object recognition is one of the key factors in the overall success or failure of the identification and differentiation processes. Selection among features encompasses tradeoffs between their desired properties. For example, a higher order of moment invariant provides more sensitivity but also makes the features more susceptible to noise. Therefore, feature reduction can be performed to select the most distinctive features. Feature reduction can be divided into two categories: feature selection, in which features carrying the most information are picked out through some selection scheme, and feature recombination, in which some features are combined (e.g., with different weights) into a new (independent) feature. 2.4.Zernike Moments and Zernike Moment InvariantsFor a 2-D continuous function , moments have the general form where is a polynomial in and with powers and , respectively. Zernike moments are represented by a set of complex polynomials, which form a complete orthogonal set over the interior of a circle (i.e., ): , where is the length of a vector from the origin to an pixel, is the angle between vector and the axis in the counterclockwise direction, is a non-negative integer, is less than or equal to subject to the constraint that - be an even number, and is the radial polynomial:Note that . These polynomials are orthogonal and satisfy (in 1–D) Hence (asterisk indicates conjugate of a complex number) in 2–D,A Zernike moment 12, 13, 14, 15, 19 of order with repetition for a continuous image function that vanishes outside the unit circle is defined byFor a digital image, the integrals are replaced by summations:Examples of 2-D Zernike radial polynomials are plotted in Fig. 2 . Zernike moments are the projections of the image function onto these orthogonal basis functions. Therefore, if an image has intensity values that are well correlated with the intensity values of one of these polynomials with a specific and , the corresponding Zernike moment value is maximized and the distinctive power of this specific Zernike moment invariant reaches its peak.Fig. 2Graphical representation of radial Zernike polynomials in 2-D (image size pixels), and their magnitudes: (a) real part ; (b) imaginary part ; (c) magnitude ; (d) real part ; (e) imaginary part ; and (f) magnitude . The larger the difference, the more oscillations are present in the shape. Features used in this study are the magnitudes of Zernike polynomials. One may note that the values of the magnitudes do not change when arbitrary rotations are applied. 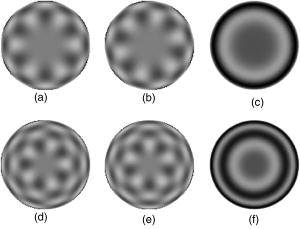 Application of Zernike moments to the analysis of bacterial scatterograms requires rotational invariance, i.e., their values should not change when arbitrary rotations are applied to the analyzed shapes. Consider a rotation of an image through an angle . If the rotated image is denoted by , the relationship between the original and rotated images in the same polar coordinates is . The Zernike moment expression can be mapped from the plane into polar coordinates by changing the variables in the double integral as12 where denotes the Jacobian of the transformation and is the determinant of the matrix.12 Here, where and , the Jacobian becomes . Hence,The Zernike moment of the rotated image in the same coordinates isBy a change of variable ,This analysis shows that under rotation, the argument (orientation angle) of the Zernike moments changes but their magnitude remains unchanged. Therefore, the magnitudes of Zernike moments can be used as invariant features. When is set to an even number, the total number of Zernike moment invariants (with 0 or positive ) up to 'th order is . To compute the Zernike moments of a given image, the center of the image is taken as the origin, and pixel coordinates are mapped to the range of the unit circle. Those pixels falling outside the unit circle are not used. An alternative method of calculating Zernike moments is to use a square-to-circular image transformation.15 Both methods—the unit circle, and the square-to-circular image transformation—were used for Zernike moment calculations presented in this work.3.Implementation and Results3.1.Image Collection and ProcessingBacterial colonies with a diameter of approximately 1.8 to and a thickness of around 0.3 to (measured along the optical axis) were analyzed using the laser scatterometer. To provide a quantitative and reproducible mathematical description of the patterns, resulting in capability of discrimination and classification, Zernike moment invariants were used. The circular and mostly symmetric shapes of the observed scatterograms suggested the choice of Zernike moment invariants over other types of moments and their invariants (e.g., Legendre). Briefly, the original images ( pixels) were cropped to pixels by keeping the center of the circularly shaped scatter patterns in the geometric center of the image and selecting a rectangle around it. The centering of the patterns was necessary, since Zernike moments in the form utilized for the purpose of this project were not translation invariant. The automated centering process used zero- and first-order geometric moments for finding the centroid of the pattern. After adaptive histogram equalization (adapthisteq function in Matlab) was performed on the cropped grayscale images of the scatter patterns, Zernike moment invariants of up to 20th order were calculated. The resultant 120 features describing each image were used as inputs for the analysis procedure. The order of Zernike moment-based features was high enough to include not only low-frequency shape information, but also high-frequency features (details) of the light-scatter patterns. Feature reduction via linear discriminant analysis (LDA) and principal component analysis (PCA) was performed to plot the data in 2-D and visualize clusters, representing different bacterial colonies. After the calculation of principal components, hierarchical clustering was performed to verify the feasibility of automated discrimination of bacterial species and strains. Simple classification was performed using linear discriminant analysis (LDA), partial least squares (PLS), and neural networks (NNs).20 Feature reduction, clustering, classification, and plotting were executed using JMP Statistical Discovery software (SAS Institute Incorporated, Cary, North Carolina). 3.2.ResultsApproximately 2000 scatter patterns were collected for the present study. In general, scatter patterns of bacterial colonies were point symmetric and composed of a number of diffraction rings. The point-symmetric characteristic was expected, since the bacterial colonies analyzed were symmetric (dome shaped) and the incident laser beam was pointed at the centers of the colonies. In the majority of scatterograms, a spot at the center of the pattern was observed. However, this spot was absent in some strains, or appeared diffuse in some others. The size and sharpness of the central spot varied in scatterograms obtained from different strains. Typically, at least one ring surrounding the central spot was observed; for some strains there were two, three, or more rings. The size, thickness, sharpness, and intensity of the ring(s) varied. A diffuse pattern around the innermost ring was observed in some scatterograms. In some other images, radial spokes were present outside the innermost ring. The intensity of the whole scatter pattern also varied from strain to strain. Representative images of some analyzed strains are shown in Fig. 3 . Fig. 3Representative images of scatterograms produced by six different Listeria strains from six species [(a) L. grayi LM37, (b) L. innocua C3-3(L), (c) L. ivanovii V12, (d) L. monocytogenes GG8, (e) L. seeligeri SE21, and (f) L. welshimeri 105(2)-2L]. The pathogenic species are L. monocytogenes (in humans) and L. ivanovii (in animals); all the rest are considered nonpathogenic. L. monocytogenes and L. innocua are known to be closely related phylogenetically, and the scatterograms produced by these two bacterial species are indeed the most similar visually. 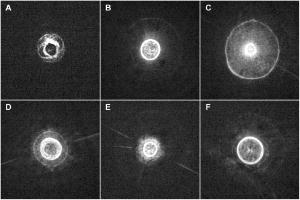 For the purpose of this work, three sets of Zernike moment-based features extracted from the bacterial scatterograms were analyzed. In the initial analysis, a single strain of bacteria was chosen to represent the species. From the available images of that strain, 9 to 20 measurements were selected at random. 120 feature vectors were extracted from each of these images. Using the first five principal components of the feature vectors, we were able to separate each of the species (L. monocytogenes, L. innocua, L. ivanovii, L. grayi, L. seeligeri, and L. welshimeri) by performing hierarchical clustering using Ward's distance (Fig. 4 ). One may note that although L. monocytogenes and L. innocua are known to be phylogenetically related,21 the scatterograms produced by colonies of the two strains of L. monocytogenes and L. innocua used in this experiment were clearly distinguishable on the PCA plot (Fig. 5 ). Fig. 4Hierarchical clustering of bacterial scatter patterns represented on a dendrogram. The vertical axis is made up of the first five principal components describing bacterial statterograms, and the horizontal axis represents the clusters formed at each step of the clustering procedure. Links (similarities) between objects are shown as U-shaped lines, where the length of the U arms corresponds to the distance. The clustering was performed using Ward's method, where objects and clusters are merged when the increase in within-group variance was less than it would have been if any of the two linked clusters were joined with other existing clusters. Symbols represent six different strains of Listeria belonging to six species: L. grayi LM37, L. seeligeri LA15, L. welshimeri ATCC35897, L. monocytogenes ATCC19113, L. innocua F4248, L. ivanovii V199. Numbers represent identified clusters of patterns. Note that identified clusters coincide with the groups of colonies from different strains.  Fig. 5Scatter pattern of six strains of Listeria visualized in principal components plot. Symbols represent the same six strains of Listeria as in Fig. 4. Cluster numbers represent sets of patterns identified using the hierarchical clustering method.  To explore further the possibility of discriminating among closely related species, we analyzed a more complex set of data (68 observations) containing three different strains of L. monocytogenes and three different strains of L. innocua. The hierarchical clustering separated the analyzed strains modestly well, although some errors were noted (Figs. 6 and 7 ). Observations of L. innocua ATCC33090 and L. innocua C3-3(L) were assigned to the same cluster. Most importantly, some scatterograms of L. innocua C3-3(L) (a nonpathogenic strain of Listeria) were assigned to the cluster containing L. monocytogenes GG8 (a pathogenic strain). In the next and last step, a simple classification task was attempted. 12 batches of samples for each of 15 different strains [L. monocytogenes ATCC19113, L. monocytogenes F4393, L. monocytogenes LCDC81-861, L. grayi LM37, L. grayi LM89, L. seeligeri LA15, L. seeligeri SE31, L. innocua NCTC 11288, L. innocua C3-3(L), L. innocua F4248, L. ivanovii ATCC11919, L. ivanovii LA29, L. ivanovii V12, L. welshimeri 105(2)-2(L), and L. welshimeri ATCC35897] were randomly chosen, forming a 180-observation set. Our training/testing method involved using 165 observations as a training set and the remaining 15 observations as a test set. 12 different combinations of the training set and test set were utilized. The dataset was divided into three categories representing nonpathogenic Listeria, bacteria potentially pathogenic to humans (three strains of L. monocytogenes), and bacteria potentially pathogenic to animals (three strains of L. ivanovii). Classifications based on LDA, PLS, and standard (not backpropagated) NNs with three hidden nodes were performed in the environment of the JMP 5.1 package. Fig. 6Hierarchical clustering of scatter patterns produced by bacteria belonging to L. innocua and L. monocytogenes species. Symbols represent six different strains of Listeria: L. innocua ATCC33090, L. monocytogenes ATCC19113, L. monocytogenes GG8, L. monocytogenes F4393, L. innocua C3-3(L), L. innocua F4248. Numbers represent identified clusters of patterns. Note that some patterns belonging to different strains were assigned to the same cluster.  Fig. 7Principal components plot illustrating hierarchical clustering of scatter patterns produced by colonies of the same six strains of Listeria as in Fig. 6. 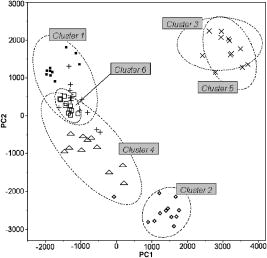 For the purpose of classifying observations by PLS and NNs, a dummy matrix in which each element is either zero or one, depending on the pathogenicity of the sample, encoded the information about the bacteria. The dummy matrix can be interpreted as a pseudo-probability matrix representing the probability that a scatterogram identifies a colony that belongs to a particular class. Regression vectors generated from training spectra were used to predict the pseudo-probabilities associated with a given test sample. As with a real probability, the sum of the pseudo-probability scores for all of the possible classes is equal to one. However, unlike true probabilities, individual pseudo-probability scores may be either larger than one or smaller than zero.22 The results of the classification are summarized in Table 1 . Table 1Classification rates for human-pathogenic, animal-pathogenic, and nonpathogenic Listeria strains. Classification results of different methods using 180 images from 15 different Listeria strains.
The example presented in Fig. 8 shows 30 scatter patterns classified using the NNs system via the procedure described before. The classified patterns are shown as crosses, while the patterns belonging to the training set are shown as filled squares. 84% of patterns are correctly classified in the example presented. Misclassified patterns are shown as filled circles. Fig. 8An example of bacterial pattern classification using a neural networks approach. 30 scatter patterns belonging to 15 different strains representing three groups of bacteria (pathogenic for humans (black, top-right corner of the plot), for animals (dark gray, left side of the plot), and nonpathogenic (light gray, bottom-right corner of the plot)) were classified. The data points are visualized in a canonical plot. The classified patterns are shown as crosses, while the patterns belonging to the training set are shown as filled squares. 84% of patterns are classified correctly in the example presented. Misclassified patterns are shown as filled circles.  4.Discussion and Future WorkThe Zernike moment-based feature extraction tool provided up to 120 features for every scatterogram collected. Use of these features either directly or after dimensionality reduction via PCA allowed discrimination and classification of bacterial colonies forming the scatter patterns. Patterns produced by strains belonging to different species of Listeria were easily distinguished by a hierarchical clustering method, as demonstrated in Fig. 4. Discrimination of patterns in a mixture of observations belonging to L. innocua and L. monocytogenes posed a much more difficult problem, as indicated by only a modest discrimination success achieved by hierarchical clustering (Fig. 6). This is not surprising, since phylogenetic studies have shown that L. monocytogenes and L. innocua are closely related.23 To confirm whether features extracted from scatterograms could be employed for more complex purposes, such as automated pattern recognition, a simple classification procedure using three classes (nonpathogen, human pathogen, and animal pathogen) was performed. Classification success varied greatly and depended on the method used. Although 98% of nonpathogenic species were correctly classified with the PLS-based approach, as many as one third (33%) of pathogenic colonies were misclassified. NNs-based classification gave better results, correctly classifying 75% of human pathogens and 88% of animal pathogens. It is important to note that the classification tools used were relatively simple (LDA, PLS, not-backpropagated NNs), and there was no additional penalty for false negatives (i.e., classifying pathogenic strain as a nonpathogenic). On the basis of the performed clustering and classification, Zernike moment-based features extraction applied to the problem of bacterial scatterograms represents a promising approach to identification of colony-forming bacterial pathogens. The most important problem faced during the analysis was the “curse of dimensionality” resulting from the large number of features and low number of observations (scatterograms) per strain. This is the reason that for the purposes of classification, bacterial scatterograms were divided into just three categories, and prediction of actual strain on the basis of an observed scatterogram was not attempted at this point. The limited success of classification might have arisen from two fundamental limitations in the design of orthogonal Zernike moments: 1. the discrete approximation of the continuous integrals (i.e., scatterograms are discrete images and therefore the analyses must be done using discretized orthogonal moments18, 19), and 2. the transformation of the Cartesian scatterogram coordinate system into the domain of the radial polynomials.16, 19, 24 The discrete approximation of integrals affected the analytical properties that the moment functions were intended to satisfy, such as invariance and orthogonality. The coordinate-space normalization increased the computational complexity. Discrete orthogonal moments (formed from discrete orthogonal polynomials as basis functions) may eliminate the need for numerical approximations and will exactly satisfy the orthogonality property in the image coordinate space. In contrast to Zernike moments, inherently orthogonal and discrete radial Chebyshev moments,24 based on discrete radial Chebyshev polynomials, eliminate the discretization errors. Radial Chebyshev moments are also rotation invariant and can be viewed as discrete counterparts of Zernike moments. Therefore, the application of Chebyshev moments may improve the overall performance of analysis. The authors are currently designing a new pattern classification system utilizing the capabilities of radial Chebyshev moment invariants. Improvement in feature extraction may result in a method capable of fast quantitative characterization of bacterial colonies not only for purposes of biodetection, but also to provide information about changes in bacterial colonies over time or as the result of exposure to various environmental factors. We are currently modifying the new setup and developing an improved version of the pattern recognition system to eliminate some of the shortcomings and problems encountered in this research. 5.ConclusionsThis study explores analysis of scatter patterns produced by colonies of different Listeria species and strains when irradiated with red laser light. The interaction between the laser beam and the bacterial colony occurs at multiple length scales. At the microscopic end there is scattering by individual bacteria, and at the larger end there is a macroscale lens-like refraction of the beam by the curved free surface of the colony. The nominal 1-mm beam diameter of the diode laser happens to be convenient, since no focusing optics is required and the topography illuminated by the beam allows substantial discrimination among the bacteria we studied. While we have not yet carefully explored the lower limit of beam size, we are convinced that smaller beam sizes could provide similar sensitivity and should be explored. Smaller beam sizes imply that smaller regions of the colonies are required, which in turn means that shorter incubation times would be possible. The presented method offers a novel, unique approach to the problem of differentiating bacterial colonies by using moment invariants to describe the scatter patterns. Although the complexity of calculating moment invariants for large images is high, given the speed of current computers it is not prohibitive. Moment invariants are robust, and their use has been successfully demonstrated in a number of computer-vision applications. Taking into consideration the fact that providing precise taxonomy of bacterial patterns would not be required during rapid prescreening, we can conclude that the results obtained for automated determination of pathogenicity are encouraging and strongly suggest the feasibility of image-based biodetection systems. AcknowledgmentsWe thank Purdue University Cytometry Laboratories staff for their fruitful discussions. In particular, we thank Valery Patsekin for discussions on multivariate analysis. We also acknowledge Songling Guo for his contributions to the initial setup and data collection. Arun Bhunia would like to acknowledge support through a cooperative agreement with the Agricultural Research Service of the United States Department of Agriculture project number 1935-42000-035 and the Center for Food Safety and Engineering at Purdue University. ReferencesA. J. Roberts and
M. Wiedmann,
“Pathogen, host and environmental factors contributing to the pathogenesis of listeriosis,”
Cell. Mol. Life Sci., 60 904
–918
(2003). 1420-682X Google Scholar
M. Hu,
“Visual-pattern recognition by moment invariants,”
IRE Trans. Inf. Theory, 8 179
–187
(1962). 0096-1000 Google Scholar
M. R. Teague,
“Image-analysis via the general-theory of moments,”
J. Opt. Soc. Am., 70 920
–930
(1980). 0030-3941 Google Scholar
Y. S. Abumostafa and
D. Psaltis,
“Image normalization by complex moments,”
IEEE Trans. Pattern Anal. Mach. Intell., 7 46
–55
(1985). 0162-8828 Google Scholar
P. T. Yap and
P. Raveendran,
“Image focus measure based on Chebyshev moments,”
IEE Proc. Vision Image Signal Process., 151 128
–136
(2004). https://doi.org/10.1049/ip-vis:20040332 1350-245X Google Scholar
L. C. Glenn and
H. Mehdi,
“Optical character recognition by the method of moments,”
Comput. Vis. Graph. Image Process., 39 291
–310
(1987). 0734-189X Google Scholar
J. Flusser and
T. Suk,
“Affine moment invariants—a new tool for character-recognition,”
Pattern Recogn. Lett., 15 433
–436
(1994). https://doi.org/10.1016/0167-8655(94)90092-2 0167-8655 Google Scholar
M. V. Boland and
R. F. Murphy,
“A neural network classifier capable of recognizing the patterns of all major subcellular structures in fluorescence microscope images of cells,”
Bioinformatics, 17 1213
–1223
(2001). https://doi.org/10.1093/bioinformatics/17.12.1213 1367-4803 Google Scholar
R. F. Murphy,
“Cytomics and location proteomics: Automated interpretation of subcellular patterns in fluorescence microscope images,”
Cytometry, 67A 1
–3
(2005). 0196-4763 Google Scholar
R. F. Murphy,
“Location proteomics: a systems approach to subcellular location,”
Biochem. Soc. Trans., 33 535
–538
(2005). 0300-5127 Google Scholar
R. C. Gonzalez,
R. E. Woods, and
S. L. Eddins, Digital Image Processing Using MATLAB,
(2004) Google Scholar
A. Khotanzad and
Y. H. Hong,
“Invariant image recognition by Zernike moments,”
IEEE Trans. Pattern Anal. Mach. Intell., 12 489
–497
(1990). https://doi.org/10.1109/34.55109 0162-8828 Google Scholar
S. X. Liao and
M. Pawlak,
“On the accuracy of Zernike moments for image analysis,”
IEEE Trans. Pattern Anal. Mach. Intell., 20 1358
–1364
(1998). https://doi.org/10.1109/34.735809 0162-8828 Google Scholar
R. Mukundan and
K. R. Ramakrishnan,
“Fast computation of Legendre and Zernike moments,”
Pattern Recogn., 28 1433
–1442
(1995). https://doi.org/10.1016/0031-3203(95)00011-N 0031-3203 Google Scholar
R. Mukundan and
K. R. Ramakrishnan, Moment Functions in Image Analysis—Theory and Applications,
(1998) Google Scholar
R. Mukundan,
S. H. Ong, and
P. A. Lee,
“Image analysis by Tchebichef moments,”
IEEE Trans. Image Process., 10 1357
–1364
(2001). https://doi.org/10.1109/83.941859 1057-7149 Google Scholar
R. Mukundan,
“Some computational aspects of discrete orthonormal moments,”
IEEE Trans. Image Process., 13 1055
–1059
(2004). 1057-7149 Google Scholar
C. H. Teh and
R. T. Chin,
“On digital approximation of moment invariants,”
Comput. Vis. Graph. Image Process., 33 318
–326
(1986). 0734-189X Google Scholar
C. H. Teh and
R. T. Chin,
“On image-analysis by the methods of moments,”
IEEE Trans. Pattern Anal. Mach. Intell., 10 496
–513
(1988). https://doi.org/10.1109/34.3913 0162-8828 Google Scholar
R. O. Duda,
P. E. Hart, and
D. G. Stork, Pattern Classification,
(2001) Google Scholar
B. Sallen,
A. Rajoharison,
S. Desvarenne,
F. Quinn, and
C. Mabilat,
“Comparative analysis of 16S and 23S rRNA sequences of Listeria species,”
Int. J. Syst. Bacteriol., 46 669
–674
(1996). 0020-7713 Google Scholar
C. Ortiz,
D. M. Zhang,
Y. Xie,
V. J. Davisson, and
D. Ben Amotz,
“Identification of insulin variants using Raman spectroscopy,”
Anal. Biochem., 332 245
–252
(2004). 0003-2697 Google Scholar
S. Cai and
M. Wiedmann,
“Characterization of the prfA virulence gene cluster insertion site in non-hemolytic Listeria spp.: Probing the evolution of the Listeria virulence gene island,”
Curr. Microbiol., 43 271
–277
(2001). 0343-8651 Google Scholar
R. Mukundan,
“A new class of rotational invariants using discrete orthogonal moments,”
Proc. 6th IASTED Conf. Signal Image Process., 80
–84
(2004) Google Scholar
|
||||||||||||||||||||||||||||||||||||||||||||||||||||||||