
|
|
1.IntroductionThe fluorescence lifetime is the average time that a fluorescent molecule spends in the excited state before a photon is emitted. The sensitivity of the fluorescence lifetime to environmental factors has been exploited in the development and use of quantitative and efficient biosensors for a wide range of cellular biochemical events.1, 2 Since its introduction in the early 1990s, fluorescence lifetime imaging microscopy (FLIM) has been used, for instance, for the quantitative and robust imaging of pH, ion concentrations, and oxygen content in living cells and tissues. Importantly, FLIM affords the mapping of protein-protein interactions in (living) cells3 by imaging using Förster resonance energy transfer (FRET). FRET is the process of radiationless transfer of energy from a fluorescent donor molecule to an acceptor chromophore.4, 5 Its usefulness is derived from the fact that FRET occurs on the distance scale of protein-protein interactions . The availability of visible fluorescent protein (VFP)-tagged molecules, genetically encoded antibody recognition tags (e.g., Myc, HA) for immuno-cytochemistry, and small peptide sequences targeted by synthetic fluorescent compounds (e.g., FlAsH, ReAsH, SnapTag) extended the possibilities for imaging protein-protein interactions by FRET.2 However, the high cost and specialized know-how required for its acquisition and operation has limited the spreading of FLIM instrumentation, even in laboratories that routinely use fluorescence microscopy.6 More recently, the use and value of FLIM for diagnostic applications,7 histology,8 and screening9 was demonstrated. The availability of cost-effective and user-friendly systems is a requirement for the further acceptance and spreading of this technique. All-solid-state technologies resulted in compact and inexpensive illumination sources. Laser and light emitting diodes are bright and fast enough to be used for microscopy and for time-resolved fluorescence detection. Frequency-domain (FD) FLIM requires a periodic excitation pattern; this can be realized by using pulsed excitation or sinusoidal modulated excitation light. FD lifetime detection relies on the measurement of the (phase) delay and/or demodulation of the fluorescence signal relative to the excitation light. Fluorescence lifetimes of most organic fluorescent dyes and fluorescent proteins are on the order of a few nanoseconds. All-solid-state detectors for wide-field FLIM of nanosecond lifetime fluorochromes are, however, currently not available. We recently reported on the optical characterization of a charge-coupled device/complementary metal-oxide semiconductor (CCD/CMOS) hybrid lock-in imager, originally developed for real time full-field 3-D vision10 for fluorescence detection and lifetime sensing.11 In the current work, we show the integration of this camera in wide-field FLIM, compare the performances of this all-solid-state technology with a state of the art multichannel-plate (MCP) FLIM system, and demonstrate the application for FRET and cellular imaging, and high-throughput screening. Furthermore, we established the fully parallel operation of this new sensor that can acquire a lifetime image by a single exposure and can operate at a video rate. This was possible by the use of a rapid lifetime determination (RLD) algorithm that only requires two phase images.12 The combination of the fully parallel acquisition and the frequency-domain RLD allows the acquisition of lifetime images with a high photon economy. These developments demonstrate that a FLIM system that is both affordable and simple to operate can be realized. The availability of such a system would be a turning point in the spreading of FLIM technology for the life and medical sciences, including large scale screening of drug and protein-protein interaction. 2.Methods2.1.Swiss Ranger-2 Camera and Lock-In ImagingThe lock-in imager is the SwissRanger SR-2 camera whose sensor has pixels with an optical fill factor of and is manufactured in combined CMOS/buried-channel charge-coupled device (BCCD) semiconductor technology.10 Each lock-in pixel has two independent charge-storage sites (Fig. 1 ). The front-illuminated CCD has a quantum efficiency of , 50, and 70% at 500, 600, and , respectively. Fig. 1Pixel architecture, mode of operation, and camera design of the SR-2 imager. (a) Each lock-in pixel has a photosensitive region that converts photons into photoelectrons. (c) Electrons are integrated in two different storage areas, depending on the phase of the signal applied to the integration gates. Here, the integration is performed at opposite phases. This allows the cross-correlation and read-out (at the sensing-nodes) of two images, acquired simultaneously, and at opposite phases. (b) All the electronics for FLIM are embedded in a compact design.  The CCD gate potentials are modulated in opposite phase configuration at a frequency of . This allows the simultaneous phase-dependent accumulation of photogenerated electron hole pairs in the two separate storage sites (Fig. 1). Thus, the camera records two images in parallel at opposite phases. The electronics of the SR-2 generate both the modulation signals for the gate control and for the external light source. The SR-2 is controlled by a computer via a USB connection. In its original implementation, an infrared LED array integrated within the camera housing is used as the modulated light source. For the application to FLIM, the LED array and its electronic drivers were removed to reduce the generation of heat inside the camera housing. The original camera computes the distance map on-chip. For our purposes, the SR-2 firmware was modified to allow the read-out of the two phase-dependent images. However, the camera firmware can be modified to directly provide lifetime images. We previously operated the SR-2 with an external delay unit for the collection of four or eight phase images.11 In the present work, the SR-2 was operated without the external delay unit, and only two and four phase images were recorded. 2.2.MicroscopyThe SR-2 was connected to the binocular port of a fully automated Axiovert200M (Carl Zeiss Jena GmbH, Jena, Germany) microscope by a C-mount adapter. This microscope is part of an in-house developed frequency-domain MCP-based FLIM system, described elsewhere.13 A 405-nm solid-state Compass laser (Coherent Incorporated, Santa Clara, California) was used for excitation of the turbo-sapphire (TS) green fluorescent protein (GFP). LED excitation was achieved using a NSPB500S LED (Nichia Corporation, Japan) with emission peaking around in combination with a bandpass filter (AHF Analysentechnik AG, Tübingen, Germany). The driving signal for the modulation of the light sources was obtained directly from the lock-in imager. Further details of the system can be found elsewhere.11 The fluorescence was observed through a optical bandpass filter and a 495-nm dichroic mirror (AHF Analysentechnik AG). Cy3 images were collected using a filter cube fitted with a excitation filter, a long-pass dichroic mirror, and a emission filter. The MCP-FD-FLIM was controlled by in-house developed software programmed in the DaVis imaging suite (Lavision GmbH, Göttingen, DL). The acquisition and analysis of the data by the SR-2 was controlled by Matlab (Mathworks, Natick, Massachusetts). Both the SR-2- and MCP-based FLIM systems were calibrated on a pixel-by-pixel basis by imaging a fluorescent slide (Chroma Corporation) with a lifetime of . The emission of the slide overlaps with the emission of the fluorophores used in this study. 2.3.Data AnalysisThe SR-2 enables the simultaneous acquisition of two images at relative phases of 0 and , respectively. Subsequently, two additional images at relative phases of 90 and , respectively, can be acquired by using the SR-2 internal delay line. The same acquisition protocol was used for the MCP detection, but in this case all the images were acquired sequentially. The four-phase data stack was processed by the analysis of the zero and first Fourier coefficient14 to estimate the phase delay and the demodulation of the fluorescence emission: where and are calibration parameters that represent the phase and the modulation of a zero-lifetime reference sample. The zero-lifetime characteristics can also be retrieved by imaging of a fluorescent sample with a known lifetime. This method yields two apparent lifetime estimations that are related to the phase delay and the demodulation1, 14 introduced by the finite lifetime of the fluorochrome:Here, is the circular frequency of the intensity-modulated light source. The two lifetime estimations are related to each other. Their difference depends on the occurrence of lifetime heterogeneity.13The two-phase acquisition data were analyzed by the rapid lifetime determination algorithm (RLD).12 This algorithm allows calculation of the demodulation factor: The phase bias between the light source and the detector was partially compensated by the internal SR-2 delay line. The residual phase bias, measured using the four-phase acquisition protocol, was compensated for by the software used to calculate the lifetimes. The two-phase acquisition offers a rapid FLIM analysis, but discards information on the possible multiexponential decay of the fluorochrome.All data analysis was carried out with the Matlab toolbox “ImFluo,” whose lifetime functions are available from http://www.quantitative-microscopy.org/pub/sr2.html. Dark images were acquired prior to lifetime detection. This background was subtracted from each following acquisition. 2.4.Sample PreparationThe fluorescent beads were prepared by covalent conjugation of recombinantly produced TS-GFP to CnBr-activated Sepharose beads (Amersham Biosciences Europe GmbH, Freiburg, Germany) as previously described.11 A FRET experiment was performed on TS-GFP beads conjugated with Cy3 monofunctional reactive dye (Amersham Bioscience Europe GmbH) according to a previously published protocol.13 These beads exhibit FRET efficiencies of about 30% (as detected by the MCP-based FD-FLIM). CHO cells were transfected with a pcDNA3.1 expression vector encoding the TS-GFP using the Effectene transfection reagent according to the protocol supplied by the manufacturer (Qiagen, Hilden, Germany). EGFP and TS-GFP were purified from bacteria using the N-terminal hexahisitidine tag encoded by the vector, by immobilized metal affinity chromatography on Talon resin (Promega) according to the protocol supplied by the manufacturer. Rhodamine 6G (R6G) was from Sigma-Aldrich (Deisenhofen, Germany). 3.Results3.1.Time-of-Flight Detection and Fluorescence Lifetime SensingThe SwissRanger SR-2 camera used in this study was originally developed and optimized for the recording of distance maps. This sensor estimates distances by illuminating a scene with intensity-modulated light and measuring the (phase) delay of the reflected photons (time-of-flight detection). With increasing object distance, longer delays will be detected in its reflected light [Fig. 2a ]. At every pixel, the lock-in imager computes the average intensity of the scene [Fig. 2b], the relative phase delays [Fig. 2c] of the reflected light field, and a distance map [Fig. 2d]. The camera is able to measure picosecond time lags. Therefore, the timing resolution is sufficient to measure the nanosecond fluorescence lifetime of biologically relevant fluorochromes such as fluorescent proteins. Fig. 2Time-of-flight imaging: (a) and (d) The original application of the lock-in imager, time-of-flight detection for real-time 3-D vision is shown. (b) A lock-in imager produces an intensity map of the imaged scene and (c) the phase delays of the reflected illumination light. From these values, (d) the distances of the objects in the 3-D scene are calculated. (a) Increasing distance gives rise to a longer delay of the reflected light.  Fundamentally, FLIM differs from time-of-flight imaging only in the measurement of fluorescence emission instead of reflected light. The emitted fluorescence exhibits a lifetime-dependent phase delay and demodulation. With increasing fluorochrome lifetime, the relative emission (phase) delay and the attenuation of its modulation depth increase1, 6, 14 [Fig. 2a]. 3.2.Comparison with State of the Art TechnologyThe 20-MHz modulation frequency of the SR-2 is sufficiently high to obtain reliable lifetime images of fluorochromes with nanosecond lifetimes.11, 15 To investigate the advantages of the lock-in imager further, we compared images of the same sample, imaged by the SR-2 and by the conventional multichannel-plate-based detection system (Fig. 3 ). The test sample, a turbo-sapphire green fluorescent protein (TS-GFP) conjugated bead, was illuminated by a 405-nm laser diode and images were acquired with 20-ms integration time. The lifetimes determined from the phase delay and demodulation of the fluorescence signal were similar for both the MCP and the lock-in imager. The slight systematic mismatch between the MCP and SR-2 estimation can be explained by the initial phase bias dependence that can occur as a result of aliasing when less than five phase steps are imaged.16 Fig. 3Comparison between lifetime detection using an MCP-based imager (left column) and the novel CCD/CMOS lock-in imager (right column). A TS-GFP-conjugated bead was imaged by both systems (first row). The phase (second row) and modulation (third row) lifetimes (see also distributions) are quantitatively detected by both systems. Phase lifetimes: for the SR-2 and for the MCP. Modulation lifetimes: for the SR-2 and for the MCP; the presence of an edge artifact in the SR-2 image is caused by the dark current of the SR-2. The fluorescence intensities show the typical “chicken-wire” artifact that can be observed with the multichannel plate (first row, left panel).  A major advantage of this lock-in imager-based FLIM is the possibility to capture two modulated images at opposite phases simultaneously (see Secs. 2.1, 2.3). In contrast, the MCP method requires the sequential acquisition of images at different relative phases. Figure 3 shows images derived from four sequential intensity images by the MCP. The SR-2 acquires these images with only two exposures. Furthermore, the MCP exhibits artifacts in the detected intensities due to the fiber coupling between the MCP and the CCD that are not present in the image obtained by the SR-2. 3.3.Application to Cellular and Förster Resonance Energy Transfer Imaging, and High-Throughput High-Content ScreeningThe feasibility of lifetime imaging on a biologically relevant sample using the SR-2 technology was investigated by imaging CHO cells transiently expressing TS-GFP [Fig. 4a ]. The sample was illuminated by a modulated 405-nm laser diode, the exposure time was , and four phases were acquired during two sequential exposures of the SR-2. The TS-GFP phase-lifetime estimation was found to be . The lifetime map is somewhat noisy, but it clearly demonstrates the feasibility of all solid-state FLIM on single cells. Similarly, a TS-GFP fluorescent bead labeled with the Cy3 was imaged [Fig 4b]. The Cy3 fluorophore was photobleached by prolonged exposure with the HbO lamp and a partially closed aperture field iris of the microscope (see circle and arrow). The decreased Cy3 fluorescence emission correlates to an increase of the TS-GFP emission by the inhibition of FRET through the local depletion of the acceptor chromophore. Accordingly, the (phase) lifetime image and corresponding histogram revealed a lifetime reduction of TS-GFP of due to FRET with the Cy3 fluorophore. Fig. 4Cellular and FRET imaging: (a) Already the present prototype can retrieve correct lifetimes from biologically relevant samples. CHO cells were transfected with TS-GFP, whose phase lifetime estimation was measured to be . The scale bar indicates . (b) Donor (TS-GFP) and acceptor (Cy3) fluorescence images of a TS-GFP/Cy3 bead acquired by the SR-2. The Cy3 fluorophore was photobleached on the area marked by the circle and the arrows. In this region, the SR-2 measured a (phase) lifetime of higher (see histogram and arrow) than the lifetime of the TS-GFP in the regions where the acceptor was not photobleached . This corresponds to a FRET efficiency of . The scale bar indicates . 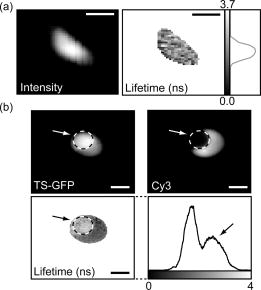 Subsequently, we integrated the SR-2 in a screening platform. The microscope employed here is capable of operating in an unsupervised fashion as required for high-throughput screening (HTS). This automated MCP-based FLIM system (described elsewhere) is capable of acquiring and analyzing FLIM images per day. Figure 5 shows a (phase) lifetime image of an array of a group of wells in a 1536 multiwell plate. The wells were filled with enhanced green fluorescent protein (EGFP, bottom row), rhodamine-6G (R6G, top row), and a mixture of EGFP and rhodamine-6G (middle row). Here, the specimen was excited using a modulated 470-nm LED light source, and four phase measurements were acquired during two sequential acquisitions with an exposure time of each. The lifetime images demonstrate that the SR-2 produces accurate and reproducible fluorescence lifetime contrast. The coefficients of variation ranged from 2 to 5%, and the results are in good agreement with those using MCP-based lifetime imaging. Fig. 5Application of cost-effective FLIM instrumentation to high-throughput screening. A section of a 1536-well plate, loaded with different concentrations of purified EGFP protein, rhodamine6G, and mixtures of both, is shown. The phase lifetime estimation histograms of the samples are given at the respective position along the rows and columns. The histograms at the top show the contrast between different lifetimes. The histograms on the side demonstrate the reproducibility of the measurements for identical wells. 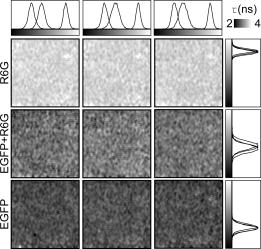 The integration of the SR-2 technology into an automated microscopy platform results in a valuable tool for high-content high-throughput screening. 3.4.Video-Rate Single-Shot Fluorescence Lifetime Imaging MicroscopyThe simultaneous acquisition of two images at opposite phases by the SR-2 is a perfect match for the rapid lifetime determination algorithm.12 The RLD algorithm is a robust and fast method for calculating fluorescence lifetimes that requires only two images recorded at opposite phases. Importantly, since both phase images are acquired simultaneously, the lifetimes recorded with the SR-2 are not affected by motion artifacts or photobleaching. In contrast, MCP-based FLIM requires the sequential acquisition of images at different phases. Therefore, samples exhibiting movements that are faster than the acquisition time will suffer from motion-induced lifetime artifacts. In addition, the sequential recording of the phase images makes the MCP-based FLIM approach sensitive to photobleaching, in particular when only two phase images are recorded as required for the RLD. At present, it is impossible to correct for bleaching artifacts when only two images are required. The SR-2 technique does not suffer from these drawbacks because of its parallel acquisition. Therefore, the SR-2 allows optimal use of the RLD algorithm. The combination allows a direct visualization of lifetime images even at video-rate imaging. Figure 6 shows images of TS fluorescent beads acquired at a frame rate of . The exposure time was and the 405-nm laser diode was used for the excitation. Every second frame is shown. The computer-assisted microscope stage translated the sample along one axis at about (Fig. 6, middle column) or (right column). The imaging of a stationary bead (left column) is shown as a control. This example clearly shows that the lifetime images are unaffected by sample motion, and that this technology is well suited for FLIM of fast processes. Another interesting application is the detection of rare events. Here, a sample is continuously scanned, searching for a single cell that is undergoing a specific event, e.g., a protein-protein interaction that occurs at a specific point in the cell cycle. The latter application would require the on-line calculation (and displaying) of the fluorescence lifetime images. This could be easily realized using the RLD algorithm in combination with the on-chip computational capabilities of the camera. Fig. 6FLIM at video rate : turbo-sapphire beads are imaged with the rapid lifetime determination algorithm, while the microscope stage translates the sample at different indicated speeds (0, 250, and from left to right columns) in the downward direction. Three frames out of six are shown (upper panel) and overlaid (bottom panel) to show the sample trajectory.  3.5.Photon EconomyThe photon economy of different FLIM techniques can be expressed by a figure of merit (F). Here, we employ a figure of merit defined as the ratio of the relative error in the lifetime determination and the square root of the number of detected photons.15, 17 When pulsed excitation is used, time-correlated single photon counting and lock-in detection can achieve an F value of 1. This is the lower limit; higher values imply a decreased performance. In frequency domain FLIM, the figure of merit strongly depends on the ratio of the fluorescence lifetime and the modulation frequency of the excitation light. The optimum modulation frequencies for fluorescence lifetime detection are and for the phase and modulation lifetime estimation,15 respectively, which corresponds to and for a fluorescence lifetime of , typical for fluorescent proteins. The operation of the SR-2 at is therefore sufficient for lifetime sensing of nanosecond fluorophores, although the quality of the modulation lifetime estimation is not optimal. However, the technology employed in the SR-2 has already been tested at modulation frequencies of about , and different electronics could provide a modulation frequency of up to .18 Operating the detector at such frequencies would further improve the sensitivity, in particular for short lifetimes. Interestingly, with the combination of the rapid lifetime determination algorithm and the parallel acquisition of the SR-2, it is possible to realize a very high photon economy. No photons are lost, as is the case for the sequential acquisition of the different phase-dependent images. The RLD photon economy was not previously characterized. We estimated by Monte-Carlo simulations F values of and when using a sinusoidal wave or pulsed excitation, respectively. The use of the RLD algorithm in combination with the parallel acquisition of the camera therefore requires the collection of to 8-fold less photons compared with the standard multiple-phase and sequential acquisition. 4.DiscussionA number of applications in the biomedical sciences await the development of simpler, faster, and more cost-effective fluorescence lifetime imaging (FLIM) instrumentation. The contrast enhancement given by fluorescence lifetimes is increasingly used for the delineation of different tissues and metabolic states in biopsies, and for the detection of malignant modifications in situ. These applications are based on the sensitivity of the fluorescence lifetime for the molecular environment of the imaged fluorophore(s). Both the intrinsic fluorescence of conventional histological dyes and tissue auto-fluorescence can be exploited for this purpose. For lifetime measurements to be applicable to point-of-care operation or routine histopathological investigations, it is essential that a portable turnkey solution becomes available. The superior quality of lifetime imaging data in the application of the increasingly popular analytical technique of Förster resonance energy transfer is generally recognized. In the life sciences, FRET is used to probe protein-protein interactions, protein conformational changes, and, through the development of specific biosensors, the biochemical activity of proteins. Current lifetime imaging instrumentation is based on either scanning microscopy or multichannel-plate imager-based microscopy. These implementations are affordable by specialized laboratories or centralized imaging service centers, but are not likely to allow wide-scale adoption as routine imaging application due to their high cost, and the required specialized skills needed for their operation and maintenance. For the same reason, the screening community has not yet fully adopted FLIM as a tool for the increasingly popular imaging-based screening applications on cells. Recent advances in solid-state technology19 enable the use of inexpensive laser diodes and light emitting diodes as directly modulated light sources for FLIM. 20, 21, 22, 23 In terms of the breadth of application and the speed of acquisition, wide-field lifetime sensing represents the most suitable form of FLIM. The limiting factor here is the necessity of an MCP intensifier. Although the temporal resolution of MCPs is very high, their spatial resolution is relatively low; they can introduce “chicken-wire” artifacts caused by the fiber optic coupling between the CCD and the intensifier, and they introduce significant noise in the measurements.24 Furthermore, MCPs are relatively expensive, can be easily damaged by high light intensities, and require elaborate electronics to be operated. For these reasons, routine use of FLIM by a larger user community would greatly benefit from a robust solid-state detector as an alternative to modulated intensifiers. In the recent past, pioneering work was carried out24, 25, 26 using directly modulated CCD cameras for direct FLIM without an MCP-based image intensifier. However, here images were shown recorded at comparatively low modulation frequencies (up to ). These low modulation frequencies reduce the sensitivity for nanosecond fluorescence lifetime imaging. According to one of the authors, this technology can be improved to work at much higher modulation frequencies.27 The technology used in the SR-2 offers a high photon economy, high acquisition speed, insensitivity toward photobleaching and motion artifacts, reduced cost, and increased simplicity. The current SR-2, however, has some drawbacks that limit its immediate adoption for high sensitivity cellular lifetime imaging. The optical performances of the SR-2 for fluorescence detection in biological microscopy are inherently suboptimal, given its original purpose. A new design of the chip, the use of a microlens array, and dedicated coupling optics that we are currently developing will provide a -fold improvement. New electronics and active cooling of the chip will lower the noise level and increase the modulation frequency range up to with acquisition speeds up to 30 to 50 frames per second. Together with the -fold higher photon economy of the parallel acquisition and RLD, the system will reach a detection level that could outperform the current MCP-based detection systems. Therefore, we believe that all-solid-state technologies will soon be ready to substitute MCPs for lifetime detection. Importantly, this would result in a significant reduction of costs and the required know-how necessary to operate a FLIM system. Such video-rate real-time systems would have the typical optical sensitivity of CMOS/CCD imagers, or pixel resolution, working in a variable frequency range between 5 and , containing all necessary electronics on-board, and be easy to use as a standard camera even by nonspecialist operators. The combination of such a device with laser diodes would cost less than . The use of LEDs would make all-solid-state FLIM even more affordable. The combination of lock-in imaging with wide-field detection and a Nipkow-disk confocal, a programmable array28 microscope or a system based on structured illumination,29 could provide low-cost sectioning FLIM systems. Furthermore, a lock-in imager can be used as a detector in a scanning microscope30 to achieve fast time-resolved spectral imaging. Finally, we would like to note that the entire all-solid-state FLIM detection system has a footprint of less than . The small size, low cost, and ease of operation make it particularly suited for screening and medical diagnostics instrumentation, for instance in imaging plate readers and endoscopes.7 FD detection combined with subnanosecond-pulsed excitation results in a very high photon economy, and it can operate at high emission intensities. Therefore, this combination results in short acquisition times. We believe that wide-field FD-FLIM based on lock-in images and solid-state excitation sources is at present the best choice for high-throughput and high-content FLIM. The application of such FLIM systems in the life sciences and high-throughput screening will stimulate the quantitative study of protein-protein interactions, and enhance drug screening and medical diagnostics applications. AcknowledgmentsWe thank Yehudi Levine for the critical reading of the manuscript, and Dirk Lange for his valuable technical assistance. This investigation was supported by the DFG Research Center Molecular Physiology of the Brain. The European Neuroscience Institute Göttingen (ENI-G) is jointly funded by the Göttingen University Medical School, the Max-Planck-Society and Schering AG. ReferencesJ. R. Lakowicz, Principles of Fluorescence Spectroscopy, Kluwer Academic/Plenum Publishers, New York (1999). Google Scholar
G. Bunt and
F. S. Wouters,
“Visualization of molecular activities inside living cells with fluorescent labels,”
Int. Rev. Cytol., 237 205
–277
(2004). 0074-7696 Google Scholar
F. S. Wouters,
P. J. Verveer, and
P. I. Bastiaens,
“Imaging biochemistry inside cells,”
Trends Cell Biol., 11 203
–211
(2001). https://doi.org/10.1016/S0962-8924(01)01982-1 0962-8924 Google Scholar
R. M. Clegg,
“Fluorescence resonance energy transfer,”
Fluorescence Imaging Spectroscopy and Microscopy, 180
–252 John Wiley and Sons, London (1996). Google Scholar
E. A. Jares-Erijman and
T. M. Jovin,
“FRET imaging,”
Nat. Biotechnol., 21 1387
–1395
(2003). https://doi.org/10.1038/nbt896 1087-0156 Google Scholar
A. Esposito and
F. S. Wouters,
“Fluorescence lifetime imaging microscopy,”
Current Protocols in Cell Biology, 1
–30 John Wiley and Sons, London (2004). Google Scholar
J. Requejo-Isidro,
J. McGinty,
I. Munro,
D. S. Elson,
N. P. Galletly,
M. J. Lever,
M. A. A. Neil,
G. W. H. Stamp,
P. M. W. French,
P. A. Kellett,
J. D. Hares, and
A. K. L. Dymoke-Bradshaw,
“High-speed wide-field time-gated endoscopic fluorescence-lifetime imaging,”
Opt. Lett., 29 2249
–2251
(2004). https://doi.org/10.1364/OL.29.002249 0146-9592 Google Scholar
K. W. Eliceiri,
C. H. Fan,
G. E. Lyons, and
J. G. White,
“Analysis of histology specimens using lifetime multiphoton microscopy,”
J. Biomed. Opt., 8
(3), 376
–380
(2003). https://doi.org/10.1117/1.1584053 1083-3668 Google Scholar
S. Turconi,
R. P. Bingham,
U. Haupts, and
A. J. Pope,
“Developments in fluorescence lifetime-based analysis for ultra-HTS,”
Drug Discovery Today, 6 S27
–S39
(2001). 1359-6446 Google Scholar
T. Oggier,
M. Lehmann,
R. Kaufmann,
M. Schweizer,
M. Richter,
P. Metzler,
G. Lang,
F. Lustenberger, and
N. Blanc,
“An all-solid-state optical range camera for 3D real-time imaging with sub-centimeter depth resolution (SwissRanger),”
Proc. SPIE, 5249 534
–545
(2004). 0277-786X Google Scholar
A. Esposito,
T. Oggier,
H. C. Gerritsen,
F. Lustenberger, and
F. S. Wouters,
“All-solid-state lock-in imaging for wide-field fluorescence lifetime sensing,”
Opt. Express, 13
(24), 9812
–9821
(2005). https://doi.org/10.1364/OPEX.13.009812 1094-4087 Google Scholar
P. C. Schneider and
R. M. Clegg,
“Rapid acquisition, analysis, and display of fluorescence lifetime-resolved images for real-time applications,”
Rev. Sci. Instrum., 68 4107
–4119
(1997). https://doi.org/10.1063/1.1148354 0034-6748 Google Scholar
A. Esposito,
H. C. Gerritsen, and
F. S. Wouters,
“Fluorescence lifetime heterogeneity resolution in the frequency-domain by lifetime moments analysis (LiMA),”
Biophys. J., 89 4286
–4299
(2005). 0006-3495 Google Scholar
R. M. Clegg and
P. C. Schneider,
“Fluorescence lifetime-resolved imaging microscopy: a general description of lifetime-resolved imaging measurements,”
Fluorescence Microscopy and Fluorescent Probes, 15
–33 Plenum Press, New York (1996). Google Scholar
J. Philip and
K. Carlsson,
“Theoretical investigation of the signal-to-noise ratio in fluorescence lifetime imaging,”
J. Opt. Soc. Am. A, 20 368
–379
(2003). 0740-3232 Google Scholar
E. B. van Munster, T. W. Gadella Jr,
“phiFLIM: a new method to avoid aliasing in frequency-domain fluorescence lifetime imaging microscopy,”
J. Microsc., 213 29
–38
(2004). 0022-2720 Google Scholar
A. Draaijer,
R. Sanders, and
H. C. Gerritsen,
“Fluorescence lifetime imaging, a new tool in confocal microscopy,”
Handbook of Biological Confocal Microscopy, 491
–505 Plenum Press, New York (1995). Google Scholar
R. Lange,
P. Seitz,
A. Biber, and
R. Schwarte,
“Time-of-flight range imaging with a custom solid state image sensor,”
Proc. SPIE, 3823 180
–191
(1999). 0277-786X Google Scholar
S. Landgraf,
“Application of semiconductor light sources for investigations of photochemical reactions,”
Spectrochim. Acta, Part A, 57 2029
–2048
(2001). 0584-8539 Google Scholar
D. S. Elson,
J. Siegel,
S. E. D. Webb,
S. Lévêque-Fort,
M. J. Lever,
P. M. W. French,
K. Lauritsen,
M. Wahl, and
R. Erdmann,
“Fluorescence lifetime system for microscopy and multiwell plate imaging with a blue picosecond diode laser,”
Opt. Lett., 27 1409
–1411
(2002). 0146-9592 Google Scholar
W. J. O’Hagan,
M. McKenna,
D. C. Sherrington,
O. J. Rolinski, and
D. J. S. Birch,
“MHz LED source for nanosecond fluorescence sensing,”
Meas. Sci. Technol., 13 84
–91
(2002). https://doi.org/10.1088/0957-0233/13/1/311 0957-0233 Google Scholar
P. Harms,
J. Sipior,
N. Ram,
G. M. Carter, and
G. Rao,
“Low cost phase-modulation measurements of nanosecond fluorescence lifetimes using a lock-in amplifier,”
Rev. Sci. Instrum., 70 1535
–1539
(1999). https://doi.org/10.1063/1.1149620 0034-6748 Google Scholar
P. Herman,
B. P. Maliwal,
H. J. Lin, and
J. R. Lakowicz,
“Frequency-domain fluorescence microscopy with the LED as a light source,”
J. Microsc., 203 176
–181
(2001). https://doi.org/10.1046/j.1365-2818.2001.00943.x 0022-2720 Google Scholar
A. C. Mitchell,
J. E. Wall,
J. G. Murray, and
C. G. Morgan,
“Direct modulation of the effective sensitivity of a CCD detector: a new approach to time-resolved fluorescence imaging,”
J. Microsc., 206 225
–232
(2002). 0022-2720 Google Scholar
A. C. Mitchell,
J. E. Wall,
J. G. Murray, and
C. G. Morgan,
“Measurement of nanosecond time-resolved fluorescence with a directly gated interline CCD camera,”
J. Microsc., 206 233
–238
(2002). 0022-2720 Google Scholar
K. Nishikata,
Y. Kimura,
Y. Takai,
T. Ikuta, and
R. Shimizu,
“Real-time lock-in imaging by a newly developed high-speed image-processing charged coupled device video camera,”
Rev. Sci. Instrum., 74 1393
–1396
(2003). https://doi.org/10.1063/1.1542663 0034-6748 Google Scholar
C. G. Morgan,
(2006) Google Scholar
Q. S. Hanley,
P. J. Verveer, and
T. M. Jovin,
“Spectral imaging in a programmable array microscope by hadamard transform fluorescence spectroscopy,”
Appl. Spectrosc., 53 1
–10
(1999). 0003-7028 Google Scholar
M. A. A. Neil, A. Squire,
R. Juskaitis,
P. I. Bastiaens, and
T. Wilson,
“Wide-field optically sectioning fluorescence microscopy with laser illumination,”
J. Microsc., 197 1
–4
(2000). https://doi.org/10.1046/j.1365-2818.2000.00656.x 0022-2720 Google Scholar
P. L. T. M. Frederix,
M. A. H. Asselbergs,
W. G. J. H. van Sark,
D. J. van den Heuvel,
W. Hamelink,
E. L. de Beer, and
H. C. Gerritsen,
“High sensitivity spectrograph for use in fluorescence microscopy,”
Appl. Spectrosc., 55 1005
–1012
(2001). 0003-7028 Google Scholar
|


