|
|
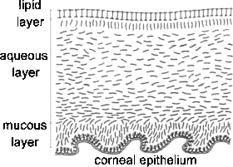
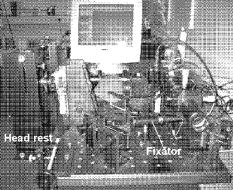
1.IntroductionIn the last few years there has been increased interest in the quality of tear film. It is the most anterior optical surface of the eye covering the cornea, and the most powerful. Recent results of noninvasive studies using optical coherence tomography (OCT)1 and examination of reflection spectra2 suggest that human tear film is approximately thick. At present, there exists two theories about the architecture of tear film. According to Holly and Lemp,3 it is a three-layered structure (Fig. 1 ) consisting of mucin, water, and the most external lipids. Each of these layers plays an important role in the vision process. The tear film ensures sharp vision by creating a smooth optical surface on an irregular corneal surface. It cleanses, nourishes, and wets the epithelium and provides immune protection against infections.4, 5 At present, there is evidence that the two inner layers (water and mucin) create a gel mixture with increased concentration of mucins from the epithelium to the surface.4 With each involuntary, periodic blink approximately every 5 to a new portion of tears is distributed over the surface of the eye.5 Increasing the blinking rate thickens the lipid layer,6 which reduces evaporation of the aqueous layer from the ocular surface.4, 7, 8 The eyelids ensure reconstruction of the tear film and remove any impurities.9, 10 Evaporation becomes a big problem with almost all ocular surface diseases, and also contact lens wearing.7 If the eye is opened for a sufficiently long time or the patient suffers from dry-eye syndrome, the tear film layer becomes thin, leading to break-ups in what appears to be a random distribution. Three models have been proposed to explain the phenomenon of tear break-up. One model relates break-up to diffusion of the lipid layer to the mucous, which locally changes the character of the mucous layer to a hydrophobic one, causing in consequence dry spots.9 Another hypothesis links the irregularity of the corneal epithelium and the instability of the mucous layer to the appearance of dry areas.11 A third, recent model describes the break-up as a complex process of several aspects of the tear film and eyelids.12 The time from the blink to the moment when the first break-up appears is called tear break-up time (TBUT). Watching television for a long time or working at a computer, often in air-conditioned offices, cause us to blink rarely. This means that the distribution of the tear film over the eye’s surface could be disturbed. This problem also affects the contact lens wearer, as well as patients after refractive and cataract surgery.13 Dry-eye symptoms affect over one-third of computer users.14 It is estimated that the prevalence of dry-eye syndrome may increase in the future.15 Evaluation of tear film quality over the cornea is therefore important, and so far many different methods have been proposed. The most popular methods such as the Schirmer test, rose Bengal, and fluorescein staining are invasive and characterized by poor repeatability. With the emergence of a new, noninvasive method for assessing the tear film surface, significant differences between invasive TBUT and noninvasive tear break-up time (NITBUT) have been revealed.16 Nichols and Nichols17 proved that there is a correlation between NITBUT and the thickness of the lipid layer. The tear film is not stable over time. Just after a blink of the eye, the surface of tears is irregular and it takes about one18 to seven seconds19 for healthy eyes to evenly spread the tears over the cornea. This time has been termed the “build-up time.”19 What is interesting is that the movement of tear particles appears to be upward, as observed by Owens and Philips.20 The spreading velocity20 and the time necessaryto reach optimal surface regularity measured by fast videokeratography19 depends on tear film quality, and videokeratography has been proposed as a noninvasive method for assessment of NITBUT. In their study, Iskander and Collins21 applied high-speed videokeratography, proving that the technique can be used for estimating tear film build-up and TBUT. Since the surface of the precorneal tear film is the most refractive optical surface of the eye, each local irregularity produces changes in the surface optical power. Dynamic wavefront aberrometry has been also used for noninvasive evaluation of tear film quality.22 Goto and 23 sought to find a correlation between changes in the mapping of the corneal topograph and TBUT. One of the methods that enable precise measurements of the tear film in a noninvasive way is interferometry. This method was first described by Doane.24 Licznerski, Kasprzat, and Kowalik proposed using shearing and a Twyman-Green interferometer, which permits noninvasive in-vivo estimation of changes in the tear film surface by measuring the lipid layer.25, 26 A different version of the previously mentioned shearing interferometer was proposed by Dubra, Paterson, and Dainty.27 They examined the tear topography analyzing the intensity and wrapped phase maps extracted from the lateral shearing interferogram. This work describes the lateral shearing interferometer (LSI), which has been modified in comparison to the previous one. The purpose of the work was to present some examples of recorded interferograms and describe the method of quantitative evaluation, which enables us to illustrate dynamic changes of the tear film surface over time. We present results for a healthy eye, an eye of a contact lens wearer, and an eye suffering from dry-eye syndrome, and also demonstrate how artificial tears affect the tear film changing the interference image. 2.Method of AnalysisInterference fringes carry information about the distribution of the tear film surface over the cornea. Smooth, almost parallel, horizontal fringes are observed if the tear film is continuous and evenly distributed over the cornea. However, when the eyelids are opened for a long time or if the person suffers from dry-eye syndrome, tear film break-ups appear. The break-up causes distortion of the wavefront reflected from the tear film and therefore local deterioration of the interference fringes. To assess the degree of the tear film deterioration, the fast Fourier transform (FFT) of the fringe pattern was applied. In Fig. 2 , examples of modeling results of numerically calculated FFT and differences in the Fourier spectrum for smooth [Fig. 2a] and disturbed [Fig. 2d] fringe patterns are presented. It is clear that the first order of the FFT of the nondisturbed, regular structure of interference fringes is less well spread than that of disturbed fringes. Figures 2b and 2e give the square of the absolute value of the fringe FFT in the first order. 3-D views of the considered magnitude spectra are shown in Figs. 2c and 2f. Fig. 2Modeling results of the fast Fourier transform (FFT) of (a) smooth and (d) disturbed fringes. Their Fourier spectra are presented in (b) and (e), respectively. By the white square, the first order of the Fourier spectrum is marked. The pixel of the highest intensity in is the middle. (c) and (f) are 3-D representations of the spectrum.  The second moment of the first order of the estimated spectrum was applied to evaluate the degree of the fringe deterioration.25 The first order of the Fourier spectrum corresponds with the space frequency of interference fringes. For horizontal, smooth fringes, the value of is small. The value increases if irregularities appear in the fringe pattern. A mask is centered around the local maximum of the first order of the FFT to calculate the of the spectrum. The mask is selected in the following way: first, the pixel of the highest intensity in the first order of the FFT is numerically found; then the center of the mask is located at this pixel. The indexing of pixels surrounding this highest intensity point in the certain radius is presented in Fig. 3a . The pixels inside the mask numbered with indices and are taken for computation of the second moment . The second , which is calculated by using the square mask, is called . Fig. 3(a) Square and (b) and (c) circular masks imposed on the first order of the FFT. The pixels inside the mask are taken for calculation of the second moment . The respective parameters are called , , and . 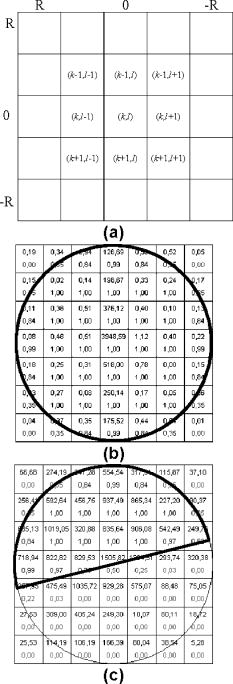 We introduced four different parameters for evaluating the tear film stability. Apart from the square mask, a round mask and the half circle mask are proposed as well [Figs. 3b and 3c].28 The circle is cut from the square mask. Its diameter is the same as that of the side of the square mask. In our case, equals 15 pixels. The pixels placed on the circle line are taken into account in the calculation, with weights as a ratio of the pixel area inside the circle to the whole area of the pixel. The third mask has the shape of a half-circle, which is positioned opposite to the zero order of the FFT. The half-circle mask for the marked FFT spectrum shown in Fig. 2e is presented in Fig. 3c. The numbers in every square (pixel) indicate the value of intensity of a given pixel (upper number) and its weight (lower number). The for the square , circle , and half-circle mask is calculated as follows: where is the weight of each pixel; is the calculated intensity in a given pixel as module of the real and imaginary part of Fourier spectrumand is the distance from the center of the mask, .For the parameter value, for every pixel. In the case of parallel, smooth interference fringes, the value of this parameter is lower than in the case of irregular fringes. As revealed in our previous calculations and analysis, parameters and show very similar dependency in time.28 Since parameter describes the plot in first a few seconds more meticulously than , in the present study we chose the parameter as a representative to describe quality of fringes. In some interferograms, fringes are fairly smooth but curved, contrary to interferograms with relatively straight but distorted fringes. Values of could be the same in both cases. However, calculated distribution of the first-order FFT is much more irregular in the second case. To distinguish between such cases, we proposed a fourth parameter, , which can be treated as a measure of the first-order spectrum irregularity As is discussed later, the increases also with an interference fringe deterioration, but its characteristics differ from those of the first three parameters.3.Experimental SetupA schematic drawing of the modified version of the LSI is presented in Fig. 4a . Figure 5 is a photograph of the used LSI. The source of the monochromatic and coherent light is a laser, with a nominal light power of . The laser beam intensity is reduced by applying a gray filter (GF) and electromechanical shutter (Sh) synchronized with a charge-coupled device (CCD) camera. The time exposure adjusted by the shutter driver amounts to and the exposure is repeated every . Laser pulses are directed to the expanding collimator to obtain a planar wavefront. This wavefront of diam reaches the beamsplitter (BS). The majority of light passes through this element and does not take part in the measurement; the beamsplitter therefore also reduces the intensity of the light falling on the eye. The resulting power of the laser beam lighting the cornea amounts to about . The diameter of the lighted surface of the cornea is about . The study was granted ethics clearance from Sahlgren University Hospital. The light power meets the international standards. Fig. 4The schematic: (a) shearing interferometer setup: BS is the beamsplitter, GF is the gray filter, M are mirrors, Ob is the objective, Sh is the shutter, and W is the optical wedge. (b) Optical system for fixating the eye: BS is the beamsplitter, is the focal length, L is the lens, LED is the diode, M is the mirror, and Ob is the objective.  The shearing element in the setup is a wedge (W), whose internal angle amounts to about . It ensures lateral and angular shifts between the fallen wavefronts. The effect of interference of two wavefronts, one reflected from the front, the other from the rear surface of the W, is stored on computer memory. Stabilization of the examined eye is important in the setup. The eye has to meet one important condition: the center of the central corneal curvature should be placed in the focus of the objective (Ob). All kinds of head rests applied in any devices used in ophthalmologic practice are too weak to assume the proper head stabilization necessary for interferometric measurements. Therefore the special rigid head rest has been designed for the patient to rest his or her forehead and chin against; in addition, the forehead is stabilized by two side wings. All these elements can be moved and adapted to the individual size of every person. Furthermore, an optical system for fixating the eye is added [Fig. 4b]. The blue light-emitting diode (LED) illuminates a plate with a cross, which is located farther away than the focal distance of the objective of the additional optical system. This means that the convergent light beam falls in the focus of the objective lens (Ob). As a result, the image on the retina has the smallest size. The eye should focus in the middle of the pulsating image of the cross. In this way, we ensure that the eye is kept stable. 4.ExperimentWe have applied our method in more than 100 subjects, including 52 patients with normal eyes, 31 patients wearing different contact lenses, and 30 suffering from different irritations or eye diseases. We present here only representative examples of each group of subjects. The diagram in Fig. 6 shows that the plots of registered videos in different days even for the same healthy eye differ with each other. Our aim was to test presented parameters and find the most appropriate one, that could classify recorded fringes in the most representative way. Moreover, the calculated parameters should describe the dynamic changes of the tear film distribution during the time after blink. Limited by the computer hardware, we were able to record 20-s video sequences. Fig. 6The diagram of the parameter illustrates plots of the same healthy eye measured on different days. The polynomial approximation describes disparate behavior of the tear film.  At the beginning of the recorded video sequence, the patient is asked to blink completely and then to keep the eye open during the rest of the recording. The computer records 25 frames per second. For further image processing, a subsequence of frames with selected time intervals is pulled out. Next, the selected subsequence is prepared for routine calculations of all four parameters for every frame from this subsequence. The computer plots the diagram of parameters as a function of time. It is possible to process recorded interferograms within selected masks. Figure 7 shows three types of masks for FFT calculation. The first mask [Fig. 7a] has a dimension of , the second [Fig. 7b] has four subframes of each, while the third [Fig. 7c] has 20 subframes measuring each. The position of masks over recorded interferograms can be moved. Every square subframe in the case of the second and third mask is treated as a separate interferogram for which all four parameters are calculated. As a result, for every full frame, the maximum and minimum value of parameters for every square subframe, the average value from all squares and the standard deviation (SD) are obtained. Fig. 7Three masks for analyzing the fringe image. The interferograms are processed within masks of sizes (a) , (b) , and (c) for each square.  Results differ significantly for different kinds of masks, as shown in Fig. 8 . The dashed line is a polynomial approximation of the sixth order. The values for one square of are higher than those for divided masks. In addition, the characteristic of these plots is also different. Since the scattering of calculated points was much smaller in comparison with that in other masks, we decided to use the third mask as the most appropriate for analyzing the dynamic changes of the tear film. The point plot in this case evidently varies in time and can be well approximated by a function. There is another important reason for choosing the third, smallest mask for further calculations. By splitting the image into small squares of , we have better control over selection of the area to be analyzed. In this way, small squares that carry no valuable information can be excluded from the Fourier analysis. This concerns such squares as frames with black areas when the eye partially moved from the axis of the lens, with only part of the image covered by fringes [Fig. 7c]. To simplify the analysis, the program automatically excludes subframes without valuable information. 5.Results and DiscussionExamples of recorded fringe patterns in normal, healthy eyes, pathological eyes, and eyes of patients wearing monthly contact lenses are presented next. The diagrams placed under each sequence are plotted for the average value of two selected parameters, and , and show variations of parameters in time. Results are presented in the form of points, and the polynomial approximation is given (thick lines). We were using consecutive orders of the polynomial approximation, and for each the coefficient of matching was calculated. If the difference between for adjacent approximations was lower than 1%, the lower order was chosen. Figures 9a and 9f present a sequence of shearing interferograms recorded in the normal, healthy eye. The width of the image is about . The first given frame from the sequence is registered after the eye blink. The time interval is very short and the tear film did not have enough time to evenly spread on the corneal epithelium. Therefore, the fringes are disturbed and there are bright and dark areas in the interference image. The bright strips in the interferograms in Figs. 9a and 9b have vertical orientation. This indicates very likely movement of the eyelid. The upper eyelid was raised and could leave its motion trace. This effect, however, is very complex and needs further investigations. As can be seen, the next fringe patterns from the sequence fringes became smoother with time. One second after the blink [Fig. 9b], there were still visible disturbances, but they became smaller than those in Fig. 9a. However, after the blink, smooth parallel fringes can be observed. The interferograms illustrate the stabilizing process of the tear film. The smoothing of the tear film surface after a blink needs time, as was also described by Németh, 19 who used the term “build-up time.” Bron and Tripathi29 observed a mosaic pattern on the cornea, a structure that may influence fringe disturbances after the blink. However, this effect is likely not the only one influencing tear film instability after the blink. Fig. 9Sequence of six frames from the videorecording of a healthy, normal eye. The frames illustrate the stabilization process of the tear film in this time. The interferograms are recorded at (a) 0.24, (b) 1.04, (c) 2.04, (d) 3.44, (e) 5.84, and (f) after blink.  The dynamics of the process are presented in Fig. 10 . At the beginning, when the tear film is not yet smoothly distributed, values of parameters and are higher in comparison to values after a few seconds, when the tear film stabilizes. Even [Fig. 9f] and (Fig. 10) after the last blink, fringes are very smooth and calculated parameters have stable values. Fig. 10Variations of parameters (a) and (b) in time (seconds) for the healthy eye. The thick line is a polynomial approximation describing the distribution of the tear film after blink. 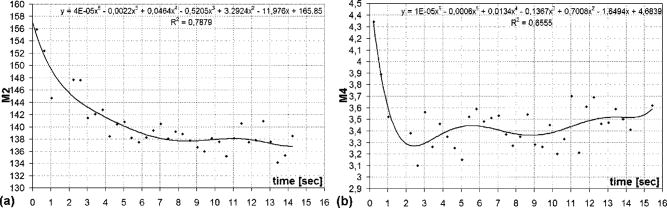 The following results were obtained for a patient with a soft, one-day (i.e., disposable) contact lens (Fig. 11 ): the difference between the tear film quality recorded in the normal eye and with the contact lens is clearly visible. In the last frame [Fig. 11c], fringes are strongly disturbed and hardly observable. At after the blink [Fig. 11a], fringes are still very regular and smooth. However, after [Fig. 11c], almost no fringes are visible. The contact lens surface is very likely to be almost dry at this time. Fig. 11Interferograms in wearers of contact lenses. Recorded at (a) 0.2, (b) 3.2, and (c) after blink. At the beginning, the fringes are smooth and regular, but they distort quickly with time.  After this measurement, the same patient applied artificial tears. As can be clearly seen, eye drops significantly improve smoothness of the tear surface in contact lens wearers (Fig. 12 ). There are differences in the time dependency of parameters and for the contact lens wearer without and with artificial tears (see Fig. 13 ). According to parameter , the tear film quality on the contact lens (black points) distinctly decreases at the beginning and then remains at the same level, while according to , the quality gradually worsens with time. This parameter seems to be more sensitive than . Analyzing the result for the contact lens with eye drops (white squares), the and do not demonstrate rapid changes in time. The smoothness of the fringes is almost stable in time. Fig. 12Interferograms in wearers of contact lenses after eye drops. Recorded at (a) 0.2, (b) 3.2, and (c) after blink. The interference fringes are smooth until the end of the recording.  Fig. 13Parameters (a) and (b) on the contact lens before and after eye drops. The polynomial approximation (thick line) illustrates the deterioration process of the tear film surface.  Figures 14 and 15 present interferograms of the eye diagnosed with dry-eye syndrome. In Fig. 14a, fringes recorded after the eye blink are smooth and parallel to each other. However, after a few seconds, fringes start to change their direction in some areas [Fig. 14b]. These areas become very evident after [Fig. 14c]. The bright line can be interpreted as a break-up. What is interesting is that the fringes are very smooth and regular, apart from the local distortion. Moreover, the break-up appears gradually, and measurements are shown with random location on the cornea. Fig. 14Interferograms in subject with the dry eye, (a) 1.24, (b) 8.68, and (c) after blink. Interference fringes are smooth and regular, but a few seconds after blink (b) a white lines are seen, where fringes change their orientation. We interpret them as a break-up. 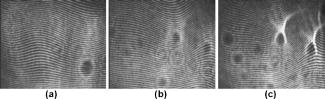 Fig. 15The same dry eye after artificial tears, (a) 1.24, (b) 8.68, and (c) after blink. Interference fringes are smooth, but after a few seconds (b) white spots appear. It is probably a break-up.  In the following experiment, the eye drops (patient applied artificial tears) and examination was repeated after . In Fig. 15, we give examples of obtained interferograms. Fringes are smooth and parallel until the end of the sequence. However, the white spot may be interpreted as a place of a future break-up [Figs. 15b and 15c]. The values of parameters and in Fig. 16 are lower for the eye after application of artificial tears. Furthermore, the diagram of illustrates deterioration of the tear layer in the dry eye over time. The value of the calculated parameter increases, while after application of eye drops the parameters have lower values. The plot of dry eye with eye drops is fairly stable and shows slight decreases following the application of eye drops. The diagram of gives us no clear information in this case, hence we cannot approximate it with one suitable function. 6.ConclusionsLateral shearing interferometry allows evaluation of the tear film surface stability in a noninvasive way with high accuracy. The FFT is used for quantitative analysis of dynamics of the tear film surface. The method has been automated and FFT calculations are carried out for sequences of frames registered during measurement. This permits plotting of changes of calculated parameters in time, and allows us to present the dynamics of tear film irregularities. Four different parameters can be calculated for description of the tear film quality. The parameter , in our opinion, describes well the quality of fringes. The calculated points are the least scattered in the case of as a general rule. The fourth parameter is an innovation. In general, it reflects changes in interference fringes other than and . By comparing interferograms of the normal eye with interferograms in the contact lens wearer and patients with dry-eye syndrome before and after application of eye drops, we can see significant differences in stability and quality of the tear film. The interferograms in the present study revealed also that applying fluorescein in the dry eye change the property of the tear film. Using the previously mentioned interferometric method, we can measure the stabilizing time in healthy eyes. Just after the eye blink, a smooth and regular structure of the interference fringes is observed against a background of bright and dark spots. The fringes go through the spots and are therefore probably not correlated with smoothness of the tear surface, but with what is under the surface, and gradually smooth out during the first 1 to after the eye blink. When the tear film stabilizes in the normal eye, the values of the and parameters decrease and become more stable. Comparison of the recorded sequences shows that the deterioration of fringes is not caused by the break-up only. The interference method is very sensitive, with any changes in the tear film layer visible in the fringe pattern. In the case of the contact lens, the fringes deteriorate almost from the beginning of the recording, and disturbed fringes in the fringe patterns and the analysis of calculated parameters give us information about fast drying of the lens. The bright lines observed on a contact lens before application of eye drops are similar to those observed in an eye with dry-eye syndrome. They are probably break-up. In the case of contact lenses and dry-eye syndrome, the degree of the tear film deterioration gradually increases with time. The break-up does not appear suddenly. AcknowledgmentsWe would like to thank Allan Rydz for help during examinations of patients and for fruitful discussions. This study was supported by grants from De Blindas Vänner in Göteborg, by the Gunnar and Mertha Bergdahl Foundation, the Göteborg Medical Foundation, and the Medical Faculty of the University of Göteborg. ReferencesJ. Wang,
D. Fang,
T. L. Simpson, and
L. Jones,
“Precorneal and pre- and postlens tear film thickness measured indirectly with optical coherence tomography,”
Invest. Ophthalmol. Visual Sci., 44 2524
–2528
(2003). 0146-0404 Google Scholar
P. E. King-Smith,
B. A. Fink,
N. Fogt,
K. K. Nichols,
R. M. Hill, and
G. S. Wilson,
“The thickness of the human precorneal tear film: evidence from reflection spectra,”
Invest. Ophthalmol. Visual Sci., 41 3348
–3359
(2000). 0146-0404 Google Scholar
F. J. Holly and
M. A. Lemp,
“Tear physiology and dry eyes,”
Ophthalmology, 22 69
–87
(1977). 0161-6420 Google Scholar
M. Rolando and
M. Zierhut,
“The ocular surface and tear film and their dysfunction in dry eye disease,”
Surv. Ophthalmol., 45 203
–209
(2001). 0039-6257 Google Scholar
K. Tsubota,
S. C. G. Tseng, and
M. L. Nordlund,
“Anatomy and physiology of the ocular surface,”
Ocular Surface Disease: Medical and Surgical Management, 9
–15 Springer-Verlag, New York (2001). Google Scholar
C. Evinger,
J. B. Bao,
A. S. Powers,
I. S. Kassem,
E. J. Schicatano,
V. M. Henriquez, and
K. R. Peshori,
“Dry eye, blinking, and blepharospasm,”
Mov Disord., 17
(Suppl. 2), 75
–78
(2002). 0855-3185 Google Scholar
W. Mathers,
“Evaporation from the ocular surface,”
Exp. Eye Res., 78 389
–394
(2004). 0014-4835 Google Scholar
J. P. Craig and
A. Tomlinson,
“Importance of the lipid layer in human tear film stability and evaporation,”
Optom. Vision Sci., 74 8
–13
(1997). 1040-5488 Google Scholar
F. J. Holly,
“Tear film physiology,”
Am. J. Optom. Physiol. Opt., 57 252
–257
(1980). 0093-7002 Google Scholar
M. G. Doane,
“Blinking and the mechanics of the lacrimal drainage system,”
Ophthalmology, 88 844
–51
(1981). 0161-6420 Google Scholar
A. Sharma and
E. Ruckenstein,
“Mechanism of tear film rupture and its implications for contact lens tolerance,”
Am. J. Optom. Physiol. Opt., 62 246
–253
(1985). 0093-7002 Google Scholar
H. Wong,
I. Fatt, and
C. Radke,
“Deposition and thinning of the human tear film,”
J. Colloid Interface Sci., 184 44
–51
(1996). https://doi.org/10.1006/jcis.1996.0595 0021-9797 Google Scholar
L. Battat,
A. Macri,
D. Dursun, and
S. C. Pflugfelder,
“Effects of laser in situ keratomileusis on tear production clearance, and the ocular surface,”
Ophthalmology, 108 1230
–1235
(2001). 0161-6420 Google Scholar
E. Goto,
“Quantification of tear interference image tear fluid surface nanotechnology,”
Cornea, 23
(Suppl. 1), 20
–24
(2004). 0277-3740 Google Scholar
H. Brewitt and
F. Sistani,
“Dry eye disease: the scale of the problem,”
Ophthalmology, 45
(Suppl. 2), 199
–202
(2001). 0161-6420 Google Scholar
P. Cho and
W. Douthwaite,
“The relation between invasive and non invasive tear break-up time,”
Optom. Vision Sci., 72 17
–22
(1995). 1040-5488 Google Scholar
J. J. Nichols and
K. K. Nichols,
“Evaluation of tear film interference patterns and measures of tear break-up time,”
Optom. Vision Sci., 79 363
–369
(2002). 1040-5488 Google Scholar
A. Tomlinson and
S. Khanal,
“Assessment of tear film dynamics quantification approach,”
Ocular Surface, 3 81
–94
(2005). Google Scholar
J. Németh,
B. Erdèlyi,
B. Csákány,
P. Gáspár,
A. Soumelidis,
F. Kahlesz, and
Z. Lang,
“High speed videokeratometric measurements of tear film build-up time,”
Invest. Ophthalmol. Visual Sci., 43 1783
–1790
(2002). 0146-0404 Google Scholar
H. Owens and
J. Philips,
“Spreading of tears after blink,”
Cornea, 20 484
–487
(2001). 0277-3740 Google Scholar
D. R. Iskander and
M. J. Collins,
“Applications of high-speed videokeratoscopy,”
Clin. Exp. Optom., 88 223
–231
(2005). 0816-4622 Google Scholar
R. Montés-Micó,
J. Alió, and
N. Charman,
“Dynamic changes in the tear film in dry eyes,”
Invest. Ophthalmol. Visual Sci., 46 1615
–1619
(2005). 0146-0404 Google Scholar
T. Goto,
X. Zheng,
S. Okamoto, and
Y. Ohashi,
“Tear film stability analysis system,”
Cornea, 23
(Suppl. 1), 65
–70
(2004). 0277-3740 Google Scholar
M. G. Doane,
“An instrument for in vivo tear film interfeometry,”
Optom. Vision Sci., 66 383
–388
(1989). 1040-5488 Google Scholar
T. Licznerski,
H. Kasprzak, and
W. Kowalik,
“Analysis of shearing interferograms of tear film using fast Fourier transforms,”
J. Biomed. Opt., 3
(1), 32
–37
(1998). https://doi.org/10.1117/1.429886 1083-3668 Google Scholar
T. Licznerski,
H. Kasprzak, and
W. Kowalik,
“Application of Twyman – Green interferometer for evaluation of in vivo breakup characteristic of the human tear film,”
J. Biomed. Opt., 4
(1), 176
–182
(1999). https://doi.org/10.1117/1.429904 1083-3668 Google Scholar
A. Dubra,
C. Paterson, and
C. Dainty,
“Double lateral shearing interferometer for the quantitative measurement of tear film topography,”
Appl. Opt., 44 1191
–1199
(2005). https://doi.org/10.1364/AO.44.001191 0003-6935 Google Scholar
D. H. Szczȩsna,
J. Jaroński,
H. T. Kasprzak, and
U. Stenevi,
“Interferometric measurements of the tear film irregularities on the human cornea,”
Proc. SPIE, 5959 47
–56
(2005). 0277-786X Google Scholar
A. J. Bron and
R. C. Tripathi,
“The anterior corneal mosaic,”
Br. J. Physiol. Opt., 25 8
–13
(1970). 0007-1218 Google Scholar
|