
|
|
1.IntroductionIn the search for new modalities for cancer treatment, photodynamic therapy (PDT) has shown promising results in terms of selectivity and efficacy.1 PDT relies on the presence of a photosensitizing agent which, once activated by light of the appropriate wavelength, generates cytotoxic species, mostly singlet oxygen and other reactive oxygen species. Tissue destruction is caused by a combination of immediate cell death and apoptosis induced by these radicals and indirect damage to the vascular system.2, 3 One commonly used photosensitizing compound is protoporphyrin IX (PPIX), generated by -aminolevulinic acid (ALA).4 ALA-mediated PDT has been successfully used in the treatment of superficial lesions in the bladder, bronchus, aerodigestive tract, and skin, e.g., for the treatment of actinic keratosis.5 In an effort to extend PDT beyond that of treating superficial lesions or thin lesions easily accessible through body cavities, several research groups have investigated interstitial light delivery via optical fibers.6, 7, 8, 9 In addition to facilitating the treatment of thick and deeply lying tumors, interstitial light delivery via multiple fibers also allows for the treatment of irregularly shaped lesions while sparing normal surrounding tissue. To optimize the biological effect, accurate dosimetry needs to be implemented. A comprehensive dosimetry model could be based on detailed knowledge of the three parameters of importance in PDT: the fluence rate distribution, the sensitizer concentration, and the tissue oxygenation within the volume of interest.10 Studies aimed at correlating the treatment response to the total light dose alone in ALA-mediated PDT have shown varying success,11, 12, 13 whereas better correlation has been found between PDT-induced damage and therapeutic light irradiance.12, 14 Higher irradiances have been shown to lead to smaller treatment volumes, an effect that has been explained by oxygen depletion.15, 16 In addition, a good correlation has been found between the initial rate of sensitizer photobleaching and treatment outcome.11, 12, 14 The kinetics of PPIX photobleaching has shown a fluence rate dependency, in that a higher irradiance leads to a less pronounced loss of fluorescence and lower initial photobleaching rate.14, 17 Since PPIX photobleaching is suggested to be an oxygen-dependent process, during which PPIX is transformed to various photoproducts12, 17 that are also photobleached, these results support the hypothesis of oxygen depletion as a result of too high irradiances. It has been suggested that monitoring the bleaching via fluorescence spectroscopy could be a useful dosimetric tool in photodynamic therapy.18 In addition, studies by Mitra and Foster have shown up to 15 times higher 630-nm light transmission at depth when comparing a hypoxic to a well-oxygenated tissue phantom containing human erythrocytes.19 These results further emphasize the disadvantage of inducing tissue hypoxia during PDT, since not only is the photodynamic reaction prevented, but deoxygenation also limits the light penetration within the tumor volume. Based on the work quoted, there seems to be a close interdependence between treatment outcome, sensitizer photobleaching, therapeutic light fluence rate, and tissue oxygenation. Adopting the ideas of an implicit dosimetry model for PDT, according to Wilson, Patterson, and Lilge,10 there is a great need to intercorrelate these parameters and compare them to treatment outcome in clinical studies. In an implicit dosimetry model, one single parameter, e.g., the sensitizer photobleaching kinetics, is used to quantify PDT dose. Such a model has been formulated in contrast to explicit dosimetry, where the PDT dose is based on all three variables—light, sensitizer, and oxygen—necessary for the photodynamic reaction to take place. We have recently reported on the construction of, and initial clinical treatment using an instrument for, interstitial photodynamic therapy (IPDT), which allows for diagnostic measurements to monitor treatment progression.20 The present work reports on the results from the first ten clinical treatments, where changes in light transmission, sensitizer photobleaching, and tissue oxygen saturation level are monitored throughout the treatment. The study was aimed at monitoring the interplay between treatment-induced changes in absorption of the therapeutic irradiation, the sensitizer photobleaching, and the tissue oxygenation. The ultimate goal of simultaneous monitoring of parameters of dosimetric importance is the development of a dosimetry model for photodynamic therapy, taking into account spatial and time-resolved studies of the total light dose delivered, the sensitizer concentration, and the oxygen availability. 2.Materials and Methods2.1.Patients and Treatment ProcedureAn instrument for interstitial photodynamic therapy has been developed in which a maximum of six bare-end optical fibers are used to deliver the therapeutic light to the tumor mass. The same fibers can also be used to measure relevant dosimetry parameters during the treatment session. The clinical motivation for the treatment in this study was to reduce the tumor volume by means of interstitial photodynamic treatment prior to surgery. The study included eight patients with thick malignant skin lesions, within the approval by the Local Ethics Committee at Lund University Hospital. Six lesions were diagnosed as nodular basal cell carcinomas, whereas the remaining lesions were diagnosed as squamous cell carcinoma and keratoacanthoma∕squamous cell carcinoma. Two of the patients diagnosed with basal cell carcinomas underwent two treatment sessions, resulting in a total of ten treatments. Table 1 lists detailed data concerning each patient and treatment. No controls, i.e., fiber insertion and light delivery without drug, were included because of restrictions posed by the ethical approval. Table 1Treatment and patient information. BCC is basal cell carcinoma, SCC is squamous cell carcinoma, and i.l is intralesional drug delivery. In treatment 2, four light delivering fibers were used during the treatment, two emitting 25mW and the remaining two emitting 100mW . Also in treatment 2, for the light dose of 70, the full dose was not delivered as a result of fibers losing their respective positions. In treatment 10, for the light dose of 320, the treatment time was based on a threshold dose of 100J∕cm2 .
The tumor geometry was determined visually and by palpation by an experienced oncologist at the time of treatment. After removing possible crust and the stratum corneum overlying the lesion to facilitate the drug penetration, the lesion was photosensitized by ALA-methyl-esterified (ME) (methyl-esterified aminolevulinic acid, Medac GmbH, Hamburg, Germany) mixed into an oil-in-water emulsion (Essex Cream, Schering Corporation, Kenilworth, New Jersey) to a concentration by weight of 20%, which was applied topically with a margin to the lesion before the therapeutic irradiation. Three patients were also given ALA intratumorally prior to the treatment by injecting of a solution made from ALA powder dissolved in 0.9% saline buffer at several sites within the more deeply lying tumor part. After disinfecting the treatment area, Xylocain (AstraZeneca, Södertälje, Sweden) was administered subcutaneously as an anesthetic. The distal end of six sterilized optical fibers, hereafter referred to as the patient fibers, were inserted into the tumor mass at predetermined positions. Before commencing the therapeutic irradiation, one of these fibers was carefully translated stepwise throughout the tumor depth to confirm the presence of PPIX at up to four different depths by means of laser-induced fluorescence excited at . The plastic coating of the fibers made them rigid enough not to deflect during insertion, and no metal needles guiding the fibers during insertion were needed. The fiber holder, consisting of one flexible metal-wire arm for each patient fiber, held the fibers in place during the treatment session. The fiber positions were chosen to obtain as homogeneous a light distribution inside the lesion as possible, while sparing the surrounding tissue. An algorithm for determining the near-optimal fiber positions has been published elsewhere.21 Since all lesions could be approximated by rather flat cylinders, the resulting fiber positions were confined to one plane at half the tumor depth. In the treatment mode, the individual fiber output power was kept constant throughout the treatment session at power levels ranging from . The therapeutic irradiation was interrupted with varying time intervals to perform the measurement sequences. Measurement sequences were performed more frequently at the beginning of the treatment session to follow the rapid sensitizer photobleaching, and also prior to and at the end of each treatment session. The total irradiation time was determined by the requirement to deliver a light dose exceeding to every part of the lesion,20 leading to longer irradiation times for the larger lesions. Total light energy delivered and fiber output power are given in Table 1. 2.2.InstrumentationThe instrumentation used for the laser-induced fluorescence studies of the PPIX concentration throughout the tumor depth prior to therapeutic light delivery has been described in detail elsewhere.22 A nitrogen laser pumped dye laser emits pulsed excitation light at . After passing through a RG435 cut-off filter, fluorescent light between 450 and is dispersed by a spectrometer and detected by an intensified and cooled charge-coupled device (CCD). The setup of the interstitial photodynamic therapy (IPDT) instrument is shown in Fig. 1 and a more detailed description is given elsewhere.20 The therapeutic light unit consists of six diode lasers emitting at with an individual maximum output power of . While in treatment mode, light from the therapeutic unit is guided into the distribution module and directed into the six -diam optical fibers. Fig. 1The overall instrument setup. Shaded arrows indicate data flow, whereas unshaded arrows represent light paths. 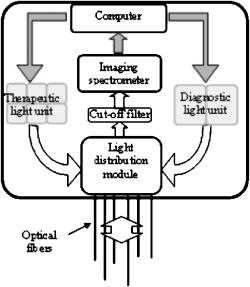 While in measurement mode, light from the diagnostic unit is coupled into one of the patient fibers via the light distribution module. The diagnostic light sources consist of a diode laser with the same wavelength as the treatment lasers and an LED covering the spectral range . The term “diagnostic” is here used to describe the progression of the treatment and does not refer to diagnosis of the patient’s status. One measurement sequence involves successively coupling the output from the two diagnostic light sources into each of the six patient fibers in turn. Transmitted light in the spectral range is collected by the remaining five fibers, dispersed by an imaging spectrometer, and detected by a CCD camera. A cut-off filter (Schott RG665) is used to attenuate the intense laser light, so that both the light transmission at and the sensitizer fluorescence at , which is excited by the light at , can be monitored simultaneously with similar intensity. The output power of each of the patient fibers is measured before the treatment session commences to compensate for internal losses in the fiber couplings. 2.3.Data EvaluationFollowing excitation at , the fluorescence signal within the spectral interval was used to quantify the PPIX concentration. When evaluating data collected by the IPDT instrument, noise was suppressed by smoothing each acquired spectrum over 20 bands, which corresponds to approximately in the CCD readout, and subtracting a constant background offset. Summing the detected signal within the spectral interval resulted in a signal describing the light transmission at the treatment wavelength, also referred to as the light transmission. Similarly, the PPIX fluorescence signal was obtained by summing the detected light from . Both for the light transmission and the sensitizer fluorescence measurements, the signals were normalized to their respective initial value. To get sufficient signal-to-noise, the data analysis was based on signals between neighboring fibers only. The patient fibers were always positioned with approximately equal separations within each patient. Distances between neighboring fibers were influenced by the tumor dimension and ranged from for the smallest lesions up to for the seventh treatment session. The third parameter of dosimetric importance measured during PDT is related to the oxygen concentration. We used an indirect method of monitoring the tissue oxygen content by analyzing the tissue absorption spectrum and assuming that it is dominated by oxy- and deoxyhemoglobin. The relative concentration of these compounds is calculated to provide the tissue oxygen saturation level, and are the deoxy- and oxyhemoglobin concentrations, respectively. Since the absorbance by hemoglobin and myoglobin are indistinguishable,23 and also include the absorption by myoglobin, if present.The changes in optical density in the spectral interval were measured using the LED as a light source: where is the initial light transmission between patient fibers and is the light transmission as detected during the subsequent measurement sequences. Assuming a semi-infinite medium where the extrapolated boundary condition applies and approximating the patient fibers with isotropic light sources, the light transmission can be expressed as:whereis the effective absorption coefficient, and and denote the absorption and reduced scattering coefficients, respectively. The wavelength dependence has been omitted for simplicity. Furthermore,where is the radial interfiber distance, equals the fiber insertion depth plus the factor , and . Combining Eqs. 2, 3 yields the following expression for the change in optical density:where and are the wavelength-dependent extinction coefficients of oxy- and deoxyhemoglobin, respectively.24 The changes in oxy- and deoxyhemoglobin concentration were assessed by nonlinear least-squares fitting of Eq. 4 to the measured change in optical density within the spectral interval . After assuming initial oxy- and deoxyhemoglobin concentrations, the tissue oxygen saturation was calculated from Eq. 1. Here, and were set to 20 and , respectively,25 giving an initial tissue oxygen saturation level of 70%, in agreement with previously reported baseline levels.26To derive Eq. 4, several assumptions have been made. First, a reduced scattering coefficient that remains constant over time and that is much larger in magnitude than the absorption coefficient was assumed. Second, Eq. 4 is assumed to be valid only in homogeneous tissues. By this way of analysis, attenuation of the transmitted light by a small amount of blood in front of either the detection or source fiber is attributed to a smaller increase in total hemoglobin content averaged throughout the probed tissue volume. In this work, the initial absorption and reduced scattering coefficients at were set to 0.3 and , respectively.27 Based on the known extinction spectra of oxy- and deoxyhemoglobin, the changes in light transmission at the treatment wavelength could be approximated by extrapolating the measured optical density changes from the wavelength region down to . The motivation for doing this was to check whether the observed treatment-induced absorption changes could be explained by the measured changes in tissue oxygenation and blood volume. The wavelength dependence of the reduced scattering coefficient, which influences the calculation when extrapolating the measured optical density changes from the wavelength region down to , is given the following appearance:28 3.ResultsFollowing excitation at , the PPIX fluorescence signal prior to the treatment was found to decrease throughout the tumor depth. The sensitizer displayed a large interpatient variability, which seemed to depend more on tissue porosity than on ALA delivery path. An example of a typical spectrum recorded when the diode laser emitting at was used as the diagnostic light source is shown in Fig. 2a . light transmission curves as a function of delivered light dose are presented in Fig. 2b. For this patient, the decrease in light transmission was rather homogeneous within the entire tumor volume. Fig. 2(a) Raw spectrum from a diagnostic measurement using the diode laser as a light source. Spectral intervals and indicate regions used for studying the light transmission at and the PPIX fluorescence signals, respectively. (b) Average of the normalized light transmission between neighboring patient fibers as a function of the delivered light dose from one patient. Signals within area are averaged to constitute a measure of final light transmission. (c) The light transmission remaining at the end of each treatment. (d) Average of the normalized PPIX fluorescence as measured between neighboring patient fibers as a function of the delivered light dose from one patient. (e) The PPIX fluorescence level remaining at the end of each treatment. In (b) through (e), the error bars denote standard deviation.  A significant treatment-induced attenuation increase was established in seven of nine completed treatment sessions by performing a one-sided Student’s -test. was considered significant. Data from treatment 2 was excluded, since the optical fibers moved when the patient started coughing after of therapeutic irradiation. Figure 2c shows the light transmission level remaining at the end of each treatment session. The data displayed were obtained by averaging the normalized light transmission between neighboring fibers within time interval , as indicated in Fig. 2b. Out of a total of 60 fiber insertions, the detected signals from four fibers were characterized by a rapid (changes occurred between the first and second measurement sequences) and more pronounced transmission decrease (down to less than 20% of the initial level), possibly indicative of significant blood pooling at the fiber tip. Data from these fibers, characterized by poor signal-to-noise ratio, were excluded from the data analysis. A typical sensitizer photobleaching curve is shown in Fig. 2d, where the average of the normalized fluorescence signal, as detected between neighboring patient fibers in one patient, has been plotted as a function of the delivered light dose. Data from the treatments indicate rapid initial photobleaching, followed by a slowly decaying fluorescence level. It should be noted that the sensitizer fluorescence signal was not compensated for the absorption increase, as seen from the fluence rate measurements. Figure 2e shows the remaining fluorescence level for treatments 3 to 10. Treatment 1 was excluded from the analysis because the PPIX fluorescence was below the detection limit of the system with its initial CCD settings. Figure 3a shows the changes in optical density at various times during treatment 3. The data were obtained by evaluating the recorded NIR transmission spectra according to Eq. 2. An increased absorbance can be seen around as the treatment progressed. In this wavelength region, deoxyhemoglobin has a higher extinction coefficient than oxyhemoglobin, as shown in Fig. 3b.24 The changes in concentration of oxy- and deoxyhemoglobin were evaluated using Eq. 4. Figure 3c illustrates the concentration changes corresponding to the data shown in Fig. 3a. The curves are not each other’s opposite, indicating treatment-induced changes in total blood volume. Fig. 3(a) Changes in tissue optical density from the third treatment for five different treatment times. (b) Extinction coefficients of oxy- and deoxyhemoglobin as a function of wavelength. (c) Concentration changes of oxy- and deoxyhemoglobin as a function of the delivered light dose .  Figure 4a shows a schematic illustration of the tumor cross section for one of the treatments and the patient fiber configuration used during this treatment. Similar configurations were used for all treatments. In Fig. 4b, the tissue oxygenation level according to Eq. 1 is shown when measured using the six fiber pairs, as indicated in the legend. As can be seen, during treatment 3 the volume probed when measuring between fibers 1 and 2 displayed a higher degree of deoxygenation than the other parts of the tumor. Figure 4c shows the tumor oxygenation level after averaging the signals between all patient fibers. It should be noted that this graph includes transmission signals with source-detector separations of up to . Figure 4d shows the minimum average tissue oxygen saturation level for seven treatment sessions. Fig. 4(a) Example of tumor cross section and fiber positions. (b) Tissue oxygen saturation during treatment 3 as a function of the delivered light dose . The legend indicates source-detector fibers. (c) Average tissue oxygenation as a function of the delivered light dose . (d) Minimum tissue oxygen saturation level for seven treatments. Error bars denote standard deviations resulting when averaging signals between neighboring patient fibers. The dashed line represents the 70% oxygen saturation level.  The standard deviations for sessions 3, 4, 6, 7, and 8 result from averaging the transmission signals between many fiber combinations, thereby probing a highly heterogeneous tissue. The extremely large standard deviations for treatments 5 and 10 indicate either that the model used for describing the transmitted NIR signal was incorrect or that fiber positions changed during the treatment. Data for these two patients give no relevant information but have been included in the graph for completeness. Although not significant, smaller source-detector separations seemed to exhibit a higher degree of tissue deoxygenation than when analyzing transmission signals having traveled across larger tumor volumes. In addition to treatment sessions 1 and 2, data from session 9 have been excluded, because the CCD settings were incorrect during this particular treatment. Besides changes in tissue oxygen saturation level, the treatment also induced changes in the total hemoglobin content, as shown in Fig. 5a . The plot shows the relative changes in total hemoglobin content for seven treatments when assuming initial deoxy- and oxyhemoglobin concentrations according to Sec. 2.3. Again, the large standard deviations for sessions 5 and 10 indicate a poor fit to the model. Here we tested the hypothesis that changes in tissue oxygen saturation and blood volume resulted in the observed increase in tissue absorption at the treatment wavelength. The change in light transmission at the therapeutic wavelength was approximated by extrapolating the measured optical density change from the wavelength region down to based on the known extinction coefficients of oxy- and deoxyhemoglobin. Figure 5b illustrates the agreement for a set of one source fiber and five detection fibers during one of the treatments. A relative error estimate was defined according to the following formula: where is the number of measurements. Taking into account signals between neighboring fibers, the fit for the treatment session shown in Fig. 5b resulted in . Of the other treatments, four showed error estimates of similar magnitude when fitting the predicted light transmission profile to the measured one, whereas the fit from treatment sessions 5 and 10 resulted in ten-fold larger errors. As explained before, data from treatments 1, 2, and 9 were excluded.Fig. 5(a) Change in total hemoglobin content for seven treatments. (b) Example of measured and extrapolated light transmission at . The curves, which are offset for clarity, show the normalized light transmission between one source fiber and five detection fibers during the third treatment.  Figures 4d, 5a, 5b indicate treatment-induced variations in tissue oxygenation and total hemoglobin content, which seem to explain the observed absorption increase at the treatment wavelength. To further explore the connection between the light transmission, the tissue oxygenation, and the total blood content, the correlation between the final light transmission, obtained by averaging the normalized transmission signal over time interval , as indicated in Fig. 2b, and the total change in tissue blood volume was studied for seven treatments. Comparing the averages of these two variables for each treatment session resulted in a correlation coefficient of . The correlation between the average final light transmission and the minimum tissue oxygen saturation was only 0.23. Finally, the correlation between the overall absorption increase and the initial photobleaching rate was studied. The PPIX photobleaching rate was quantified by fitting a double exponential to the normalized fluorescence decay curve by means of a nonlinear least squares Levenberg-Marquardt method. The fit to the raw data, indicated in Fig. 6a , was given the following principal appearance; where and denote the PPIX fluorescence signal and the delivered light dose, respectively. The constants through were allowed to vary during the fit. Of the two constants and , the one with the largest magnitude was used to describe the initial photobleaching rate. The average value of this initial decay rate for each of eight treatment sessions is plotted along the abscissa in Fig. 6b, whereas the ordinate gives the average of the normalized, final light transmission. Each marker in Fig. 6b indicates an average of the light transmission∕fluorescence decay rate from each treatment, and therefore represents an average over the entire tumor volume. The standard deviations are a result of probing a rather large and heterogeneous tissue volume. The correlation coefficient between the final light transmission and the initial PPIX fluorescence decay rate was found to be 0.81. A similar analysis showed a correlation coefficient of between the final light transmission and the final PPIX fluorescence level. In summary, Fig. 6b indicates a less pronounced absorption increase during treatment sessions that show more rapidphotobleaching.Fig. 6(a) Example of a PPIX photobleaching curve and the double exponential fit. The exponent of the rapidly decaying term was used to quantify the photobleaching rate. (b) Scatter plot illustrating the correlation between the initial photobleaching rate and the light transmission remaining at the end of the treatment. Error bars denote standard deviations and the treatment number is indicated in the legend.  One-way analysis of variance (ANOVA) showed no significant differences between the two groups of patients receiving topical and topical plus intratumoral ALA administration, nor between different fiber output powers for the variables presented in Figs. 2c, 2e, 4d, 5a, 6b. was considered significant. 4.DiscussionInterstitial photodynamic therapy has been applied in the treatment of several conditions, for example, malignancies in the prostate,29 liver,30 and pancreas.9 Various photosensitizers have been used in those studies, and relatively large treatment volumes have been obtained. This has been possible due to the low thresholds and long activation wavelengths for the sensitizers used.31, 32, 33 The main limitations of IPDT as applied today are the limited light penetration and the lack of a more precise dosimetry. In this study, we used ALA because of our extensive experience of using this substance in the treatment of skin malignancies. The results presented are not focused on the treatment outcome of the tumors, but rather on treatment-induced changes in tissue absorption, PPIX photobleaching and tissue oxygenation level, and possible correlations between them. The fluorescence measurements showed the typical characteristics of PPIX photobleaching, where the final sensitizer fluorescence constituted less than 25% of the initial fluorescence level. Both the overall amount of photobleaching and the initial photobleaching rate have been shown to correlate with tissue oxygenation and amount of PDT damage, possibly indicating the feasibility of using the sensitizer photobleaching as an implicit dosimetric parameter.10, 11, 17 The sensitizer fluorescence signal could therefore possibly be used as a first indication of the treatment outcome, and not merely to provide information about the presence of the drug. More work is required to correlate the fluorescence kinetics to the treatment outcome, including results of long-term follow-up. In this work, an indirect method of assessing the tissue oxygen content was used, which assumes there is a connection between the oxygen saturation of hemoglobin and the concentration of oxygen molecules . On the time scale associated with a typical treatment and also during a measurement cycle, we believe that the balance between deoxy- and oxygenated tissue reflects the oxygen concentration level. The tissue oxygen saturation levels reported do not indicate any incidence of serious tissue hypoxia during the treatment sessions. One possible explanation might be that PDT following local administration of ALA is not associated with a pronounced vasoconstriction as PDT with many other sensitizers, for example, Foscan and HpD. When using topically administered ALA, increased blood perfusion has been observed during treatment of superficial skin malignancies.34 Another possible explanation for us not seeing lower oxygenation levels is the relatively large tissue volume probed by the NIR light, determined by the relatively long distance between source and detector fibers. In contrast, one could expect oxygen consumption and depletion to be local processes occurring close to the light source, where the fluence rate is highest.15, 35 It is thus likely that these measurements probe tissue characterized by inhomogeneous oxygen saturation. The influence of a good oxygen supply on tumor treatment outcome is well established. Following systemic administration of ALA, irradiation fractionation with dark intervals on the order of a couple of minutes has been shown to induce three times more necrosis than continuous therapeutic irradiation, an effect that has been explained by tissue reoxygenation during the dark periods.15 Real-time monitoring of the tissue oxygen saturation levels is clearly desirable when trying to improve treatment outcome. Although not significant, for some treatments we observed a slightly higher oxygenation level for the earliest measurements during a measurement sequence. Since one such sequence interrupts the therapeutic irradiation for , this might be in agreement with work done by Foster who reported on tissue reoxygenation using dark intervals on the order of .36 Other authors have also reported a decrease in the light penetration in tissue during PDT, and possible explanations include damage to the tissue microcirculation,37 alteration of the local blood flow and perfusion,3, 38 and local hyperthermia or bleeding at the fiber tips.39 Because of the high absorption coefficient of blood, bleeding at the fiber tips has a considerable impact on the light distribution in the tissue, and blood pooling at the light sources should be prevented to avoid insufficient treatment. By measuring the magnitude of the light transmission between patient fibers, fibers characterized by significant blood pooling can be identified and an insufficient treatment can be avoided by repositioning these fibers. When using bare-end fibers for light delivery, one should not neglect the risk of inducing hyperthermia due to the high irradiance close to the fiber tip. Recent work by our group using temperature-dependent fluorescence from alexandrite-doped treatment fibers has shown a local temperature increase of in vivo at the fiber tip.40 However, the small temperature increase observed using crystal-doped fiber tips can probably not explain the observed increase in tissue absorption.41, 42 Another possible explanation for the observed decrease in light transmission during the treatment sessions is based on treatment-induced changes in oxy- and deoxyhemoglobin concentrations. Tissue deoxygenation as a consequence of oxygen consumption associated with the photodynamic reaction would cause an increase in tissue absorption at , since deoxyhemoglobin is a much stronger absorber at this wavelength than oxyhemoglobin.19, 24 Furthermore, local blood accumulation at the fiber tips would increase the average tissue light attenuation. Here we have tested the hypothesis that changes in tissue oxygen saturation and blood volume induce changes in the average tissue absorption coefficient. Evaluation of the measured tissue optical density in the wavelength interval indicates treatment-induced tissue deoxygenation in combination with a considerable change in blood volume. The changes in light transmission predicted by the calculated changes in hemoglobin content were compared to the light transmission actually measured at , showing excellent agreement for some patients. Judging by the magnitudes of the correlation coefficients, the absorption increase seems to be more influenced by the observed changes in total hemoglobin content than by the varying tissue oxygen saturation. This poor correlation might originate from the assumption of homogeneous tissue associated with our analysis of the NIR signal. We are presently working on a way to incorporate tissue inhomogeneities in the geometry following the concept outlined in Ref. 43. In the case of light transmission, treatment 6 represents an outlier where we actually observed an increase in tissue light transmission. This lesion had previously been treated by cryotherapy, leading to hypopigmentation and loss of vascularity. A low average blood concentration, possibly in combination with tissue oedema induced by the treatment, could perhaps explain the transmission increase. The observed increase in absorption influences the light distribution throughout the tumor volume, with the result that peripheral regions, which are important for tumor growth, may not receive a sufficient light dose. By carefully monitoring the light penetration during the treatment, information can be obtained on prolonging the treatment time or adjusting the individual fiber output power to deliver the planned light dose to these critical volumes. The aim of these dosimetric measurements performed in parallel with the therapy is treatment supervision and real-time feedback to improve treatment results. During the clinical work, we observed large interpatient variations in the detected signals, a fact that further supports the concept of individualized treatment control. Even though we have had promising results when using bare-ended fibers for IPDT,44 the extremely high fluence rate close to the light sources introduces two major issues that need to be addressed: first, the light absorption by tissue might introduce thermal effects such as charring, and second, the high fluence rate might introduce local oxygen depletion and thereby lack of treatment response close to the light sources. With these concerns in mind, we limited the fiber output power to . Histopathology performed on excised tissue from some of the patients included in this work displayed no evidence of thermal effects or inefficient treatment close to the fiber tips. In support of our findings, Woodhams have reported no thermal effects in controls with light only at .45 Although not shown here, the results from histopathology studies on the excised tissue showed tumor necrosis down to a depth of following only topical ALA application. The presence of PPIX at depths of up to following the combination of topical and intratumoral drug administration was confirmed by the point-monitoring laser-induced fluorescence studies. Experimentally determined and theoretically modeled ALA penetration depths between 2 and have been reported by other groups.46, 47 In this study, possible explanations to the presence of PPIX at the relatively large depths might be increased drug diffusivity and skin permeability achieved by the use of ALA-ME, and the removal of crust and the superficial skin layer.48 The negative correlation between the light transmission and the sensitizer fluorescence level remaining at the end of the treatment indicates more efficient photobleaching during treatments characterized by a smaller increase in tissue absorption. This result might not seem very surprising, since a higher irradiance photobleaches the sensitizer more efficiently, given a sufficient oxygen concentration. The relatively high degree of correlation between the initial sensitizer photobleaching rate and the light transmission remaining at the end of the treatment session might thus also imply some oxygen dependence behind the increase in tissue light absorption. It should be noted that here we observed a correlation between the fluorescence signal during the first few minutes of the treatment session and the tissue absorption at the end of the treatment. These two parameters are separated in time by up to . The explanation might lie in the fact that a tumor with an overall stable blood supply can maintain this throughout the entire treatment, thereby avoiding oxygen depletion. The situation may, however, be completely different for sensitizers with more pronounced vascular effects than ALA-induced PPIX. However, care should be exercised when drawing any conclusions based merely on the correlation coefficients, due to the small number of patients included in the study. The need for a larger study also applies when trying to identify differences between the two ALA administration paths. The analysis of the tissue oxygen saturation signal is subject to several assumptions and sources of error. Exact knowledge of the fiber positions, gained for example by means of ultrasound techniques, will minimize one of the sources of uncertainties in the data analysis. Furthermore, the assumption of a constant reduced scattering constant throughout the treatment and the values of the initial absorption and reduced scattering coefficients constitute another source of error. Although not shown here, the temporal profile of the tissue oxygen saturation level seems to be reasonably insensitive to variations in these coefficients within certain limits. An interesting task for the future would be to monitor the tissue’s optical properties during the treatment session. Using a time-resolved system, it would be possible to separately measure the reduced scattering and absorption coefficients,49 which could aid in interpreting the observed variations in light penetration reported here. Our indirect method of assessing the tissue oxygen saturation should be correlated to in vivo measurements of oxygen concentration, for example, by means of oxygen-sensitive microelectrodes or oxygen-dependent phosphorescence quenching probes.35 The inclusion of controls, where fibers are inserted and light is delivered in the absence of photosensitizer, is a necessity when further interpreting the results from the diagnostic measurements. In conclusion, we have reported on simultaneous measurements of fluence rate, sensitizer fluorescence, and tissue oxygen saturation during interstitial photodynamic therapy of thick malignant skin tumors. A significant increase in tissue light absorption was observed during seven completed treatments, possibly explained by treatment-induced tissue deoxygenation and blood volume increase. A high absorption increase was found to correlate to a lower initial sensitizer photobleaching rate. We emphasize the importance of the proposed real-time diagnostic measurements as a tool for treatment supervision and feedback. AcknowledgmentsThis project was financially supported by the Swedish Foundation for Strategic Research, the Swedish Research Council (Scientific Council for Medicine), and also by Karolinska Development AB, Stockholm and Lund University Development AB through SpectraCure AB. The authors wish to thank Epsilon Technology AB for providing technical solutions and hardware integration. ReferencesT. J. Dougherty,
C. J. Gomer,
B. W. Henderson,
G. Jori,
D. Kessel,
M. Korbelik,
J. Moan, and
Q. Peng,
“Photodynamic therapy,”
J. Natl. Cancer Inst., 90
(12), 889
–905
(1998). https://doi.org/10.1093/jnci/90.12.889 0027-8874 Google Scholar
B. B. Noodt,
K. Berg,
T. Stokke,
Q. Peng, and
J. M. Nesland,
“Apoptosis and necrosis induced with light and 5-aminolaevulinic acid-derived protoporphyrin IX,”
Br. J. Cancer, 74
(1), 22
–29
(1996). 0007-0920 Google Scholar
D. J. H. Roberts,
F. Cairnduff,
I. Driver,
B. Dixon, and
S. B. Brown,
“Tumor vascular shutdown following photodynamic therapy based on polyhematoporphyrinor 5-aminolevulinic acid,”
Int. J. Oncol., 5
(4), 763
–768
(1994). 1019-6439 Google Scholar
J. C. Kennedy and
R. H. Pottier,
“Endogenous protoporphyrin IX, a clinically useful photosensitizer for photodynamic therapy,”
J. Photochem. Photobiol., B, 14 275
–292
(1992). https://doi.org/10.1016/1011-1344(92)85108-7 1011-1344 Google Scholar
Q. Peng,
T. Warloe,
K. Berg,
J. Moan,
M. Kongshaug, K. E. Giercksky, J. M. Nesland,
“5-aminolevulinic acid-based photodynamic therapy: Clinical research and future challenges,”
Cancer, 79 2282
–2308
(1997). 0008-543X Google Scholar
T. Johansson,
M. Soto Thompson,
M. Stenberg,
C. af Klinteberg,
S. Andersson-Engels,
S. Svanberg, and
K. Svanberg,
“Feasibility study of a novel system for combined light dosimetry and interstitial photodynamic treatment of massive tumors,”
Appl. Opt., 41
(7), 1462
–1468
(2002). 0003-6935 Google Scholar
S. F. Purkiss,
M. F. Grahn,
A. M. Abulafi,
R. Dean,
J. T. Allardice, and
N. S. Williams,
“Multiple fiber interstitial photodynamic therapy of patients with colorectal liver metastases,”
Lasers Med. Sci., 9
(1), 27
–35
(1994) Google Scholar
P. J. Lou,
H. R. Jager,
L. Jones,
T. Theodossy,
S. G. Bown, and
C. Hopper,
“Interstitial photodynamic therapy as salvage treatment for recurrent head and neck cancer,”
Br. J. Cancer, 91
(3), 441
–446
(2004). 0007-0920 Google Scholar
S. G. Bown,
A. Z. Rogowska,
D. E. Whitelaw,
W. R. Lees,
L. B. Lovat,
P. Ripley,
L. Jones,
P. Wyld,
A. Gillams, and
A. W. Hatfield,
“Photodynamic therapy for cancer of the pancreas,”
Gut, 50
(4), 549
–557
(2002). 0017-5749 Google Scholar
B. C. Wilson,
M. S. Patterson, and
L. Lilge,
“Implicit and explicit dosimetry in photodynamic therapy: a new paradigm,”
Lasers Med. Sci., 12
(3), 182
–199
(1997) Google Scholar
I. A. Boere,
D. J. Robinson,
H. S. de Bruijn,
J. van den Boogert,
H. W. Tilanus,
H. J. C. M. Sterenborg, and
R. W. F. de Bruin,
“Monitoring in situ dosimetry and protoporphyrin IX fluorescence photobleaching in the normal rat esophagus during 5-aminolevulinic acid photodynamic therapy,”
Photochem. Photobiol., 78
(3), 271
–2
(2003). 0031-8655 Google Scholar
D. J. Robinson,
H. S. de Bruijn,
N. van der Veen,
M. R. Stringer,
S. B. Brown, and
W. M. Star,
“Fluorescence photobleaching of ALA-induced protoporphyrin IX during photodynamic therapy of normal hairless mouse skin: The effect of light dose and irradiance and the resulting biological effect,”
Photochem. Photobiol., 67
(1), 140
–149
(1998). https://doi.org/10.1562/0031-8655(1998)067<0140:FPOAIP>2.3.CO;2 0031-8655 Google Scholar
Z. W. Xiao,
Y. Y. Tamimi,
K. Brown,
J. Tulip, and
R. Moore,
“Interstitial photodynamic therapy in subcutaneously implanted urologic tumors in rats after intravenous administration of 5-aminolevulinic acid,”
Urologic Oncology, 7
(3), 125
–132
(2002) Google Scholar
D. J. Robinson,
H. S. de Bruijn,
N. van der Veen,
M. R. Stringer,
S. B. Brown, and
W. M. Star,
“Protoporphyrin IX fluorescence photobleaching during ALA-mediated photodynamic therapy of UVB-induced tumors in hairless mouse skin,”
Photochem. Photobiol., 69
(1), 61
–70
(1999). 0031-8655 Google Scholar
A. Curnow,
J. C. Haller, and
S. G. Bown,
“Oxygen monitoring during 5-aminolaevulinic acid induced photodynamic therapy in normal rat colon. Comparison of continuous and fractionated light regimes.,”
J. Photochem. Photobiol., B, 58
(2–3), 149
–155
(2000). 1011-1344 Google Scholar
Q. Chen,
Z. Huang,
H. Chen, and
H. Shapiro,
“Improvement of tumour response by manipulation of tumour oxygenation during PDT,”
Photochem. Photobiol., 76 197
–203
(2002). 0031-8655 Google Scholar
J. C. Finlay,
D. L. Conover,
E. L. Hull, and
T. H. Foster,
“Porphyrin bleaching and PDT-induced spectral changes are irradiance dependent in ALA-senstitized normal rat skin in vivo,”
Photochem. Photobiol., 73
(1), 54
–63
(2001). https://doi.org/10.1562/0031-8655(2001)073<0054:PBAPIS>2.0.CO;2 0031-8655 Google Scholar
K. König,
H. Schneckenburger,
A. Rück, and
R. Steiner,
“In vivo photoproduct formation during PDT with ALA-induced endogenous porphyrins,”
J. Photochem. Photobiol., B, 18 287
–290
(1993). https://doi.org/10.1016/1011-1344(93)80077-M 1011-1344 Google Scholar
S. Mitra and
T. H. Foster,
“Carbogen breathing significantly enhances the penetration of red light in murine tumours in vivo,”
Phys. Med. Biol., 49
(10), 1891
–1904
(2004). 0031-9155 Google Scholar
M. Soto Thompson,
A. Johansson,
T. Johansson,
S. Andersson-Engels,
N. Bendsoe,
K. Svanberg, and
S. Svanberg,
“Clinical system for interstitial photodynamic therapy with combined on-line dosimetry measurements,”
Appl. Opt., 44
(19), 4023
–4031
(2005). https://doi.org/10.1364/AO.44.004023 0003-6935 Google Scholar
A. Johansson,
J. Hjelm,
E. Eriksson, and
S. Andersson-Engels,
“Pre-treatment dosimetry for interstitial photodynamic therapy,”
Proc. SPIE, 5863 121
–131
(2005). 0277-786X Google Scholar
C. af Klinteberg,
M. Andreasson,
O. Sandström,
S. Andersson-Engels, and
S. Svanberg,
“Compact medical fluorosensor for minimally invasive tissue characterisation,”
Rev. Sci. Instrum., 76
(3), 034303
–034306
(2005). https://doi.org/10.1063/1.1867569 0034-6748 Google Scholar
R. Wariar,
J. N. Gaffke,
R. G. Haller, and
L. A. Bertocci,
“A modular NIRS system for clinical measurement of impaired skeletal muscle oxygenation,”
J. Appl. Physiol., 88
(1), 315
–325
(2000). 8750-7587 Google Scholar
S. A. Prahl,
“Optical Absorption of Hemoglobin,”
(2004) http://omlc.ogi.edu/spectra/hemoglobin/index.html Google Scholar
L. Rovati,
A. Bandera,
M. Donini,
G. Salvatori, and
L. Pollonini,
“Design and performance of a wide-bandwidth and sensitive instrument for near-infrared spectroscopic measurements on human tissue,”
Rev. Sci. Instrum., 75
(12), 5315
–5325
(2004). https://doi.org/10.1063/1.1818588 0034-6748 Google Scholar
D. A. Benaron,
I. H. Parachikov,
S. Friedland,
R. Soetikno,
J. Brock-Utne,
P. J. van der Starre,
C. Nezhat,
M. K. Terris,
P. G. Maxim,
J. J. Carson,
M. K. Razavi,
H. B. Gladstone,
E. F. Fincher,
C. P. Hsu,
F. L. Clark,
W. F. Cheong,
J. L. Duckworth, and
D. K. Stevenson,
“Continuous, noninvasive, and localized microvascular tissue oximetry using visible light spectroscopy,”
Anesthesiology, 100
(6), 1469
–1475
(2004). https://doi.org/10.1097/00000542-200406000-00019 0003-3022 Google Scholar
J. B. Fishkin,
O. Coquoz,
E. R. Anderson,
M. Brenner, and
B. J. Tromberg,
“Frequency-domain photon migration measurements of normal and malignant tissue optical properties in a human subject,”
Appl. Opt., 36
(1), 10
–20
(1997). 0003-6935 Google Scholar
R. M. P. Doornbos,
R. Lang,
M. C. Aalders,
F. W. Cross, and
H. J. C. M. Sterenborg,
“The determination of in vivo human tissue optical properties and absolute chromophore concentrations using spatially resolved steady-state diffuse reflectance spectroscopy,”
Phys. Med. Biol., 44 967
–981
(1999). https://doi.org/10.1088/0031-9155/44/4/012 0031-9155 Google Scholar
S. C. Chang,
G. Buonaccorsi,
A. MacRobert, and
S. G. Bown,
“Interstitial and transurethral photodynamic therapy of the canine prostate using meso-tetra-(m-hydroxyphenyl) chlorin,”
Int. J. Cancer, 67
(4), 555
–562
(1996). https://doi.org/10.1002/(SICI)1097-0215(19960807)67:4<555::AID-IJC15>3.0.CO;2-6 0020-7136 Google Scholar
T. J. Vogl,
K. Eichler,
M. G. Mack,
S. Zangos,
C. Herzog, A. Thalhammer, K. Engelmann,
“Interstitial photodynamic laser therapy in interventional oncology,”
Eur. Radiol., 14
(6), 1063
–1073
(2004). 0938-7994 Google Scholar
S. C. Chang,
G. A. Buonaccorsi,
A. J. MacRobert, and
S. Bown,
“Interstitial photodynamic therapy in the canine prostate with disulfonated aluminum phthalocyanine and 5-aminolevulinic acid-induced protoporphyrin IX,”
Prostate, 32
(2), 89
–98
(1997). 0270-4137 Google Scholar
J. P. Rovers,
M. L. de Jode, and
M. F. Grahn,
“Significantly increased lesion size by using the near-infrared photosensitizer 5,10,15,20-tetrakis (m-hydroxyphenyl) bacteriochlorin in interstitial photodynamic therapy of normal rat liver tissue,”
Lasers Surg. Med., 27
(3), 235
–240
(2000). 0196-8092 Google Scholar
L. K. Lee,
C. Whitehurst,
Q. Chen,
M. L. Pantelides,
F. W. Hetzel, and
J. V. Moore,
“Interstitial photodynamic therapy in the canine prostate,”
Br. J. Urol., 80
(6), 898
–902
(1997). 0007-1331 Google Scholar
I. Wang,
S. Andersson-Engels,
G. E. Nilsson,
K. Wårdell, and
K. Svanberg,
“Superficial blood flow following photodynamic therapy of malignant skin tumours measured by laser Doppler perfusion imaging,”
Br. J. Dermatol., 136 184
–189
(1997). 0007-0963 Google Scholar
B. W. McIlroy,
A. Curnow,
G. Buonaccorsi,
M. A. Scott,
S. G. Bown, and
A. J. MacRobert,
“Spatial measurement of oxygen levels during photodynamic therapy using time-resolved optical spectroscopy,”
J. Photochem. Photobiol., B, 43
(1), 47
–55
(1998). https://doi.org/10.1016/S1011-1344(98)00081-5 1011-1344 Google Scholar
T. H. Foster,
R. S. Murant,
R. G. Bryant,
R. S. Knox,
S. L. Gibson, and
R. Hilf,
“Oxygen consumption and diffusion effects in photodynamic therapy,”
Radiat. Res., 126 296
–303
(1991). 0033-7587 Google Scholar
A. M. K. Nilsson,
R. Berg, and
S. Andersson-Engels,
“Measurements of the optical properties of tissue in conjunction with photodynamic therapy,”
Appl. Opt., 34
(21), 4609
–4619
(1995). 0003-6935 Google Scholar
Q. Chen,
B. C. Wilson,
S. D. Shetty,
M. S. Patterson,
J. C. Cerny, and
F. W. Hetzel,
“Changes in in vivo optical properties and light distributions in normal canine prostate during photodynamic therapy,”
Radiat. Res., 147
(1), 86
–91
(1997). 0033-7587 Google Scholar
J. P. A. Marijnissen and
W. M. Star,
“Quantitative light dosimetry in vitro and in vivo,”
Lasers Med. Sci., 2 235
–242
(1987) Google Scholar
J. Svensson,
A. Johansson,
K. Svanberg, and
S. Andersson-Engels,
“Tissue temperature monitoring during interstitial photodynamic therapy,”
Proc. SPIE, 5698 126
–136
(2005). 0277-786X Google Scholar
A. M. K. Nilsson,
G. W. Lucassen,
W. Verkruysse,
S. Andersson-Engels, and
M. J. C. van Gemert,
“Optical properties of human whole blood—changes due to slow heating,”
Proc. SPIE, 2923 24
–34
(1996). 0277-786X Google Scholar
S. Jaywant,
B. C. Wilson,
M. Patterson,
L. Lilge,
T. Flotte, J. Woolsey, C. McCulloch,
“Temperature dependent changes in the optical absorption and scattering spectra of tissues: correlation with ultrastructure,”
Proc. SPIE, 1882 218
–229
(1993). 0277-786X Google Scholar
M. Hiraoka,
M. Firbank,
M. Essenpreis,
M. Cope,
S. R. Arridge,
P. van der Zee, and
D. T. Delpy,
“A Monte Carlo investigation of optical pathlength in inhomogeneous tissue and its application to near-infrared spectroscopy,”
Phys. Med. Biol., 38
(12), 1859
–1876
(1993). https://doi.org/10.1088/0031-9155/38/12/011 0031-9155 Google Scholar
M. Soto Thompson,
S. Andersson-Engels,
S. Svanberg,
T. Johansson,
S. Pålsson,
N. Bendsoe,
U. Stenram,
A. Derjabo,
J. Kapostins,
J. Spigulis, and
K. Svanberg,
“Photodynamic therapy of basal cell carcinoma with multi-fibre contact light delivery,”
J. Environ. Pathol. Toxicol. Oncol., 25
(1–2), 411
–424
(2006). 0731-8898 Google Scholar
J. H. Woodhams,
L. Kunz,
S. G. Bown, and
A. J. MacRobert,
“Correlation of real-time haemoglobin oxygen saturation monitoring during photodynamic therapy with microvascular effects and tissue necrosis in normal rat liver,”
Br. J. Cancer, 91
(4), 788
–794
(2004). 0007-0920 Google Scholar
Q. Peng,
A. M. Soler,
T. Warloe,
J. M. Nesland, and
K. E. Giercksky,
“Selective distribution of porphyrins in skin thick basal cell carcinoma after topical application of methyl 5-aminolevulinate,”
J. Photochem. Photobiol., B, 62
(3), 140
–145
(2001). 1011-1344 Google Scholar
L. O. Svaasand,
P. Wyss,
M. T. Wyss,
Y. Tadir,
B. J. Tromberg, and
M. W. Berns,
“Dosimetry model for photodynamic therapy with topically administered photosensitizers,”
Lasers Surg. Med., 18 139
–149
(1996). 0196-8092 Google Scholar
J. T. H. M. van den Akker,
J. A. Holroyd,
D. I. Vernon,
H. J. C. M. Sterenborg, and
S. B. Brown,
“Comparative in vitro percutaneous penetration of 5-aminolevulinic acid and two of its esters through excised hairless mouse skin,”
Lasers Surg. Med., 33
(3), 173
–181
(2003). 0196-8092 Google Scholar
T. Svensson,
J. Swartling,
P. Taroni,
A. Torricelli,
P. Lindblom,
C. Ingvar, and
S. Andersson-Engels,
“Characterization of normal breast tissue heterogeneity using time-resolved near-infrared spectroscopy,”
Phys. Med. Biol., 50 2559
–2571
(2005). https://doi.org/10.1088/0031-9155/50/11/008 0031-9155 Google Scholar
|


