
|
|
1.IntroductionThe concept of selective targeting of strongly absorbing structures in weakly absorbing tissues was introduced by Anderson and Parrish.1 It has led to various treatment modalities in dermatology and ophthalmology.2, 3, 4 If heat is generated within the strongly absorbing target structure more rapidly than it can diffuse, high temperatures are confined to the absorber and thus selective tissue damage with a precision of the absorber size can be achieved in spite of irradiation with large spot diameters.5, 6 An ophthalmic application of this concept is the selective retina treatment (SRT),3, 7 where the retinal pigment epithelium (RPE) is targeted. The RPE is a monocellular layer located under the neuroretina. The RPE cells are heavily loaded with melanosomes, which are strongly absorbing micron-sized melanin granules. Selective laser-induced damage to the RPE is currently investigated with respect to its therapeutic benefit on certain retinal diseases associated with a decreased metabolic activity of the RPE. 7, 8, 9, 10, 11 The positive therapeutic effect is thought to be induced by the healing process of the RPE leading to a rejuvenation of the RPE. Current clinical studies focus on the treatment of diabetic maculopathy, central serous retinopathy, drusen maculopathy, and geographic atropy secondary to age-related macular degeneration, macular edema after venous branch occlusion, and occult chorioretinal neovascularization.8, 10, 11 The detailed rationale for the treatment of these diseases can be found in Refs. 3, 7, 8, 9. The advantage of SRT in comparison to conventional photocoagulation12 is the sparing of the photoreceptors. Degraded RPE areas, which are damaged selectively during SRT, are replaced by proliferation and migration of neighboring functional RPE cells within about two weeks post-treatment.7 The visual acuity in the irradiated areas is maintained, which was proven by microperimetry.13 This approach allows treatment close to the fovea, where laser scotoma induced by conventional photocoagulation would result in a severe loss of visual acuity. For clinical SRT, a burst of 30 laser pulses (wavelength , pulse duration ) with energies in the range of to is currently applied on a retinal spot diameter of at a pulse repetition rate of .8, 10, 11 In order to avoid thermal damage of the neuroretina and to achieve spatially confined heating of the RPE, the laser pulse duration has to be shorter than the thermal diffusion time of the RPE layer . If the pulse duration is shorter than the acoustic transit time of the RPE layer , strong thermoelastic stress transients are produced, which can enhance the damage range. Therefore, microsecond laser pulses are used for SRT in order to ensure thermally confined and acoustically unconfined irradiation. Like in conventional photocoagulation,14, 15 laser-induced cell damage in the RPE was first thought to be caused by spatially confined rapid heating of the strongly absorbing melanosomes via protein denaturation and thermal enzyme inactivation.7 However, in SRT, it is more likely produced by localized microvaporization around the intracellular melanosomes.6, 9 Ex vivo experiments suggest that intracellular microvaporization followed by transient microbubble formation is the origin of cell death for laser pulse durations below (Ref. 16) and ,17 respectively. Because the laser lesions of SRT are ophthalmoscopically invisible, fluorescein angiography is used in current clinical studies after treatment to determine breakage of the blood-retina barrier as an indication of RPE defects.3, 8 These angiographically visible laser-induced defects are defined as successful treatment. It was found that the threshold radiant exposure for laser-induced angiographically visible RPE damage can vary inter- and intraindividually by a factor of 2.9 Furthermore, the onset of whitish areas most likely indicating unwanted photoreceptor damage was noticed at about twofold threshold radiant exposure for RPE damage,8 which makes individual dosimetry mandatory. To minimize the danger of unwanted irreversible retinal damage (e.g., to the photoreceptors) and to improve clinical handling, a real-time dosimetry is desirable to monitor laser-induced RPE damage during the treatment. Schüle have performed optoacoustic monitoring of microbubble formation during SRT.9 For the optoacoustic technique, a modified contact lens with an integrated ultrasonic transducer is required. For the spot sizes currently used, the thermoelastic pressure response of the tissue due to rapid thermal expansion (without a phase transition) is much larger than the pressure waves originating from transient microbubbles slightly above the RPE damage threshold. Therefore, a burst of laser pulses is required to detect the statistic microbubble-induced pressure transients as small fluctuations on the mean thermoelastic tissue response.9 To overcome the drawbacks of optoacoustic dosimetry control, we alternatively investigated an optical technique for monitoring bubble formation in the RPE. As a first step toward a noncontact optical dosimetry control, the aim of this study was to evaluate whether laser-induced RPE cell death can be detected in an ex vivo porcine RPE model close to the threshold radiant exposure for cell death by means of an interferometric technique. Furthermore, the bubble dynamics in the RPE are interferometrically and optoacoustically investigated for two laser pulse durations, because the optimum laser pulse duration for SRT is still unknown.18 Detailed knowledge of the bubble dynamics helps to determine the damage range in the ocular tissue as a function of the irradiation parameters and might serve for minimization of the collateral damage during SRT. 2.Material and MethodsA Michelson interferometer is employed to monitor the motion of reflecting interfaces at the RPE cell layer during and after pulsed irradiation. A RPE sample is placed at the end of the interferometer’s sample arm (Fig. 1 ). This technique provides information on the surface motion of the RPE itself as well as on the bubble formation at the strongly heated intracellular melanosomes. If a bubble nucleates, light is reflected at its interface due to the difference of the refractive indices between the vapor inside the bubble and the surrounding cytoplasm.19 The motion of this reflecting interface causes a change of the interference pattern at the photo detector. With a difference in length between the reference and sample arm, , the detected intensity at the photodiode is where is the laser wavelength; is the refractive index of the medium in the sample arm (Fig. 1: in air, in water and RPE cells); , are the intensities in the reference and in the sample arm. The Doppler shifted frequency of the light reflected at a moving interface is given bywhere is the velocity of the reflecting interface; is the frequency of the incident light, and is the speed of light in a vacuum. At the photodiode, a modulation frequency ofis detected. Using a helium-neon laser the modulation frequency per velocity results toThe bubble nucleation temperature at the melanosomes in the RPE was determined in previous experiments to be .20 Because the typical bubble expansion velocities in superheated water are a few meters per second,21, 22 we expect modulation frequencies in the range of several megahertz.2.1.Ex vivo RPE modelRPE explants were used for this study. Freshly enucleated porcine eyes from the local abattoir were dissected. The RPE samples had a size of approximately containing retina, choroid, and sclera. A few drops of isotonic solution were added. After a few minutes, the neural retina can be easily detached without damage to the underlying RPE cells. The neural retina was carefully removed to expose the RPE layer. After irradiation of the RPE explants, a fluorescence viability assay was performed with diluted Calcein-AM (Molecular Probes, 1:500 in phosphate-buffered saline without , , per RPE sample). Calcein-AM can pass the cell membrane. Living cells metabolize nonfluorescing Calcein-AM to fluorescing calcein (excitation maximum: ; emission maximum: ), which is unable to diffuse out of the cell as long as the cell membrane integrity is maintained. After an incubation time of approximately the explant can be analyzed under the fluorescence microscope: Living cells with an intact membrane appear bright. 2.2.Experimental SetupThe experimental setup for irradiation of RPE explants is shown in Fig. 1. Bubbles can be detected simultaneously by interferometry and optoacoustics. A modified frequency doubled, -switched neodymium: yttrium lithium fluoride laser (Quantronix Inc. Model 527DP-H, ) served for irradiation. The laser pulse duration can be varied in the range from to by an active feedback system controlling the intracavity losses during the laser pulse.23 The pulses are transmitted by a fiber [Ceram Optec, Optron UV-A 105/125A/250, length , numerical aperture ]. The pulse energy can be adjusted with a variable attenuator. Spatially almost homogeneous irradiation, which is important for measuring threshold radiant exposures, is achieved by locating the optical image of the fiber tip and the RPE explants in the same plane. Because of the long fiber, the spatial modulation of the radiant exposure due to speckle is below 10% at the specimen. The laser spot size on the RPE explants is reduced using an elliptical field aperture. An elliptical spot with diameters of and is obtained on the RPE sample. For determination of the laser spot size, a slide micrometer scale was placed in the water-filled cuvette and the laser spot on the reflecting microscope slide was observed by the charge-coupled device (CCD) camera (Fig. 1). A photodiode (Centronics AEPX 65) with a current integrating circuit is used to determine the laser pulse energy, calibrated to an energy meter (Ophir Optronics, Laserstar PE 10). The RPE tissue samples are mounted in a cuvette with isotonic solution on a three-axis translation stage. The explants are irradiated with single laser pulses and radiant exposures up to . The laser pulse durations (full width at half maximum) used in the experiments are and . Typical pulse shapes can be found in a previous publication on bubble nucleation around isolated RPE melanosomes.20 A helium-neon laser (Laser Graphics LK 8623, ) is used as the light source for the interferometer. The beam passes a 50/50 beamsplitter. A quartz glass plate serves as a mirror in the reference arm. The probe beam ( laser) is coupled into the irradiation setup by a dichroic mirror and is focussed by a lens (focal length ) into the image plane of the fiber tip at the RPE explant. The Gaussian spot diameter on the sample is approximately . A power of about is measured at the site of the RPE sample. Both laser spots (pump and probe beam) can be monitored and aligned on a reflecting test object using a CCD camera (Hamamatsu Photonics C5405). The sample arm of the interferometer is chopped with a duty cycle of : synchronized to the laser pulses. This technique avoids heating of the RPE explants by the probe laser. The interference fringes are detected by a photodiode with an integrated preamplifier (Hamamatsu Photonics S6468-02), which has a upper cutoff frequency of . The laser light, which is partially reflected from the RPE tissue, is blocked by a bandpass filter with a center wavelength of in front of the photodiode. The interferometer is aligned by means of the quartz glass plate serving as mirror in the reference arm. The plate is mounted on a piezoelectric actuator and can be set to vibration to obtain an interference signal without any movement of reflecting interfaces in the sample arm. This configuration was used to optimize the interference amplitude before RPE irradiation. The piezoelectric actuator was switched off for the interferometric measurements during laser exposition. Optoacoustic transients are recorded with an ultrasonic broadband transducer (Valpey-Fisher VP-1093, , Preamplifier Panametrics 5676). The acoustic transients provide information on the bubble incipience and collapse, which can be identified as pressure peaks.24 The optoacoustic data are complementary to the interferometric transients, because a low signal-to-noise ratio is expected at bubble incipience and collapse for the interferometric measurements, when the amount of backscattered light is minimal due to the small bubble size. Therefore, the consistency of the interference data can be confirmed by the acoustic measurements. The distance between the RPE sample and the transducer was approximately . Interferometric and optoacoustic transients are sampled with a digital oscilloscope (Tektronix TDS 540). We irradiated RPE explants of different eyes for both pulse durations. The number of irradiated cells (including partly irradiated) per laser exposition is 5 to 12. This value was estimated after the viability assay (Sec. 2.1) by a comparison between the laser spot diameter and the size of the stained RPE cells as observed by fluorescence microscopy (e.g., Fig. 2 ). The number of dead cells per laser exposition was obtained by the viability assay described in Sec. 2.1. The radiant exposure for cell death, which indicates death to 50% of the irradiated cells, and the associated probit slopes were determined by standard probit analysis.25, 26 Fig. 2Left: Fluorescence microscope image taken after irradiation with a pulse duration of . The laser pulse is emitted at on the time axis. Dead RPE cells appear dark. The white ellipse represents the spot size of the laser beam on the RPE explant. Right: Corresponding interferometric transients at [(a) no dead cells], at [(b) 4 dead cells], and at [(c) 5 dead cells]. The interference signal was ac coupled to the oscilloscope to eliminate the dc component .  3.Results3.1.Threshold for Cell DeathFor pulses, 52 laser expositions were applied on 3 different RPE explants. The overall threshold radiant exposure for cell death was and the corresponding probit slope . A total of 146 laser expositions on 5 RPE explants resulted for pulses in and . Both radiant exposures are in good agreement with previous measurements reported by Brinkmann, 23 who used similar laser pulse durations (Table 1 ). Sliney found that typical probit slopes for retinal damage have values between 1.05 and 1.15,26 which is consistent with our results. Table 1ED50 radiant exposures for cell death at various pulse durations (λ=527nm) . Representative interference amplitudes due to the irradiation with a laser pulse duration of are shown in Fig. 2. The corresponding viability stained RPE cells are also depicted. Similar interferometric transients were obtained for a pulse duration of (data not shown). The three representative interferometer traces in Fig. 2 are recorded at (Trace A: no dead cells), at (Trace B: 4 dead cells), and (Trace C: 5 dead cells). Figure 2 suggests that the threshold radiant exposure for cell death of this specific RPE explant is between and , which is consistent with the overall threshold value of for pulses. Interference fringes caused by random mechanical vibration throughout the experimental setup are in the millisecond domain. These random fringes do not influence the interferometric transients resulting from laser-induced RPE effects, which last only a few microseconds [Figs. 2b, 2c]. At a radiant exposure increase of only 6% in Fig. 2b compared to Fig. 2a. , a transient intensity modulation is detected in the interference signal as opposed to sublethal irradiation in Trace A. With increasing radiant exposure, an amplitude modulation with frequencies of more than can be observed in the interferometric transients during and after the laser pulse [Fig. 2c]. Since the bubble nucleation temperature at the strongly absorbing RPE melanosomes was determined to be ,20 a maximum laser-induced temperature increase without bubble formation of can be assumed in our experiments. Using the linear thermal expansion coefficient of water and a thickness of for the pigmented part of the RPE, we obtain as an upper estimation for the thermal expansion of the RPEBecause typical bubbles growing around single melanosomes have diameters of a few micrometers, 20, 27, 28, 29 a pure thermal expansion does not contribute significantly to the interferometric transient. Thus, all detected surface displacements with [e.g., Fig. 2c] can be expected to have a pure thermomechanical origin. According to this criterion, a pure thermal origin cannot be excluded for Trace B in Fig. 2. But for a pure thermal process (thermal expansion), the increase of 6% in radiant exposure from Trace A to Trace B would imply that Trace A would have nearly the same shape as Trace B, because the temperature increase is proportional to the applied radiant exposure. Therefore, the threshold behavior in the shape of the interference trace between A and B suggests a thermomechanical origin of Trace B.All interference traces were processed for quantification by the LabVIEW environment (LabVIEW 6i, National Instruments). Each transient was digitally bandpass filtered to to eliminate low frequency interferometer fringes due to random vibration of the setup and high frequency electronic noise. Subsequently, the signal energies were calculated according to where the zero point on the timescale is defined by the laser pulse. Our choice of , which has no deeper physical reason, accounts for high frequency [e.g., Fig. 2c] and low frequency oscillations [e.g., Fig. 2b] in the interference trace, which are both correlated to cell death. For both pulse durations, the plot of the interferometric signal energy versus the radiant exposure shows a strong increase at the occurrence of cell death (Fig. 3 ). These graphs also reveal that in a certain interval around the threshold for cell death both cell disintegration and cell survival can occur at the same radiant exposure. Plotting the obtained signal energies as a function of the number of dead cells per laser exposition (Fig. 4 ), a common threshold value of is chosen to distinguish between dead and vital cells. Larger values than indicate that cell death occurred. With this threshold value, less than 10% false negatives and false positives are obtained in Fig. 4.Fig. 3Signal energies of the interferometric transients plotted with respect to the applied radiant exposure [(a) , (b) ]. The signal energy strongly increases at the occurrence of cell death. 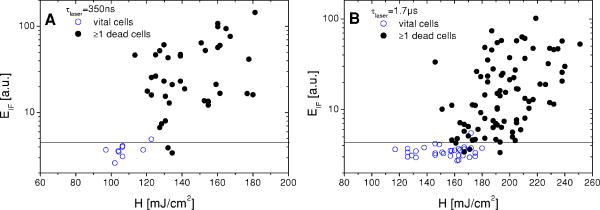 Fig. 4Signal energies of the interferometric transients plotted over the number of dead cells per laser exposition [(a) , (b) ]. The chosen threshold of the signal energy , which serves as criterion for cell death, is plotted as a horizontal line. Data points corresponding to the traces depicted in Fig. 2 are labeled.  3.2.Bubble DynamicsIn Fig. 5 , representative interferometric and optoacoustic transients resulting from an irradiation four times above the threshold for cell death are depicted. The laser pulse duration was . According to Eq. 1, every full period in the interference signal [Fig. 5a] corresponds to a change in the optical path difference of , that is, to a bubble interface displacement of half a probe laser wavelength in water. In order to check for internal interference effects in the sample arm (e.g., between the front and the back interface of a bubble, which can act as a Fabry-Perot interferometer30), the light in the reference arm of the interferometer was blocked, temporarily. In that case, no interference fringes were detected. Fig. 5Bubble formation due to a radiant exposure of (about above the threshold for cell death). The laser pulse with a duration of is also plotted. (a) Interferometric transient. (b) Optoacoustic transient corrected by its acoustic transit time to the hydrophone. Note that the interference amplitude in Fig. 5a is 10 times larger than in Fig. 2 displaying the same arbitrary units (a.u.). 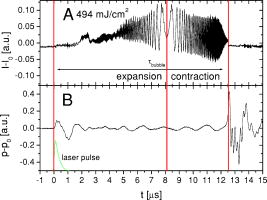 At radiant exposures of more than about two times above threshold for cell death shortly after the laser pulse [Fig. 5a: 0 to ] only irregular interference fringes without a well-defined (instantaneous) frequency were observed [comparable to Fig. 2c]. In this time interval, the motion of a bubble interface cannot be determined from the interferometric transients. Fast flash photography of irradiated RPE cell fragments reveals29 that many microbubbles nucleate around individual melanosomes, which results in a rough reflecting interface. As a consequence, the interferometer signals of all individual bubbles are superimposed with nonstationary phase differences and are spatially averaged on the photodiode. After this period of time, well-defined interference fringes can be observed [Fig. 5a: ], because a smooth reflecting interface has formed, that is, the microbubbles have coalesced to a larger bubble and its surface is smoothed by the surface tension. This process of bubble coalescence was observed during fast flash photography of RPE cell fragments.29 In this case, the interferometric approach allows monitoring of the coalesced bubble’s dynamics with a high temporal resolution, which is demonstrated in Ref. 28: The initial frequency decrease in the interference trace [Fig. 5a: 4 to ] indicates that the bubble expansion becomes slower. Simultaneously, the interference fringes show increasing amplitudes, because the area from which light can be reflected is increasing with bubble size. The interferometric transient also shows a small increase of the baseline due to this increasing reflecting area. A turning point in the interference trace can be found at after the laser pulse. This point marks the onset of the coalesced bubble’s contraction. The contraction velocity of the bubble increases, which can be deduced from the growing modulation frequency. The vanishing of the interference fringes at [Fig. 5a] coincides with a peak in the transit time corrected pressure signal [Fig. 5b]. Such a pressure peak is typically emitted at the bubble collapse.24 These simultaneous events confirm that the interference fringes originate from the dynamics of the coalesced bubble. Furthermore, it can be deduced from the point when the laser pulse is applied (and the microbubbles begin to grow, ), the turning point at and the bubble collapse at in Fig. 5a that the bubble expansion takes longer than the bubble contraction. Well-defined interference fringes were observed for radiant exposures above at a laser pulse duration of [Fig. 5a]. For interference traces, which were recorded for radiant exposures in the range between and , the mean ratio of the bubble collapse time to the bubble lifetime was . Both techniques, optoacoustics and interferometry, were used to determine the bubble lifetimes at radiant exposures near the threshold irradiation for cell death. Figure 6 shows interferometric and transit time corrected optoacoustic traces. The bubble lifetime can be clearly deduced from the pressure peaks occurring at bubble nucleation and bubble collapse in the optoacoustic transient. Such a transient bubble produces high frequency oscillations of about in the interference trace. After the bubble has collapsed, which can be seen in the transit time corrected acoustic transient, this region of high frequency oscillations is sometimes followed by low frequency oscillations in the range of up to [Fig. 6b, Fig. 2c ; low frequency oscillations: ; Fig. 5a: ]. These low frequency interference fringes might be produced by small permanent residual bubbles31 or by surface waves of the RPE cell layer originating from the bubble collapse. However, bubble lifetimes, which were extracted consistently from the interferometric and the optoacoustic measurements (e.g., Fig. 5, Fig. 6), are plotted in Fig. 7 as a function of the normalized applied radiant exposure. For bubble lifetimes below 2 to , no well-defined bubble collapse can be observed in the optoacoustic signal. Only in this case was the bubble lifetime solely determined by interferometry. The transition to well-defined interference traces might indicate that major bubble coalescence occurs at bubble lifetimes of more than 2 to . The graph in Fig. 7 shows an approximately linear increase of the bubble lifetime with radiant exposure in the investigated range. The thresholds for cell death are different for and laser pulses (Sec. 3.1). However, after normalizing the radiant exposure to these radiant exposures for both pulse durations, no major differences in the bubble lifetimes between both pulse durations remain. Fig. 6Representative interferometric and transit time corrected optoacoustic transients obtained at radiant exposures of (a) and (b), which are slightly above the for cell death (Sec. 3.1). The laser pulse, which is plotted at the bottom of each graph, has a duration of . The bubble lifetimes can be deduced consistently from the pressure peaks in the optoacoustic transient and the high frequency oscillations in the interferometric transient. (b) Sometimes low frequency oscillations can be observed in the interference trace after the bubble collapse .  Fig. 7Bubble lifetimes obtained from interferometric and optoacoustic measurements as a function of the applied radiant exposure, which is normalized to the threshold irradiation for cell death (Sec. 3.1).  3.3.Extent of RPE DamageThe number of dead cells per laser exposition is obtained from the viability assays and is plotted in Fig. 8 with respect to the applied radiant exposure and the bubble lifetime, respectively. An increasing number of dead cells, which describe the lateral damage range in the RPE, can be observed when applying higher radiant exposures. As a simple approximation all measurements were interpolated by a linear fit. This provides a better comparison between the results for different pulse durations. For both pulse durations, and , more than 12 cells are killed per laser exposition above about 1.5-fold threshold for cell death and for bubble lifetimes longer than 4 to (Fig. 8). In that case, the cell damage extended beyond the irradiated area. Note that a bubble lifetime of corresponds according to the Rayleigh formula for inertia limited bubble growth21 to a bubble diameter of at the point of maximum bubble extension when using the ambient pressure , the saturated vapor pressure at ambient temperature and a water density of . Although the Rayleigh formula is strictly valid only for temporal symmetric bubble dynamics, it should give an estimation of the bubble size for the observed temporal asymmetric bubble dynamics. The estimated bubble size of about is comparable to the laser spot size, which is used in the experiment.Fig. 8(a1) and (b1): Number of dead RPE cells plotted as a function of the radiant exposure. The gray bar in each graph marks the range of the number of irradiated cells (including partly irradiated) per laser exposition ((a) , (b) ). (a2) and (b2): Dead RPE cells as a function of the bubble lifetime. For a better comparison between both pulse durations, all measurements were interpolated by a first order fit as a simple approximation.  4.Discussion4.1.Threshold for Cell DeathThe detection of microbubbles, as performed here by interferometry, strongly correlates to the occurrence of cell death determined by the viability assay (Fig. 4). This confirms previous experiments, in which microbubbles in the RPE were detected acoustically17 and reflectometrically.16 In these studies, microbubble formation was also required for the occurrence of cell death, if the pulse duration was below the range of 20 to .16, 17 These findings support the hypothesis that microbubble formation is the origin of cell death for the pulse durations applied in this experiment. Because the applied laser pulse durations do not completely fulfill the condition of thermal confinement for the melanosome, an appreciable amount of heat diffuses during irradiation from the strongly absorbing melanosomes to the aqueous surrounding.20, 23 As a consequence, a higher radiant exposure is required for longer pulses to reach the nucleation temperature.20, 23 The threshold for cell death increases with the laser pulse duration in the investigated range (Table 1). 4.2.Bubble Dynamics and Damage RangeIn contrast to optoacoustics and reflectometry, interferometry can provide information on the motion of the bubble interface. Especially the point in time when the maximum bubble extension occurs [Fig. 5a] can be determined. These data revealed that the expansion of laser-induced bubbles in the RPE, which includes the coalescence of microbubbles, takes longer than its contraction. This temporal asymmetry was also confirmed by time-resolved microscopy during irradiation of isolated RPE cell fragments;29 whereas typically the dynamics of a single laser-induced cavitation bubble in a fluid without solid boundaries are temporally symmetrical.32 The temporally symmetric spherical bubble dynamics go along with a minimal expansion and collapse time.24 If the bubble collapse is disturbed, for example, by a solid boundary near the bubble, the collapse lasts longer than the expansion.24 Because the bubble expansion in the RPE lasts longer than the collapse, the reason for the temporally asymmetrical bubble dynamics might be the coalescence of microbubbles after nucleation, which disturbs the bubble expansion. Because temporal unsymmetrical bubble dynamics were also observed in isolated RPE cell fragments in aqueous suspension,29 it is very unlikely that the elastic-plastic properties of the neighboring tissue are responsible for the temporal asymmetry of the bubble in the RPE explants. The selective RPE damage was originally thought to be a thermal effect,7 and therefore, microsecond laser pulses were preferred for clinical SRT.33 Recent investigations16, 17 and these experiments indicate that bubble formation is responsible for the cell damage. In this context, the question emerged whether thermomechanical damage owing to bubble expansion such as choroidal hemorrhage and disruption of the neuroretina might occur when using shorter laser pulses for SRT. This study shows that the bubble lifetime increases almost linearly with increasing radiant exposure (Fig. 7). As far as bubbles have coalesced and a well-defined collapse can be observed in the optoacoustic transients ( to ), it can be assumed that the measured bubble lifetime is correlated to the bubble size.27, 28, 29 So, the damage range in the tissue, which is determined by the bubble size, finally depends on the bubble lifetime. Figure 8 also supports this correlation. The maximum bubble size, which still avoids irreversible photoreceptor damage, is unknown. However, a major difference in the bubble lifetime between the two investigated pulse durations was not found (Fig. 7). From this point of view, both pulse durations should be equally suitable for SRT assuming that the bubble dynamics are transferable from porcine RPE explants to human RPE in vivo. Animal studies with rabbits by Framme 34 also support the hypothesis that laser pulses of a few hundred nanoseconds are appropriate for SRT. Framme and coworkers defined a safety range for SRT by the ratio of the radiant exposures for 84% probability of fluorescein angiographic to 16% probability of ophthalmoscopic visibility of the laser expositions. Ophthalmoscopic visibility indicates photoreceptor damage; whereas angiographic visibility is an indicator for RPE barrier damage. They found that this safety range is even larger for pulses than for pulses. 4.3.Dosimetry Control for SRTThe RPE damage, which is the primary process of SRT, goes along with the formation of transient laser-induced bubbles. Because the threshold for laser-induced RPE damage varies inter- and intraindividually and because there might be only a small safety range for SRT, a dosimetry control for SRT is required to avoid collateral damage, for example, to the photoreceptors. If microbubble formation can be monitored at the threshold for cell death, it can be used as criterion for RPE damage. We calculated and compared this value to a threshold level of . This algorithm was capable of discriminating between the occurrence of cell death and sublethal laser exposure in more than 90% of the applied laser expositions when defining a proper threshold value for (Fig. 4). Thus, such an interferometer might serve as an online dosimetry control during SRT. Movements of the patient’s eye during SRT should cause no major complications for the interferometric bubble detection, because these are of the millisecond rather than the microsecond time range. For slit lamp adaptation, the interferometer setup can be implemented as a fiber interferometer, which minimizes the effect of random vibration on the interferometer. The probe laser could serve simultaneously as an aiming laser for SRT. Because the microbubbles around the melanosomes nucleate during the laser pulse,20 even the SRT treatment laser might serve simultaneously as a probe laser. The detection of bubbles by interferometry should be more sensitive than measuring only the increase of the light, which is backscattered from the bubble interfaces,16, 19 because a fast surface motion in the order of the probe laser wavelength without any change of the reflected intensity is sufficient for the occurrence of interference fringes. Additional noncoherent ambient light should not significantly influence the interferometric measurement, because it does not contribute to the interference. However, interferometric measurements in vivo might be complicated by photoreceptor tissue in front of the RPE, which scatters rather than absorbs the incident light.35 In this case, the choice of the interferometer wavelength can be optimized toward longer wavelengths in order to reduce scattering at the photoreceptors. A decreased signal-to-noise ratio of the detected interferometric transients is expected when the RPE is located out of the focus plane of the probe laser, because less reflected light is collected by the interferometer optics. A coherence length of the interferometer laser, which is in the range of a few millimeters, might also help to increase the reliability the interferometric bubble detection by avoiding unwanted interference effects between other reflecting interfaces than the bubble surface (e.g., at the surface of the cornea). However, a difference in the optical path length between the sample arm and the reference arm of the interferometer, which is shorter than the coherence length of the probe laser, is required. In contrast to the optoacoustic detection of microbubbles, which has already been evaluated as a dosimetry control for SRT,9 interferometry works in a noncontact mode. For this reason it can also be implemented in noncontact treatment modalities for SRT such as in a scanning digital ophthalmoscope. Furthermore, the optoacoustic dosimetry control depends on pulse-to-pulse fluctuations of the optoacoustic tissue response during irradiation with a burst of laser pulses. As opposed to optoacoustics, the interferometric technique should also work when applying single laser pulses as shown in Fig. 4. The spatial resolution of the interferometer is only limited by the spot size of the probe laser. Therefore, this technique should be applicable to small spot sizes, for which the optoacoustic signal-to-noise ratio is not sufficient for the detection of a few or even a single transient mircobubble. The interferometric bubble detection might also be appropriate for SRT performed by a fast scanned continuous wave laser with spot diameters of only .36, 37 5.ConclusionA novel interferometric technique for noncontact monitoring of transient microbubbles was introduced. Laser-induced bubble formation in the RPE was sensitively detected by this interferometric technique in a porcine ex vivo RPE model. Microbubble formation was deduced from the signal energy of the interferometric transients, which correlates with cell viability in more than 90% of the applied laser expositions. Thus, this technique seems to be appropriate for a noncontact online dosimetry control during SRT, but it has to be optimized for in vivo application. An online dosimetry control, which allows for the detection of individual thresholds for RPE damage during treatment, enables the application of radiant exposures slightly above threshold for RPE cell death. This approach will help to minimize collateral damage to the adjacent photoreceptors. Additionally, bubble dynamics can be revealed by interferometry. Interferometric transients provide information on the bubble lifetime and, in case the microbubbles have coalesced, the point in time when the maximum bubble extension occurs. Temporal asymmetrical bubble dynamics were observed. There were no major differences in the bubble dynamics between and laser pulses. The lateral damage range in the RPE was determined by viability assays as a function of the radiant exposure and the bubble lifetime. Our experiments indicate that a pulse duration of does not have less collateral damage than . At bubble lifetimes of more than at about 1.5-fold radiant exposure for cell death, lateral damage to surrounding, nonirradiated cells was found. A pulse duration of is currently applied in clinical SRT. These experiments suggest that pulses might also be appropriate for clinical SRT, assuming that the results gained from porcine RPE explants can be transferred to humans. The bubble lifetime as a function of the laser pulse duration can be determined in vivo by the interferometric bubble detection. Because the bubble lifetime is strongly correlated to the damage range in the tissue, the optimum laser pulse duration for minimum collateral damage of the neural retina during SRT can be found. Even for cellular nanosurgery, information on transient microbubble formation may be useful to control or avoid collateral damage.38 AcknowledgmentOne of the authors (J.N.) was partially supported by a fellowship of the FAZIT-Stiftung, Frankfurt am Main, Germany. ReferencesR. R. Anderson and
J. A. Parrish,
“Selective photothermolysis: Precise microsurgery by selective absorption of pulsed radiation,”
Science, 220 524
–527
(1983). 0036-8075 Google Scholar
J. A. Parrish,
R. R. Anderson,
T. Harrist,
B. Paul, and
G. F. Murphy,
“Selective thermal effects with pulsed irradiation from lasers: from organ to organelle,”
J. Invest. Dermatol., 80
(6), 75s
–80s
(1983). 0022-202X Google Scholar
J. Roider,
R. Brinkmann, and
R. Birngruber,
“Selective retinal pigment epithelium laser treatment,”
Lasers in Ophthalmology—Basic, Diagnostic and Surgical Aspects, 119
–129 Kugler Publications: The Hague (2003). Google Scholar
M. A. Latina and
J. A. J. Tumbocon,
“Selective laser trabeculoplasty: A new treatment option for open angle glaucoma,”
Curr. Opin. Ophthal., 13 94
–96
(2002). Google Scholar
M. A. Latina and
C. Park,
“Selective targeting of trabecular meshwork cells: In vitro studies of pulsed and cw laser interactions,”
Exp. Eye Res., 60 359
–371
(1995). 0014-4835 Google Scholar
C. P. Lin,
M. W. Kelly,
S. A. B. Sibayan,
M. A. Latina, and
R. R. Anderson,
“Selective cell killing by microparticle absorption of pulsed laser irradiation,”
IEEE J. Sel. Top. Quantum Electron., 5
(4), 963
–968
(1999). https://doi.org/10.1109/2944.796318 1077-260X Google Scholar
J. Roider,
F. Hillenkamp,
T. Flotte, and
R. Birngruber,
“Microphotocoagulation: Selective effects of repetitive short laser pulses,”
Proc. Natl. Acad. Sci. U.S.A., 90 8643
–8647
(1993). 0027-8424 Google Scholar
R. Brinkmann,
J. Roider, and
R. Birngruber,
“Selective retina therapy (SRT)—A review on methods, techniques, preclinical and first clinical results,”
Bull. Soc. Ophthalmol., Google Scholar
G. Schüle,
H. Elsner,
C. Framme,
J. Roider,
R. Birngruber, and
R. Brinkmann,
“Optoacoustic real-time dosimetry for selective retina treatment,”
J. Biomed. Opt., 10
(6), 064022
(2005). https://doi.org/10.1117/1.2136327 1083-3668 Google Scholar
H. G. I. Elsner,
E. Poerksen,
C. Klatt,
A. Bunse,
D. Theisen-Kunde,
R. Brinkmann,
P. Hamilton,
R. Birngruber,
H. Laqua, and
J. Roider,
“Functional and angiographic findings in patients with diabetic maculopathy treated with selective-RPE-laser-treatment (SRT),”
Invest. Ophthalmol. Visual Sci., 45 4105
(2004). 0146-0404 Google Scholar
T. Ong,
M. Liew, and
P. Hamilton,
“A novel neodymium: yttrium, lithium, fluoride laser for selective retinal pigment epithelium (RPE) treatment in diabetic maculopathy,”
Invest. Ophthalmol. Visual Sci., 45 4166
–B627
(2004). 0146-0404 Google Scholar
R. J. Olk,
“Argon green versus krypton red modified grid laser photocoagulation for diffuse diabetic macular edema,”
Ophthalmology, 97
(9), 1101
–1113
(1990). 0161-6420 Google Scholar
J. Roider,
R. Brinkmann,
C. Wirbelauer,
H. Laqua, R. Birngruber,
“Retinal sparing by selective retinal pigment epithelial photocoagulation,”
Arch. Ophthalmol. (Chicago), 117
(8), 1028
–1034
(1999). 0003-9950 Google Scholar
A. J. Welch,
“The thermal response of laser irradiated tissue,”
IEEE J. Quantum Electron., 20
(12), 1471
–1481
(1984). https://doi.org/10.1109/JQE.1984.1072339 0018-9197 Google Scholar
R. Birngruber,
F. Hillenkamp, and
V.-P. Gabel,
“Theoretical investigations of thermal retinal injury,”
Health Phys., 48
(8), 781
–796
(1985). 0017-9078 Google Scholar
C. Alt,
C. M. Pitsillides,
J. Rögener, and
C. P. Lin,
“Monitoring intracellular cavitation during selective targeting of the retinal pigment epithelium,”
Proc. SPIE, 4951 48
–55
(2003). 0277-786X Google Scholar
G. Schüle,
M. Rumohr,
G. Hüttmann, and
R. Brinkmann,
“RPE damage thresholds and mechanisms for laser exposure in the microsecond to millisecond time regimen,”
Invest. Ophthalmol. Visual Sci., 46
(2), 714
–719
(2005). https://doi.org/10.1167/iovs.04-0136 0146-0404 Google Scholar
C. P. Lin,
“Selective absorption by melanin granules and selective cell targeting,”
Lasers in Ophthalmology—Basic, Diagnostic and Surgical Aspects, 91
–98 Kugler Publications: The Hague (2003). Google Scholar
J. Rögener,
R. Brinkmann, and
C. P. Lin,
“Pump-probe detection of laser-induced microbubble formation in retinal pigment epithelium cells,”
J. Biomed. Opt., 9
(2), 367
–371
(2004). https://doi.org/10.1117/1.1646413 1083-3668 Google Scholar
J. Neumann and
R. Brinkmann,
“Boiling nucleation on melanosomes and microbeads transiently heated by nanosecond and microsecond laser pulses,”
J. Biomed. Opt., 10
(2), 024001
(2005). https://doi.org/10.1117/1.1896969 1083-3668 Google Scholar
M. S. Plesset and
A. Prosperetti,
“Bubble dynamics and cavitation,”
Annu. Rev. Fluid Mech., 9 145
–185
(1977). https://doi.org/10.1146/annurev.fl.09.010177.001045 0066-4189 Google Scholar
R. I. Nigmatulin, Dynamics of Multiphase Media., 1 Hemisphere Publishing Cooperation, New York (1991). Google Scholar
R. Brinkmann,
G. Hüttmann,
J. Rögener,
J. Roider,
R. Birngruber, and
C. P. Lin,
“Origin of retinal pigment epithelium cell damage by pulsed laser irradiance in the nanosecond to microsecond time regimen,”
Lasers Surg. Med., 27
(5), 451
–464
(2000). https://doi.org/10.1002/1096-9101(2000)27:5<451::AID-LSM1006>3.0.CO;2-1 0196-8092 Google Scholar
A. Vogel and
W. Lauterborn,
“Acoustic transient generation by laser-produced cavitation bubbles near solid boundaries,”
J. Acoust. Soc. Am., 84
(2), 719
–731
(1988). https://doi.org/10.1121/1.396852 0001-4966 Google Scholar
D. J. Finney, Probit Analysis, 3rd ed.Cambridge University Press, Cambridge (1971). Google Scholar
D. H. Sliney,
J. Mellerio,
V.-P. Gabel, and
K. Schulmeister,
“What is the meaning of threshold in laser injury experiments? Implications for human exposure limits,”
Health Phys., 82
(3), 335
–347
(2002). https://doi.org/10.1097/00004032-200203000-00006 0017-9078 Google Scholar
J. Neumann and
R. Brinkmann,
“Microbubble dynamics around laser heated microparticles,”
Proc. SPIE, 5142 82
–87
(2003). https://doi.org/10.1117/12.499944 0277-786X Google Scholar
J. Neumann and
R. Brinkmann,
“Interferometric non-contact on-line dosimetry control during selective retina treatment (SRT),”
Proc. SPIE, 5695 340
–347
(2005). 0277-786X Google Scholar
J. Neumann and
R. Brinkmann,
“Nucleation and dynamics of bubbles forming around laser heated microabsorbers,”
Proc. SPIE, 5863 19
–27
(2005). 0277-786X Google Scholar
M. Lankers,
E. E. M. Khaled,
J. Popp,
G. Rössling,
H. Stahl, and
W. Kiefer,
“Determination of size changes of optically trapped gas bubbles by elastic light backscattering,”
Appl. Opt., 36
(7), 1638
–1643
(1997). 0003-6935 Google Scholar
J. Roider,
E. El Hifnawi, and
R. Birngruber,
“Bubble formation as primary interaction mechanism in retinal laser exposure with 200ns laser pulses,”
Lasers Surg. Med., 22 240
–248
(1998). https://doi.org/10.1002/(SICI)1096-9101(1998)22:4<240::AID-LSM9>3.0.CO;2-P 0196-8092 Google Scholar
W. Lauterborn,
“Kavitation durch Laserlicht,”
Acustica, 31
(2), 51
–78
(1974). 0001-7884 Google Scholar
J. Roider,
R. Brinkmann,
C. Wirbelauer,
H. Laqua, and
R. Birngruber,
“Subthreshold (retinal pigment epithelium) photocoagulation in macular diseases: A pilot study,”
Br. J. Ophthamol., 84
(1), 40
–47
(2000). https://doi.org/10.1136/bjo.84.1.40 0007-1161 Google Scholar
C. Framme,
G. Schüle,
J. Roider,
R. Birngruber, and
R. Brinkmann,
“Influence of pulse duration and pulse number in selective RPE laser treatment,”
Lasers Surg. Med., 34 206
–215
(2004). 0196-8092 Google Scholar
V.-P. Gabel,
R. Birngruber, and
F. Hillenkamp,
“Visible and near infrared light absorption in pigment epithelium and choroid,”
658
–662
(1978). Google Scholar
R. Brinkmann,
N. Koop,
M. Özdemir,
C. Alt,
G. Schüle,
C. P. Lin, and
R. Birngruber,
“Targeting of the retinal pigment epithelium (RPE) by means of a rapidly scanned continuous wave (cw) laser beam,”
Lasers Surg. Med., 32 252
–264
(2003). https://doi.org/10.1002/lsm.10150 0196-8092 Google Scholar
C. Alt,
C. Framme,
S. Schnell,
H. Lee,
R. Brinkmann, and
C. P. Lin,
“Selective targeting of the retinal pigment epithelium using an acousto-optic laser scanner,”
J. Biomed. Opt., 10
(6), 064014
(2005). https://doi.org/10.1117/1.2136314 1083-3668 Google Scholar
A. Vogel,
J. Noack,
G. Hüttmann, and
G. Paltauf,
“Mechanisms of femtosecond laser nanosurgery of cells and tissue,”
Appl. Phys. B, 81 1015
–1047
(2005). https://doi.org/10.1007/s00340-005-2036-6 0946-2171 Google Scholar
|


