
|
|
1.IntroductionSince the beginning of biomedical optics, the optical properties of tissues and tissue components have been the subject of numerous studies. They are vital parameters for the description of light transport in tissue, which in turn is important for light dosimetry and interpretation of optical imaging techniques.1 Using experimental techniques and their accompanying theories, optical properties such as the absorption coefficient, (reduced) scattering coefficient, and anisotropy factor have been determined for various tissues.2 The key factor in these measurements is the path length that the light has traveled through the tissue. With optical coherence tomography (OCT), the amplitude of the (back) scattered light is measured as a function of the optical path length. Consequently, if the index of refraction of the tissue is known, the physical path length that the light has traveled can be determined. In OCT,3, 4 the combination of the so-called coherence gating with confocal gating drastically reduces the contribution of multiple scattered light. Consequently, OCT allows high resolution imaging of up to 5 to 10 scattering depths in tissue.5 By analysis of the OCT signal in-depth, the attenuation coefficient of the sample can be determined. 5, 6, 7, 8 Recent studies demonstrated that this intrinsic optical property can create a quantitative basis for OCT image interpretation.9, 10 Variations in refractive index serve as a primary source of the scattering in tissue and thus the contrast in OCT imaging. Consequently, knowledge of is important for the understanding and interpretation of OCT images and for improvement of the OCT imaging protocol. Reducing refractive index mismatches has been reported to increase OCT imaging depth in highly scattering tissues such as skin11, 12, 13 and blood.14 In-vivo measurement of the refractive index is also feasible. Tearney introduced a suitable focus-tracking method that used OCT to track the focal-length shift that results from translating the focus of an objective along the optical axis within a medium.15 They used it to determine the refractive index of skin tissue in vivo and it has been further developed by others for application to tissue.16, 17, 18 In a previous study, we reported measurements of with OCT of atherosclerotic plaque constituents within the vascular wall.10, 19 Although both calcifications and lipid-rich regions appear dark, we reported high values for the former and low values for the latter. Based on the appearance of their borders, these vascular structures in an OCT image are morphologically differentiated, i.e., sharply delineated borders are characteristic for a calcification and fuzzy borders for lipid-rich regions.20 To further investigate the nature of these differences, we imaged isolated arterial wall and atherosclerotic plaque components by high-resolution OCT in this study. Measurements of the optical path length were used to determine the values of . The was then used for accurate measurement of with focus-tracking OCT. Furthermore, the effect of temperature changes from room temperature to body temperature on and were assessed. 2.Materials and Methods2.1.Tissues, Phantom, and Sample HandlingHuman carotid arterial samples were collected from the Department of Pathology of the Academic Medical Center of Amsterdam . To avoid tissue deterioration, the samples were obtained within of postmortem examination, and were snap frozen in liquid nitrogen and stored at , similar to the protocol in the study of Cilesiz and Welch.21 To obtain the individual intimal and medial layers, the adventitial layer was removed from the arterial segments , including the external elastic lamina. Subsequently, the intima was carefully separated from the media by blunt preparation. Separation of the different arterial wall layers was verified by OCT imaging [see Figs. 1a and 1b ]. Calcific nodules were harvested from a second set of carotid samples . Arterial segments, in which lipid pools were confirmed by macroscopic observation, were generously supplied by the Utrecht Athero-Express biobank . A monolayered tissue phantom with a biological relevant fatty acid composition was constructed from the triglyceride fraction of ordinary dairy butter. The lipids were either imaged between two glass plates (attenuation measurements) or as a droplet on a heating plate (refractive index measurement). Fig. 1(a) An OCT image of a prepared medial layer. Part of the intima was carefully removed. Fragments of the internal elastic lamina (IEL), the boundary between intima and media, are visible. (b) An OCT image of the intimal segment that was removed from the sample shown in (a). (c) An OCT image of an arterial calcification. The optical path length outside the sample as well as within the sample is indicated. The bars represent .  All experiments were done under controlled temperature, being either room temperature or body temperature . The lipid phantom was studied stepwise from 18 to . The temperature was monitored during the experiments using a thermocouple placed next to the sample. 2.2.Optical Coherence Tomography ImagingThe principle and physics of OCT have been extensively described.3, 20 In our setup, imaging was performed with a high-resolution OCT system using a femtosecond Ti:sapphire laser (Femtosource, Vienna, Austria) with a center wavelength of and a bandwidth of . Axial resolution was ; dynamic range was . The light was delivered via a single mode fiber with a mode field diameter of . The lateral resolution, determined by the spot size of the sample arm beam, was approximately . The measured depth of focus of the sample arm optics was in air. In-depth scanning (A-scan) was performed by a translating mirror in the reference arm, with or without synchronized (and corrected for the index of refraction) movement of the object lens in the sample arm (focus-tracking mode or static mode, respectively). The amplitude and phase of the demodulated signal were digitized and stored in a computer. Each A-scan consisted of 8192 data points. B-scan images were obtained by moving the tissue sample with respect to the fixed sample arm beam while performing A-scans. 2.3.Measurement of Index of RefractionTo determine the index of refraction of (isolated) tissue constituents, OCT imaging of the sample was performed in the static focus mode. During imaging, the sample was positioned on a reflective substrate. If the underlying surface was visible in the OCT image, the (group) refractive index could be determined by measurement of the virtual optical path length outside the sample and the optical path length in the sample , as depicted in Fig. 1c. If the index of refraction of the surrounding medium is known, the index of refraction of the sample can be determined via Using this method, was determined 3 to 5 times in each sample.2.4.Attenuation MeasurementIn a previous study, we demonstrated that the attenuation coefficient could be determined accurately using focus tracking during each A-scan.5 With the determined index of refraction (see before), the OCT system was optimized for focus-tracking imaging of the sample. The colocalization of the coherence gate, given by the reference mirror position, and the confocal gate, given by the sample arm lens position, reduces the contribution of multiple scattered light. For the given range of ’s and thicknesses, the OCT signal is dominated by single scattered light.5 Consequently, the mean heterodyne signal photodetector current , which is proportional to the electric field of the light returning from depth in the sample, can be approximated by . Then, the decay of the OCT signal with depth simply follows the Lambert-Beer law: To obtain , a region of interest (ROI) with a horizontally flat surface of the image was selected and the average of up to 100 adjacent A-scans was taken from the ROI in each OCT B-scan. No alignment of the A-scans was performed. With a Levenberg-Marquardt curve-fitting algorithm, Eq. 2 (with added offset and amplitude to facilitate scaling) was fitted to the OCT signal within the ROI, with as the fitting parameter. To reduce the effect of the number of A-scans averaged in the ROI, the standard deviation in the ROI was used for weighting in the fitting procedure. During the fitting procedure, the offset was fixed at the average noise level of the recorded data and the amplitude was free running.2.5.Interpretation of the Fitting Procedure and Statistical AnalysisThe best estimates of the fitted parameters are found by minimizing , the sum of squared, weighted residuals using an iterative process implemented by the Levenberg-Marquardt method. Next to the best estimates, 95% confidence intervals (CI) are calculated for each fitted parameter. These confidence intervals indicate that the best-fit value of the parameter is expected to fall within this interval 95 out of 100 times when the fitting is repeated on another dataset from the same sample. In our analysis, we further included the fit as a whole and goodness-of-fit criteria such as the correlation coefficient , a test, a runs test, and a Shapiro-Francia test. As in our previous study,5 the outcome of this analysis is used to judge the validity of the obtained attenuation coefficient. Single-fit data are given with the 95% confidence interval. All mean data are presented with standard deviation. The statistical significance of the differences between the means of the measurements was tested with a paired student’s T-test. 3.ResultsThe different components of the vessel wall were successfully isolated and imaged using OCT (Fig. 1). The high-resolution OCT images were used to verify that the different tissue components were indeed well separated [Figs. 1a and 1b]. When the underlying surface was visible, the index of refraction of the arterial wall and plaque components could be determined using formula 1 [Fig. 1c]. The results of the refractive index measurements are presented in Table 1 , along with reference values for better interpretation. The indexes of intima and media at are in line with measurements of comparable tissues ( and , respectively). Calcifications have a much higher index of refraction, . The higher standard deviation could be attributed to the inhomogeneous structure of the calcifications. The lipid pool and lipid phantom have indexes in the same range ( , and , respectively). Increasing the temperature from 18 to resulted in a decrease in in all samples, with the most remarkable temperature dependent decrease in the lipid phantom. Table 1The refractive index of individual layers of the vascular wall, atherosclerotic plaque constituents, and the lipid phantom. Measurements were done at 18 and 37°C . For better interpretation, previously estimated or measured values of comparable tissue structures are also given. For media, lipid pool, and lipid phantom, the results under the n measured at 37°C was smaller than measured at 18°C , p<0.05 .
Using the known index of refraction and the focus-tracking mode, the of the isolated arterial and plaque segments could be determined (Fig. 2 ), except for the lipid pools. Due to the consistency and behavior of the lipid material, it was difficult to retrieve lipid lesions from the diseased arterial wall samples. Furthermore, when retrieved from the specimen, the isolated lipid material was highly deformed and disorganized. Consequently, no reliable measurement of could be done. The values of at are consistent with data reported in earlier studies.10, 19 In all studied samples, a decrease in is observed when increasing the sample temperature. This temperature-dependent decrease in was statistically significant in intima, media, and lipid phantom. To follow this trend more precisely, extensive measurements were performed on the lipid phantom. As can be observed in Fig. 3 , the gradual decrease in with increasing temperature coincides with a decrease in . Fig. 2The results of the measurements at (gray bars) and (black bars). The values of in situ measurements from Ref. 10 are also depicted (white bars). For lipid, fit values measured in the lipid phantom are presented next to the lipid pool measurements from Ref. 10. Error bars represent the standard deviation. . 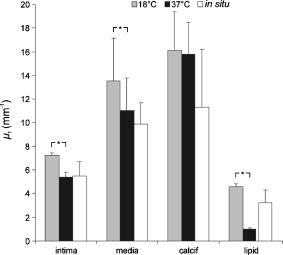 4.DiscussionIn this study, we investigated the nature of the differences in back-scatter and attenuation of OCT signals in arterial wall components. Using the almost histology-like capabilities of a high-resolution OCT system, we were able to determine the and of individual blood vessel components. Furthermore, we observed decreases in both and when the sample temperature was raised from room to body temperature. As shown in Table 1, the measured values of are in good agreement with previously reported values. For calcific nodules in the vascular wall, no values of are available in the literature. The of hydroxyapatite, the mineral in calcifications, is reported to be 1.651, in close agreement with our results of 1.63 to 1.64.22 The great variance in the values of presented in this work can be attributed to the biological variability in hydroxyapatite content, which was reported to vary for osteones from 50 to 100%, resulting in refractive indexes of 1.564 to 1.604.23 Knowledge of the correct value of is important to convert the measured optical path length to geometrical path lengths, which is ultimately needed for correct determination of the . The values for reported in this study are slightly higher than prior in situ measurements, albeit without statistical significance. These differences can be explained by the fact that for these in situ studies,10, 19 the conversion from OCT signals to images was based on an assumed general refractive index of 1.33, thus underestimating the attenuation in structures with a higher , as determined in the current study. Furthermore, in these previous studies, the was obtained in samples that consisted of multiple layers, like the intima on top of the media in the samples. Independent of the model used, like the more comprehensive extended Huygens Fresnel (EHF) model,8, 24 the model of Karamata, 6, 7 or our single scattering model, 5, 10, 19, 25 this study shows that refractive indices of the individual plaque components (except for calcification) are similar, thus the effect of discrepancies between optical and geometrical path length in these multiple layers on the measured attenuation is likely negligible. Finally, the large difference in for calcified lesions compared to the surrounding medial and intimal tissues is expected to induce large back-scattered signals from those boundaries, which explains the characteristic sharp demarcations of calcified lesions. Furthermore, with the use of an average of approximately 1.38 in cardiovascular OCT imaging, the axial dimensions of the calcified lesions will be overestimated. 4.1.Temperature DependencePrevious studies demonstrated that both the scattering26 and the absorption27, 28 coefficients can be temperature dependent. Scattering changes have been cleverly utilized to monitor temperature changes in laser welding.29, 30, 31 Moreover, OCT has been used to monitor biological tissue freezing during cryosurgery, based on changes in with temperature.32 In all samples studied in this study, we observed a persistent decrease in when tissue temperature was raised from room temperature to . In our study, the effect of temperature was largest for the lipid structures. In the range from room to body temperature, lipid structures have a transition from the rigid liquid-crystalline phase to the more fluid gel phase, which may explain the observed decrease in light scattering and index of refraction.33 Finally, these results clearly indicate that optical property measurements of fatty tissues should be performed at . 4.2.Comparison with Other ModelsThe single scattering model used in this work is widely used to describe the OCT signal, and its range of validity has been the subject of many investigations. In a previous study,5 we established the range of validity of the single scattering model for weaker scattering samples for varying focusing conditions. We found that the single scattering approximation is valid for up to seven mean free paths (MFPs) using dynamic focusing (focus tracking), as in the experiments in this study. The MFP is conventionally defined as , which allows us to express the range of validity of the single scattering approximation in terms of depth as . For the maximum of approximately found in the experiments described in this work, the seven MPFs have a depth of , which is larger than the probed sample depths in our experiments. As discussed in our previous study,10 other models can be used to extract the attenuation coefficient of the tissue samples. The model of Karamata 6, 7, 10 is, due to its semianalytical character, less appropriate for this task. The EHF model includes the contribution of multiple scattered light in the OCT signal and could also be feasible for this task. However, for low scattering samples, the 95% confidence intervals of the attenuation coefficient become very high, since the model is overparameterized in that regime.5 As a practical consequence, the EHF model had the tendency not to converge to realistic values of the root-mean-square scattering angle , and sometimes preset values of this parameter had to be given to extract values of . Although the applicability of the different analytical models to the OCT signal obtained from our samples was not the goal of this study, as an example, we have fitted both the single scattering and the EHF model5, 24 to one of our highest scattering tissue samples (Fig. 4 ). Both models resulted in comparable values of , which for the EHF model was only possible after fixing in the fitting (in the example, ). Both models resulted in the similar good fitting statistics, e.g., low , high , and same Shapiro-Francia parameter , and both fits agreed well with the data (based on visual inspection). Due to the complexity of this model for fitting the different samples, we decided to use the simpler single scattering model. However, more research is needed to address this issue further. Fig. 4OCT signal versus depth (light gray). The curve represents the average A-scan over the region of interest in an OCT image of calcified tissue. Not all error bars are plotted for clarity.The dark gray line denotes the best fit using Eq. 2 (single scattering model) yielding . The black line shows the best fit using the EHF model, yielding .  5.ConclusionWe report accurate values of the refractive index of individual layers of the vascular wall and individual atherosclerotic plaque constituents, all important actors in vascular OCT imaging. The sample temperature is of influence on the quantitative measurements within OCT images. For extrapolation of ex-vivo experimental results, especially for structures with high lipid content, this effect should be taken into account. AcknowledgmentsThe authors wish to thank G. Pasterkamp and the Utrecht Athero-Express biobank for the donation of atherosclerotic samples. This research is sponsored by the Netherlands Heart Foundation (grant 99.199) and is also part of the research program of the “Stichting voor Fundamenteel Onderzoek der Materie (FOM),” which is financially supported by the Nederlandse Organisatie voor Wetenschappelijk Onderzoek (NWO). We acknowledge the Interuniversity Cardiology Institute of the Netherlands (ICIN) for financial support. ReferencesOptical-Thermal Response of Laser-Irradiated Tissue, Plenum Press, New York (1995). Google Scholar
B. C. Wilson,
“Measurement of tissue optical properties: methods and theories,”
Optical-Thermal Responses of Laser-Irradiated Tissue, 233
–274 Plenum Press, New York (1995). Google Scholar
D. Huang,
E. A. Swanson,
C. P. Lin,
J. S. Schuman,
W. G. Stinson,
W. Chang,
M. R. Hee,
T. Flotte,
K. Gregory,
C. A. Puliafito, and
J. G. Fujimoto,
“Optical coherence tomography,”
Science, 254 1178
–1181
(1991). 0036-8075 Google Scholar
J. G. Fujimoto,
M. E. Brezinski,
G. J. Tearney,
S. A. Boppart,
B. Bouma,
M. R. Hee,
J. F. Southern, and
E. A. Swanson,
“Optical biopsy and imaging using optical coherence tomography,”
Nat. Med., 1 970
–972
(1995). 1078-8956 Google Scholar
D. J. Faber,
F. J. van der Meer, and
M. C. G. Aalders,
“Quantitative measurement of attenuation coefficients or weakly scattering media using optical coherence tomography,”
Opt. Express, 12 4353
–4365
(2004). https://doi.org/10.1364/OPEX.12.004353 1094-4087 Google Scholar
B. Karamata,
P. Lambelet,
M. Laubscher,
M. Leutenegger,
S. Bourquin, and
T. Lasser,
“Multiple scattering in optical coherence tomography. Part I: Investigation and modeling,”
J. Opt. Soc. Am. A, 22 1369
–1379
(2005). 0740-3232 Google Scholar
B. Karamata,
P. Lambele M. Leutenegger,
M. Laubscher,
S. Bourquin, and
T. Lasser,
“Multiple scattering in optical coherence tomography. Part II: Experimental and theoretical investigation of cross-talk in wide-field optical coherence tomography,”
J. Opt. Soc. Am. A, 22 1380
–1388
(2005). 0740-3232 Google Scholar
L. Thrane,
M. H. Frosz,
T. M. Jorgensen,
A. Tycho,
H. T. Yura, and
P. E. Andersen,
“Extraction of optical scattering parameters and attenuation compensation in optical coherence tomography images of multilayered tissue structures,”
Opt. Lett., 29 1641
–1643
(2004). https://doi.org/10.1364/OL.29.001641 0146-9592 Google Scholar
F. J. van der Meer,
D. J. Faber,
M. C. Aalders,
G. Pasterkamp, and
T. G. Van Leeuwen,
“Enhanced spatial discrimination of plaque components by quantitative optical coherence tomography,”
Circulation, 110
(suppl 3), 375
(2004). 0009-7322 Google Scholar
F. J. van der Meer,
D. J. Faber,
D. M. Baraznji Sassoon,
M. C. Aalders,
G. Pasterkamp, and
T. G. Van Leeuwen,
“Localized measurement of optical attenuation coefficients of atherosclerotic plaque constituents by quantitative optical coherence tomography,”
IEEE Trans. Med. Imaging, 24 1369
–1376
(2005). https://doi.org/10.1109/TMI.2005.854297 0278-0062 Google Scholar
G. Vargas,
E. K. Chan,
J. K. Barton,
H. G. Rylander, and
A. J. Welch,
“Use of an agent to reduce scattering in skin,”
Lasers Med. Sci., 24 133
–141
(1999). 0268-8921 Google Scholar
G. Vargas,
K. F. Chan,
S. L. Thomsen, and
A. J. Welch,
“Use of osmotically active agents to alter optical properties of tissue: Effects on the detected fluorescence signal measured through skin,”
Lasers Surg. Med., 29 213
–220
(2001). https://doi.org/10.1002/lsm.1110 0196-8092 Google Scholar
G. Vargas,
A. Readinger,
S. S. Dozier, and
A. J. Welch,
“Morphological changes in blood vessels produced by hyperosmotic agents and measured by optical coherence tomography,”
Photochem. Photobiol., 77 541
–549
(2003). https://doi.org/10.1562/0031-8655(2003)077<0541:MCIBVP>2.0.CO;2 0031-8655 Google Scholar
M. E. Brezinski,
K. Saunders,
C. Jesser,
X. Li, and
J. G. Fujimoto,
“Index matching to improve optical coherence tomography imaging through blood,”
Circulation, 103 1999
–2003
(2001). 0009-7322 Google Scholar
G. J. Tearney,
M. E. Brezinski,
J. F. Southern,
B. Bouma,
M. R. Hee, and
J. G. Fujimoto,
“Determination of the refractive-index of highly scattering human tissue by optical coherence tomography,”
Opt. Lett., 20 2258
–2260
(1995). 0146-9592 Google Scholar
A. Knuttel and
M. Boehlau-Godau,
“Spatially confined and temporally resolved refractive index and scattering evaluation in human skin performed with optical coherence tomography,”
J. Biomed. Opt., 5 83
–92
(2000). https://doi.org/10.1117/1.429972 1083-3668 Google Scholar
M. Ohmi,
Y. Ohnishi,
K. Yoden, and
M. Haruna,
“In vitro simultaneous measurement of refractive index and thickness of biological tissue by the low coherence interferometry,”
IEEE Trans. Biomed. Eng., 47 1266
–1270
(2000). 0018-9294 Google Scholar
X. Wang,
C. Zhang,
L. Zhang,
L. Xue, and
J. Tian,
“Simultaneous refractive index and thickness measurements of bio tissue by optical coherence tomography,”
J. Biomed. Opt., 7
(4), 628
–632
(2002). https://doi.org/10.1117/1.1501887 1083-3668 Google Scholar
F. J. Van der Meer,
D. J. Faber,
J. Perree,
G. Pasterkamp,
D. M. Baraznji Sassoon, and
T. G. Van Leeuwen,
“Quantitative optical coherence tomography of arterial wall components,”
Lasers Med. Sci., 20 45
–51
(2005). 0268-8921 Google Scholar
M. E. Brezinski,
G. J. Tearney,
B. E. Bouma,
J. A. Izatt,
M. R. Hee,
E. A. Swanson,
J. F. Southern, and
J. G. Fujimoto,
“Optical coherence tomography for optical biopsy—properties and demonstration of vascular pathology,”
Circulation, 93 1206
–1213
(1996). 0009-7322 Google Scholar
I. F. Cilesiz and
A. J. Welch,
“Optical properties of human aorta: Are they affected by cryopreservation?,”
Lasers Surg. Med., 14 396
–402
(1994). 0196-8092 Google Scholar
D. McDonnell, Apatite. Its Crystal Chemistry, Mineralogy, Utilization, and Geologic and Biologic Occurrences,
(1973) Google Scholar
A. Ascenzi and
C. Fabry,
“Technique for dissection and measurement of refractive index of osteones,”
J. Cell Biol., 6 139
–142
(1959). 0021-9525 Google Scholar
D. Levitz,
L. Thrane,
M. H. Frosz,
P. E. Andersen,
C. B. Andersen,
J. Valanciunaite,
J. Swartling,
S. Andersson-Engels, and
P. R. Hansen,
“Determination of optical scattering properties of highly-scattering media in optical coherence tomography images,”
Opt. Express, 12 249
–259
(2004). https://doi.org/10.1364/OPEX.12.000249 1094-4087 Google Scholar
T. G. Van Leeuwen,
D. J. Faber, and
M. C. Aalders,
“Measurement of the axial point spread function in scattering media using single-mode fiber-based optical coherence tomography,”
IEEE J. Sel. Top. Quantum Electron., 9 227
–233
(2003). https://doi.org/10.1109/JSTQE.2003.813299 1077-260X Google Scholar
K. M. Ally and
E. Esmail,
“Refractive index of salt water: Effect of temperature,”
Opt. Mater., 2 195
–199
(1993). 0925-3467 Google Scholar
E. D. Jansen,
T. G. Van Leeuwen,
M. Motamedi,
C. Borst, and
A. J. Welch,
“Temperature dependence of the absorption coefficient of water for midinfrared laser radiation,”
Lasers Surg. Med., 14 258
–268
(1994). 0196-8092 Google Scholar
J. W. Pickering,
S. Bosman,
P. Posthumus,
P. Blokland,
J. F. Beek, and
M. J. C. Van Gemert,
“Changes in the optical-properties (at ) of slowly heated myocardium,”
Appl. Opt., 32 367
–371
(1993). 0003-6935 Google Scholar
I. Cilesiz,
S. Thomsen, and
A. J. Welch,
“Controlled temperature tissue fusion: Argon laser welding of rat intestine in vivo. Part One,”
Lasers Surg. Med., 21 269
–277
(1997). https://doi.org/10.1002/(SICI)1096-9101(1997)21:3<269::AID-LSM7>3.0.CO;2-O 0196-8092 Google Scholar
I. Cilesiz,
S. Thomsen,
A. J. Welch, and
E. K. Chan,
“Controlled temperature tissue fusion: laser welding of rat intestine in vivo. Part Two,”
Lasers Surg. Med., 21 278
–286
(1997). https://doi.org/10.1002/(SICI)1096-9101(1997)21:3<278::AID-LSM8>3.0.CO;2-N 0196-8092 Google Scholar
M. R. Jerath,
C. M. Gardner,
H. G. Rylander, and
A. J. Welch,
“Dynamic optical property changes: Implications for reflectance feedback control of photocoagulation,”
J. Photochem. Photobiol., B, 16 113
–126
(1992). 1011-1344 Google Scholar
B. Choi,
T. E. Milner,
J. Kim,
J. N. Goodman,
G. Vargas,
G. Aguilar, and
J. S. Nelson,
“Use of optical coherence tomography to monitor biological tissue freezing during cryosurgery,”
J. Biomed. Opt., 9 282
–286
(2004). https://doi.org/10.1117/1.1648647 1083-3668 Google Scholar
K. A. Riske,
M. J. Politi,
W. F. Reed, and
M. T. Lamy-Freund,
“Temperature and ionic strength dependent light scattering of DMPG dispersions,”
Chem. Phys. Lipids, 89 31
–44
(1997). https://doi.org/10.1016/S0009-3084(97)00058-3 0009-3084 Google Scholar
|
|||||||||||||||||||||||||||||||||||


