|
|
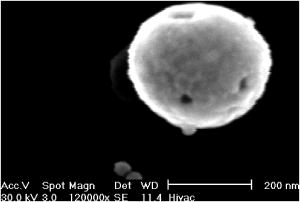
1.IntroductionOptical coherence tomography (OCT) has received considerable attention as a revolutionary biomedical imaging method since its introduction just over a decade ago.1 However, only recently have researchers begun to explore the possibilities of improving OCT image quality in biological tissue with exogenous contrast agents, many of which can provide molecular contrast. 2, 3, 4, 5, 6, 7, 8, 9, 10, 11, 12, 13 For example, air-filled microbubbles2 and engineered microspheres3 have been used to enhance the intensity of backscattered light from the tissue for OCT imaging. Near-infrared dyes that are spectrally active have been shown to enhance spectroscopic OCT images.4 Metal nanoparticles—including homogeneous nanospheres,14 nanoshells,15, 16, 17 and nanocages13, 18—represent a new generation of contrast agents that show promise for improving signals in reflectance-based diagnostics. Nanoshells consist of a dielectric (silica) core covered by a thin metallic shell. While multilayer nanoshells16 have been investigated theoretically, construction of such particles has not been achieved. The current study involves nanoshells with a single gold layer. By varying the relative dimensions of core and shell, the optical resonance of these particles can be systematically varied over a broad spectral region from the near-uv to the mid-ir. Therefore, it is possible to engineer gold nanoshells for OCT imaging that have a high level of backscattering and a low level of absorption at the appropriate wavelength. Another important property of nanoshells is their ability to be bioconjugated to enzymes and antibodies for selective targeting to receptors of clinical interest.14, 19 In the future, this line of research may lead to an OCT-based molecular imaging approach that is sensitive and specific to neoplastic lesions and provides high levels of contrast. OCT imaging with gold nanoshells has been documented. Loo 15 compared in vitro OCT images of water, microsphere suspension, and nanoshell suspension at an illumination wavelength of . The nanoshells used in this study had a silica core diameter of 200-nm and 20-nm shell thickness and were suspended in water at a concentration of . Experimental data on the influence of specific nanoshell parameters are not yet available in the literature. Such data are needed to elucidate the optical characteristics of these particles and facilitate the development and optimization of nanoshell-enhanced OCT for minimally invasive diagnostics. Therefore, the goal of this study was to quantify the effect of nanoshell core diameter, shell thickness and concentration on the contrast enhancement provided by nanoshells during OCT imaging at . 2.MethodsOptical properties of nanoshells were determined from analytical vector-based solutions to Maxwell’s equations for the incident, internal, and scattered electromagnetic fields.20, 21, 22 Briefly, matching the boundary conditions between the core and shell and between the shell and surrounding medium allows coefficients defining the electric and magnetic fields to be determined. These coefficients are dependent on the dielectric constants of the core, shell, and medium, on the core and total nanoshell radii, and on the wavelength. Two of these coefficients, and , define the scattered field and therefore permit direct computation of the extinction, scattering, and backscattering efficiencies ( , , ), as follows23: where is the size parameter, ; is the total nanoshell radius; and is the wavelength in the surrounding medium. Absorption efficiency is then determined from and : . Each optical transport coefficient ( ) is easily computed from its corresponding efficiency by , where is the volume density of particles . At an illumination wavelength of , calculations indicated that nanoshells with a core diameter over and shell thickness greater than show higher scattering efficiencies. In addition, absorption efficiencies decrease dramatically as shell thickness increases over approximately . Thus, nanoshells with these size characteristics were expected to yield strong OCT signal.Nanoshells were fabricated by the authors at Rice University. The fabrication protocol developed for nanoshells includes molecular self-assembly and colloid chemistry in an aqueous solution.24 For the nanoshell cores, silica nanoparticles were made by the Stöber method, which involves the reduction of tetraethylorthosilicate (Sigma-Aldrich, St. Louis, Missouri) in ethanol. The sizes of the silica cores were determined by scanning electron microscopy (SEM). The cores were functionalized with aminopropyltriethoxysilane (Sigma-Aldrich), resulting in attached amine groups. For the shell, colloidal gold nanoparticles of 1- to 3-nm diameter were fabricated according to the method of Duff 25 This colloidal suspension was first aged for two weeks at 4°C and concentrated using a rotary evaporator. When the functionalized silica cores were placed in the aged colloidal suspension, gold nanoparticles adsorbed to the amine groups. Adsorbed gold provided the nucleation sites for further reduction of gold, until these sites coalesced into a complete shell. The amount of gold added during this final reduction stage determined the shell thickness. Final gold nanoshell sizes were evaluated by SEM. Prior to OCT experiments, nanoshell surfaces were modified with polyethylene glycol (PEG)-thiol to provide steric stabilization as well as to eliminate nonspecific protein adsorption. PEG-thiol was synthesized by reacting 2-iminothiolane (Sigma-Aldrich) with PEG-NH2 5000 MW (Nektar Therapeutics, Huntsville, Alabama). After mixing and reacting equal volumes of the PEG-amine and iminothiolane for , they were dialyzed against deionized water for 1 to , changing the dialysate four times in order to remove excess reagent. While initial research indicates that PEGylation can decrease scattering intensity from nanoshells, we investigated only PEGylated nanoshells because these are the most relevant for in vivo applications. Nanoshells with six unique geometries were fabricated: (core diameter/shell thickness, in nanometers) 126/15, 126/26, 213/19, 291/8, 291/15, 291/25. Figure 1 shows a SEM image of a 291/15 nanoshell. Nanoshell concentrations were determined via an approach resembling hemacytometer-based cell counting. Nanoshell suspensions were first diluted by a known factor to achieve particles/mL. We then captured digital charge-coupled device (CCD) images of each diluted suspension in a 0.1-mm pathlength cuvette under a darkfield microscope with a objective. Darkfield microscopy was preferred over brightfield because of substantially better image contrast. The CCD field of view was calibrated (microns/pixel) with a scale having rulings; therefore, the volume in the field of view was known. We used our own MATLAB code to locate and tally all the particles in each image and then compute the concentration. The precision of this counting approach, evaluated by counting three samples of each nanoshell suspension, was 12% or better (one standard deviation). The final estimates of nanoshell concentrations were accurate to within 9%, as determined by using the above method to count microsphere suspensions with known concentrations. Measurements were performed with a time-domain OCT system based on an all-fiber common-path interferometer, also known as an autocorrelator (AIF-INST-02, Optiphase, Van Nuys, California).26 Sharma 27 have described and analyzed a similar OCT system configuration. A diagram of our system is shown in Fig. 2 . As compared to the standard Michelson interferometer, the autocorrelator does not have a separate reference arm and instead derives its reference signal from a reflection in the sample path. Depth ranging is achieved by two piezoelectric fiber stretchers driven by triangular voltage waveforms out of phase with each other. This push-pull operation permits depth scans up to in air. The OCT sample path consists of the single-mode fiber input/output of the autocorrelator coupled to an 11-mm focal length collimating lens (F220FC-C, Thorlabs, Newton, New Jersey), followed by - and -scanning galvanometer mirrors (Model 6210, Cambridge Technology, Cambridge, Massachusetts), and finally a refocusing lens (C280TM-C, Thorlabs) with an 18-mm focal length. Because the fiber has angled faces and the lenses have efficient antireflective coatings, the first possible back reflection that provides the reference signal occurs at the sample itself. To optimize signal-to-noise ratio (SNR), the magnitude of the reference can be adjusted by the type of cover glass (or lack thereof) over the sample and/or by the axial position of the beam focus. The shot noise-limited SNR of the system is . The system’s decibel intensity units were calibrated by recording the changes in signal intensity from a glass plate as the light source output power, measured with a U.S. National Institute of Standards and Technology–traceable power meter, was varied over two orders of magnitude. The light source for this OCT system is a superluminescent diode centered at with a 50-nm spectral bandwidth, which therefore yields a coherence length of in air. The lateral resolution is at focus, and the optical power at the sample is approximately . OCT measurements were taken of the nanoshells in water and turbid, tissue-simulating phantoms. The phantoms consisted of diameter polystyrene microspheres (Polysciences, Warrington, Pennsylvania) suspended in water. These phantoms had a scattering coefficient of and anisotropy of 0.9, based on Mie theory calculations. This level of scattering is directly relevant to biological tissue at .28 Samples were imaged in a 0.5- or 1-mm pathlength two-piece cuvette, with the OCT beam axially focused at the interface between the cuvette glass and liquid sample, to maximize signal, and hence SNR, from the sample itself. Each B-scan image required of acquisition time and consisted of 120 A-scans taken at over a 0.85-mm lateral region. To ensure a homogeneous distribution of particles, each suspension was agitated just prior to OCT imaging. The particle settling time was analyzed and found to produce noticeable changes in the OCT signal about after ceasing agitation. Therefore, each B-scan was acquired within of agitation. Figures 3a and 3b show typical B-scan images of water and nanoshells in water. To reduce the effects of speckle and to obtain more reliable intensity estimates at low nanoshell concentrations, all 120 A-scans from each B-scan were averaged for subsequent analysis. Fig. 3OCT B-scan images of 1-mm pathlength cuvette filled with (a) water and (b) 291/25 nanoshells at a concentration of particles/mL in water. 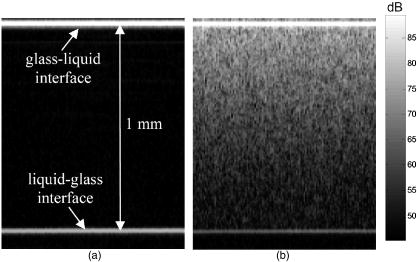 Two sets of measurements were performed in this study. The first set involved OCT imaging of nanoshells in water and phantom solutions where the concentration of nanoshells in each sample was held constant at particles/mL. In the second set of measurements, we investigated the effect of nanoshell concentration on OCT signal intensity in water and phantom. Each data point displayed in the figures represents the mean of three measurements. The standard deviation for each data point was also computed, but the error bars on each graph represent the maximum standard deviation of all points on that graph. 3.ResultsThe intent of the first set of measurements was to determine the intensity gain achieved by the addition of nanoshells with differing geometries. Intensity gain was defined as the average intensity over the first of a sample (water or phantom) with nanoshells minus the corresponding average intensity of that sample without nanoshells. The averaging was limited to the first beyond the glass-liquid interface (75 to from the peak) to minimize the effect of signal attenuation. For the case of nanoshells added to water, a graph of average A-scans for two nanoshell types and a water baseline is shown in Fig. 4a . Figure 4b shows the intensity gain values for all the nanoshells added to water. This graph shows a variation of intensity gains from 19 to in a monotonic relationship with the predicted backscattering coefficient . As expected, larger core and shell sizes tended to generate higher levels of backscattering and thus greater intensity gain. Note that the nanoshells with the largest core but smallest shell (291/8) produced a smaller signal than those with smaller core and larger shell (213/19). Fig. 4(a) Average A-scans of water and two different sizes of nanoshells in water ( nanoshells/mL). The vertical dotted lines indicate the first over which the intensity was averaged for intensity gain estimates. (b) Measured intensity gain from each size of nanoshells versus the backscattering coefficient predicted for each size of nanoshells. Note that data points are labeled with core diameter/shell thickness in nanometers.  Figures 5a and 5b are analogous to Figs. 4a and 4b, but here nanoshells are added to the microsphere-based turbid phantom and intensity gains are computed relative to the phantom alone. Average A-scan data are shown in Fig. 5a. Average intensity gains shown in Fig. 5b vary from 2 to , in a monotonic relationship with the predicted . The level of intensity gain produced by nanoshells in the phantom material is much lower than that seen for the water-based measurements. We can interpret the intensity gains seen with this phantom as a meaningful prediction of actual intensity gains to be expected when these nanoshells are added to tissue. Fig. 5(a) Average A-scans of a tissue phantom and two different sizes of nanoshells in the phantom ( nanoshells/mL). The vertical dotted lines indicate the first over which the intensity was averaged for intensity gain estimates. (b) Measured intensity gain from each size of nanoshells versus the backscattering coefficient predicted for each size of nanoshells.  The OCT signal attenuation due to nanoshells was measured in water using the intensity of the reflection from the liquid-glass interface at the bottom of a 1-mm pathlength cuvette. This interface was used to quantify attenuation because it provided a strong signal that was more easily quantifiable and had lower error levels than calculating the attenuation by the standard approach of fitting the decay curve. Given the relatively small variations in OCT signal attenuation with nanoshell parameters, this strong signal was necessary to provide an accurate illustration of changes in attenuation. The drop in this intensity when the nanoshells were added to water provides the attenuation value, as shown in Fig. 6a . Note that in this graph, the attenuation in the turbid phantom is much greater than that of the nanoshells, as indicated both by the rate of signal decay as well as the size of the second peak (or lack thereof, in the phantom case). The lack of a first order decay in the phantom indicates a significant contribution of multiply scattered light.29 Figure 6b shows that the measured attenuation in water tracks the predicted extinction coefficient of nanoshells. In this graph, the order of the 213/19 and 291/8 nanoshells has reversed as compared to the intensity gain, because the thin shell of the 291/8 nanoshells leads to increased absorption. These results indicate that nanoshells with larger core and shell have a greater potential for inducing attenuation; however, this attenuation was minimal compared to that produced by the phantom. Fig. 6(a) Average A-scans of water, a turbid tissue phantom and nanoshells in water ( nanoshells/mL). The cuvette pathlength is . (b) Measured attenuation from each size of nanoshells in water as a function of the nanoshell extinction coefficient predicted from theory.  A more biologically relevant evaluation of attenuation was performed by measuring changes due to nanoshells in a turbid phantom. However, due to the high attenuation of the phantom—and subsequent absence of a significant sample-glass interface peak—it was not possible to use the same setup as for the attenuation measurements in water. Two changes were made to our approach in order to enable a measurable peak: (1) the pathlength of the sample region was decreased to , and (2) a mirror was used as the bottom surface of the two-piece cuvette. This setup allowed us to observe that the attenuation of the phantom alone is (relative to water). Figure 7 shows the additional attenuation caused by each type of nanoshells in the phantom. The trend in this graph is similar to that seen in Fig. 6b, though the level of attenuation is reduced. Fig. 7Measured incremental attenuation due to several sizes of nanoshells ( nanoshells/mL) in a turbid tissue phantom as a function of the nanoshell extinction coefficient predicted from theory. The cuvette pathlength used here is .  Optimization of nanoshell-enhanced OCT will require a quantitative understanding of the influence of nanoshell concentration. To address this issue, we measured the intensity gain from three types of nanoshells at various concentrations in a scattering phantom. The nanoshell geometries chosen for this analysis—126/15, 213/19, 291/25—provide insight into the range of OCT signal intensity gains that can be produced for a given concentration. The intensity gain was determined in a similar manner as for Figs. 4b and 5b, by computing the average intensity over the first of an average A-scan. Results in Fig. 8 show a strong increase in intensity gain with concentration for each of the three nanoshells. For all nanoshell types, the intensity gain did not rise appreciably above the noise floor for concentrations less than nanoshells/mL. As expected, the 291/25 nanoshells produced the greatest intensity gain at all concentrations over which signals were above the noise floor. Setting the threshold for detection at a level slightly above the noise floor , the minimum concentrations required to produce threshold-level intensity gains were , , and nanoshells/mL for the 126/15, 213/19, and 291/25 geometries, respectively. At any particular concentration level, the trends in intensity gain as a function of nanoshell type are in agreement with results in Figs. 4b and 5b. 4.DiscussionPrior studies have established the ability of nanoshells to provide improved contrast during OCT imaging of biological tissues. This work, however, represents the first parametric experimental investigation of the factors that influence signal enhancement by nanoshells. The in vitro phantom measurements performed in this study provide unique insights into the OCT imaging characteristics of nanoshells. With this information, it is now possible to begin a rigorous analysis of the issues related to optimization of nanoshell parameters for in vivo diagnosis. Our experimental results provide evidence that increases in core diameter over the range of 126 to and shell sizes over the range of 8 to can produce a significant increase in OCT signal intensity at . The turbid phantom alone generated an intensity level of about above the noise floor. As indicated by Fig. 5b, 5-dB intensity gains at a nanoshell concentration of nanoshells/mL were possible by increasing core diameter (126/26 to 291/25) or shell thickness (291/8 to 291/25). The highest intensity gain generated in a phantom was a value of (Fig. 8). This gain was produced for the 291/25 nanoshells at a concentration of nanoshells/mL. While these results indicate that achieving large increases in the OCT signal necessitates a large core diameter and shell thickness, these same attributes can also result in greater signal attenuation. Our experimental results indicate that for all but the nanoshells with the largest overall sizes, attenuation was relatively minimal. The 291/25 nanoshells at a concentration of nanoshells/mL produced nearly of attenuation over a 0.5-mm pathlength. Although is relatively small compared to the of attenuation produced by the turbid phantom, nanoshell attenuation might become significant over greater depths, particularly in tissues with low attenuation levels and for cases in which nanoshell concentrations are significantly greater than those investigated here. It is worthwhile noting that, according to the calculated optical properties, the relative contribution of scattering to the total attenuation increases dramatically with core diameter and shell thickness. For example, in the case of 126/15 nanoshells, absorption is 1.5 times stronger than scattering; whereas, for the 291/25 geometry, scattering is more than 5 times as strong as absorption. Variations in the intensity gain and attenuation as a function of shell thickness were less consistent than those seen for core diameter. For nanoshells with a core diameter of , the change in predicted was sixfold as shell diameter increased from 8 to and the increase in experimentally measured intensity gain in the turbid phantom was . However, in three cases, minimal differences were seen between results for nanoshells with the same core diameter but different shell thickness. One instance involves the intensity gain data for 126/15 and 126/26 nanoshells [Figs. 4b and 5b]. The other two cases involve attenuation data for the 126/15 and 126/26 nanoshells as well as the 291/15 and 291/25 nanoshells [Figs. 6b and 7]. The changes in backscattering and attenuation over these ranges were too small to be detected by our OCT system. Although variations in nanoshell parameters do not induce consistent, linear variations in backscattering or attenuation, the trends seen in the measurements match those from the calculated optical properties. Prior calculations for a wavelength of indicated that scattering increases monotonically with shell thickness, but varies in an irregular, nonmonotonic manner with nanoshell core diameter.15 At , however, theoretical results indicate monotonic, albeit nonlinear, increases in scattering efficiency with both core and shell size. Not only do our results corroborate the trends expected from varying each of these two geometric parameters but also for the combined effect of the parameters as well. As indicated in Figs. 4 and 5, intensity gain increased as predicted when one parameter was held constant and the other was increased. While the predominant effect was an increase in intensity gain with core size, results clearly indicate one case in which the smaller core nanoshells (213/19) produced more signal than ones with larger core (291/8). This was due to the thicker shell of the 213/19 nanoshells and is in agreement with theory. While a fully quantitative validation of calculated optical properties will be performed in a future study, our current results provide strong corroboration with theoretically predicted trends. One of the most important practical concerns for nanoshell-based enhancement of OCT images is the density or concentration of nanoshells that are necessary to produce a reliably detectable level of contrast. A series of measurements at different concentrations (Fig. 8) provides insight into the issue of detection threshold. As expected, nanoshells with higher backscattering efficiencies required lower concentrations to reach the detection threshold. For the most highly backscattering nanoshells (291/25), a concentration of nanoshells/mL was required to produce an intensity gain of or more in the phantom. We can compare this threshold concentration of nanoshells/mL to what concentrations may be realized in cancerous tumors in vivo. First, we consider the case of nanoshells labeled to target a tumor. A tumor marker such as the epidermal growth factor receptor can be found at levels of per cell on cancerous cells (versus to per cell on normal cells).30, 31 For the case of cells with diameter and nanoshells with 300-nm diameter, then up to 4000 nanoshells could be accommodated on the cell surface, and at least 100 receptors would be available to bind to each antibody-conjugated nanoshell. If only 10% of each cell’s surface were covered with nanoshells (400 nanoshells/cell), the nanoshell concentration would be nanoshells/mL, two orders of magnitude above the threshold concentration. In addition to a molecularly specific mechanism of delivering nanoshells to a tumor, there is also an opportunity for intravenously injected, unlabeled nanoshells to accumulate in a tumor via passive extravasation from its leaky vasculature.32, 33, 34 However, there is limited information in the literature to precisely predict the potential concentration of unlabeled nanoshells accumulating in a tumor in this manner. Unezaki 34 found that of an intravenously injected 1-mg dose of PEG-coated liposomes (198-nm mean diameter) would accumulate in 1-g tumors inoculated subcutaneously in mice. Assuming the tissue and liposome mass densities are similar to that of water , then a final concentration of particles/mL accumulated in each tumor, again well above the nanoshell threshold concentration. Interestingly, there was a distinct size dependence of the extravasation, with 63-nm and 388-nm diameter liposomes showing significantly less accumulation than the 198-nm liposomes. Given the results presented here on the variations in nanoshell optical performance, it is useful to consider what geometry is optimal for OCT imaging, or perhaps more importantly, what factors should be considered in determining whether a nanoshell is “optimal.” Because a high OCT signal level would facilitate detection, one criteria is maximum intensity gain. Within the range of parameters that were investigated in the current study, the nanoshell with the largest core (291-nm diameter) and shell (25-nm thick) provided maximum OCT signal enhancement. However, this nanoshell also produced the greatest attenuation of OCT signals. Whether or not this attenuation is significant would depend on both the distribution and concentration of the nanoshells. For the nanoshell concentrations investigated here, attenuation was much less than that of biological tissue. Therefore, the contribution to overall signal loss would likely be minimal unless the nanoshells were present in very high concentrations and/or at moderately high concentrations throughout the entire depth being scanned. On the other hand, if a highly concentrated grouping of nanoshells was present at a targeted tumor, significant localized attenuation might be produced, causing strong shadowing in the region below the tumor. This shadowing, combined with a high level of backscatter, might lead to improved detection of tumors. While 291/25 nanoshells produced the greatest signal for a given concentration, they may not be the best choice for all OCT applications. In addition to the studies of passive extravasation discussed earlier, there is further evidence that the pharmacokinetics of nanoshells is dependent on particle size—specifically, larger particles may suffer from limited or slow biodistribution and clearance.35 Furthermore, if the amount of nanoshells delivered is limited by volume rather than particle concentration (e.g., due to safety concerns), smaller diameter nanoshells may actually be more effective at producing high OCT signals. Results in Fig. 8 indicate that the concentration of nanoshells required to achieve an intensity gain of about using 291/25 nanoshells is one-fifth that required when using 126/15 nanoshells. However, the volume of a 291/15 nanoshell is about 10 times greater than that of a 126/15 nanoshell. Therefore, 126/15 nanoshells—the smallest nanoshells tested in this study—would likely produce more signal per nanoshell volume. 5.ConclusionThe influence of nanoshell geometry and concentration on OCT signal enhancement in turbid media was investigated through in vitro OCT measurements. Nanoshells with core diameters of 126 to and shell thicknesses of 8 to were studied in water and turbid tissue phantoms. Monotonic increases of up to in OCT intensity gain and in signal attenuation were found with increasing core and shell size for concentrations of nanoshells/mL. These gains were not linear with either geometric parameter yet were qualitatively consistent with calculated optical properties. Results indicate that a concentration of nanoshells/mL may be needed to provide meaningful signal enhancement in a relatively homogeneous turbid medium. These results help elucidate a number of basic issues relevant to optimization of nanoshell parameters for reflectance-based diagnostics and will facilitate future studies toward the development of a viable molecular OCT imaging approach. AcknowledgmentsThe authors acknowledge support from the Welch Foundation, Beckman Foundation, and the National Science Foundation Center for Biological and Environmental Nanotechnology at Rice. We also acknowledge Jeff Bush of Optiphase, Inc. for many helpful discussions on configuring and characterizing our autocorrelator. The opinions and conclusions stated in this paper are those of the authors and do not represent the official position of the U.S. Food and Drug Administration. The mention of commercial products, their sources, or their use in connection with material reported here is not to be construed as either an actual or implied endorsement of such products by the U.S. Food and Drug Administration. ReferencesD. Huang,
E. A. Swanson,
C. P. Lin,
J. S. Schuman,
W. G. Stinson,
W. Chang,
M. R. Hee,
T. Flotte,
K. Gregory,
C. A. Puliafito, and
J. G. Fujimoto,
“Optical coherence tomography,”
Science, 254 1178
–1181
(1991). 0036-8075 Google Scholar
J. K. Barton,
J. B. Hoying, and
C. J. Sullivan,
“Use of microbubbles as an optical coherence tomography contrast agent,”
Acad. Radiol., 9 S52
–S55
(2002). 1076-6332 Google Scholar
T. M. Lee,
A. L. Oldenburg,
S. Sitafalwalla,
D. L. Marks,
W. Luo,
F. J. Toublan,
K. S. Suslick, and
S. A. Boppart,
“Engineered microsphere contrast agents for optical coherence tomography,”
Opt. Lett., 28
(17), 1546
–1548
(2003). 0146-9592 Google Scholar
C. Xu,
J. Ye,
D. L. Marks, and
S. A. Boppart,
“Near-infrared dyes as contrast-enhancing agents for spectroscopic optical coherence tomography,”
Opt. Lett., 29
(14), 1647
–1649
(2004). https://doi.org/10.1364/OL.29.001647 0146-9592 Google Scholar
Y. Yang,
P. O. Bagnaninchi,
S. C. Whiteman,
D. G. van Pittius,
A. J. El Haj,
M. A. Spiteri, and
R. K. Wang,
“A naturally occurring contrast agent for OCT imaging of smokers’ lung,”
J. Phys. D, 38 2590
–2596
(2005). 0022-3727 Google Scholar
A. L. Oldenburg,
J. R. Gunther, and
S. A. Boppart,
“Imaging magnetically labeled cells with magnetomotive optical coherence tomography,”
Opt. Lett., 30
(7), 747
–749
(2005). https://doi.org/10.1364/OL.30.000747 0146-9592 Google Scholar
C. Yang,
“Molecular contrast optical coherence tomography: a review,”
Photochem. Photobiol., 81 215
–237
(2005). https://doi.org/10.1562/2004-08-06-IR-266.1 0031-8655 Google Scholar
S. A. Boppart,
A. L. Oldenburg,
C. Xu, and
D. L. Marks,
“Optical probes and techniques for molecular contrast enhancement in coherence imaging,”
J. Biomed. Opt., 10
(4), 41208
(2005). 1083-3668 Google Scholar
K. D. Rao,
M. A. Choma,
S. Yazdanfar,
A. M. Rollins, and
J. A. Izatt,
“Molecular contrast in optical coherence tomography by use of a pump-probe technique,”
Opt. Lett., 28
(5), 340
–342
(2003). https://doi.org/10.1038/425340a 0146-9592 Google Scholar
C. Yang,
L. E. McGuckin,
J. D. Simon,
M. A. Choma,
B. E. Applegate, and
J. A. Izatt,
“Spectral triangulation molecular contrast optical coherence tomography with indocyanine green as the contrast agent,”
Opt. Lett., 29
(17), 2016
–2018
(2004). https://doi.org/10.1364/OL.29.002016 0146-9592 Google Scholar
C. Yang,
M. A. Choma,
L. E. Lamb,
J. D. Simon, and
J. A. Izatt,
“Protein-based molecular contrast optical coherence tomography with phytochrome as the contrast agent,”
Opt. Lett., 29
(12), 1396
–1398
(2004). https://doi.org/10.1364/OL.29.001396 0146-9592 Google Scholar
J. S. Bredfeldt,
C. V. Vinegoni,
D. L. Marks, and
S. A. Boppart,
“Molecularly sensitive optical coherence tomography,”
Opt. Lett., 30
(5), 495
–497
(2005). https://doi.org/10.1364/OL.30.000495 0146-9592 Google Scholar
H. Cang,
T. Sun,
Z. Li,
J. Chen,
B. J. Wiley,
Y. Xia, and
X. Li,
“Gold nanocages as contrast agents for spectroscopic optical coherence tomography,”
Opt. Lett., 30
(22), 3048
–3050
(2005). https://doi.org/10.1364/OL.30.003048 0146-9592 Google Scholar
K. Sokolov,
M. Follen,
J. Aaron,
I. Pavlova,
A. Malpica,
R. Lotan, and
R. Richards-Kortum,
“Real-time vital optical imaging of precancer using anti-epidermal growth factor receptor antibodies conjugated to gold nanoparticles,”
Cancer Res., 63 1999
–2004
(2003). 0008-5472 Google Scholar
C. H. Loo,
A. W. H. Lin,
M. Lee,
J. K. Barton,
N. J. Halas,
J. L. West, and
R. A. Drezek,
“Nanoshell-enabled photonics-based imaging and therapy of cancer,”
Technol. Cancer Res. Treat., 3 33
–40
(2004). 1533-0346 Google Scholar
K. Chen,
Y. Liu,
G. Ameer, and
V. Backman,
“Optimal design of structured nanospheres for ultrasharp light-scattering resonances as molecular imaging multilabels,”
J. Biomed. Opt., 10 024005
(2005). https://doi.org/10.1117/1.1899684 1083-3668 Google Scholar
A. W. H. Lin,
N. A. Lewinski,
J. L. West,
N. J. Halas, and
R. A. Drezek,
“Optically tunable nanoparticle contrast agents for early cancer detection: model-based analysis of gold nanoshells,”
J. Biomed. Opt., 10 064035
(2005). https://doi.org/10.1117/1.2141825 1083-3668 Google Scholar
J. Chen,
F. Saeki,
B. J. Wiley,
H. Cang,
M. J. Cobb,
Z. Y. Li,
L. Au,
H. Zhang,
M. B. Kimmey,
X. Li, and
Y. Xia,
“Gold nanocages: bioconjugation and their potential use as optical imaging contrast agents,”
Nano Lett., 5
(3), 473
–477
(2005). https://doi.org/10.1021/nl047950t 1530-6984 Google Scholar
C. Loo,
L. Hirsch,
M. Lee,
E. Chang,
J. L. West,
N. J. Halas, and
R. A. Drezek,
“Gold nanoshell bioconjugates for molecular imaging in living cells,”
Opt. Lett., 30
(9), 1012
–1014
(2005). https://doi.org/10.1364/OL.30.001012 0146-9592 Google Scholar
D. Sarkar and
N. J. Halas,
“General vector basis function solution of Maxwell’s equations,”
Phys. Rev. E, 56 1102
–1112
(1997). https://doi.org/10.1103/PhysRevE.56.1102 1063-651X Google Scholar
S. J. Oldenburg,
“Light scattering from gold nanoshells,”
Rice University,
(1999). Google Scholar
A. L. Aden and
M. Kerker,
“Scattering of electromagnetic waves from two concentric spheres,”
J. Appl. Phys., 22 1242
–1246
(1951). https://doi.org/10.1063/1.1699834 0021-8979 Google Scholar
C. F. Bohren and
D. R. Huffman, Absorption and Scattering of Light by Small Particles, Wiley, New York (1983). Google Scholar
S. L. Westcott,
J. B. Jackson,
C. Radloff, and
N. J. Halas,
“Relative contributions to the plasmon lineshape of metal nanoshells,”
Phys. Rev. B, 66 155431
(2002). https://doi.org/10.1103/PhysRevB.66.155431 0163-1829 Google Scholar
D. G. Duff,
A. Baiker, and
P. P. Edwards,
“New hydrosol of gold clusters. 1. Formation and particle size variation,”
Langmuir, 9 2301
–2309
(1993). https://doi.org/10.1021/la00033a010 0743-7463 Google Scholar
J. Bush,
P. Davis, and
M. A. Marcus,
“All-fiber optic coherence domain interferometric techniques,”
Proc. SPIE, 4204 71
–80
(2000). 0277-786X Google Scholar
U. Sharma,
N. Fried, and
J. Kang,
“All-fiber common-path optical coherence tomography: sensitivity optimization and system analysis,”
IEEE J. Sel. Top. Quantum Electron., 11
(4), 799
–805
(2005). 1077-260X Google Scholar
T. Troy and
S. N. Thennadil,
“Optical properties of human skin in the near infrared wavelength range of 1000 to ,”
J. Biomed. Opt., 6
(2), 167
–176
(2001). https://doi.org/10.1117/1.1344191 1083-3668 Google Scholar
R. K. Wang,
“Signal degradation by multiple scattering in optical coherence tomography of dense tissue: a Monte Carlo study towards optical clearing of biotissues,”
Phys. Med. Biol., 47 2281
–2299
(2002). https://doi.org/10.1088/0031-9155/47/13/307 0031-9155 Google Scholar
T. T. Kwok and
R. M. Sutherland,
“Differences in EGF related radiosensitisation of human squamous carcinoma cells with high and low numbers of EGF receptors,”
Br. J. Cancer, 64
(2), 251
–254
(1991). 0007-0920 Google Scholar
G. Carpenter,
“Receptors for epidermal growth factor and other polypeptide mitogens,”
Annu. Rev. Biochem., 56 881
–914
(1987). 0066-4154 Google Scholar
H. Maeda,
J. Fang,
T. Inutsuka, and
Y. Kitamoto,
“Vascular permeability enhancement in solid tumor: various factors, mechanisms involved and its implications,”
Int. J. Immunopharmacol, 3 319
–328
(2003). 0192-0561 Google Scholar
O. Ishida,
K. Maruyama,
K. Sasaki, and
M. Iwatsuru,
“Size dependent extravasation and interstitial localization of polyethyleneglycol liposomes in solid tumor-bearing mice,”
Int. J. Pharm., 190 49
–56
(1999). 0378-5173 Google Scholar
S. Unezaki,
K. Maruyama,
J. Hosoda,
I. Nagae,
Y. Koyanagi,
M. Nakata,
O. Ishida,
M. Iwatsuru, and
S. Tsuchiya,
“Direct measurement of the extravasation of polyethyleneglycol-coated liposomes into solid tumor tissue by in vivo fluorescence microscopy,”
Int. J. Pharm., 144 11
–17
(1996). 0378-5173 Google Scholar
G. L. McIntire,
E. R. Bacon,
K. J. Illig,
S. B. Coffey,
B. Singh,
G. Bessin,
M. T. Shore, and
G. L. Wolf,
“Time course of nodal enhancement with CT X-ray nanoparticle contrast agents: effect of particle size and chemical structure,”
Invest. Radiol., 35
(2), 91
–96
(2000). 0020-9996 Google Scholar
|