
|
|
1.IntroductionPhotothermal (PT) response is generated by the heating of a sample due to absorption of electromagnetic radiation in a short pulse or continuous train of pulses.1 Absorption of pulsed laser radiation in a sample generates PT effects, including a temperature increase, refractive index change, and thermoelastic surface displacement.1 Detection of PT effects and associated signal processing have been applied in many areas including photoacoustic spectroscopy, nondestructive evaluation, and thermal property determination.2 The detection of laser-induced optical path length change as a photothermal effect may aid tissue diagnostics in biomedical applications such as imaging3 and sensing.4 Optical path length changes in tissue in response to absorption of pulsed laser light result from refractive index change.5 Thermal expansion as well as refractive index change results in a transient optical path length variation in laser-heated tissue.5 Spatial variation of refractive index is a fundamental optical property of tissue and can provide useful and critical information about structure and physiological function. Because water and protein are primary constituents of all living systems, relevant optical and thermal properties are of interest in investigating optical effects in tissue. Fortunately, national and international standards organizations have invested substantial resources in characterizing the thermophysical properties of water. For proteins, substantially less data are available relating to refractive index and variation with temperature and pressure. The dependence of water refractive index on temperature has been measured6, 7, 8 and a formulation for the refractive index of water in the temperature range of to was published over the wavelength range of 0.2 to .8 The formulation was based on data collected by Thormählen, Straub, and Grigull.9 Most published data relate to refractive index of water in the visible wavelength range. Direct measurement of water refractive index in the near infrared (NIR) is complicated by thermal effects induced by absorption of the probing radiation.6 For refractive index change in the IR, studies using interferometers, including Fabry-Perot and Mach-Zehnder configurations, have produced the most accurate data.7 Richerzhagen used a single Michelson interferometer to measure refractive index of liquid water. In these experiments, water in a thermally isolated cell is maintained at a constant temperature by external circulation, which allows direct refractive index measurement without knowledge of thermal expansion.7 Water refractive index was measured by displacing a mirror positioned inside the water cell.7 For thermal expansion measurement, Takenaka and Masui measured thermal expansion of pure water by the dilatometric method in a temperature range from 0 to .10 However, the dilatometer requires a mercury bulb that is connected to the water cell covered by a thermostat. Therefore, a noninvasive optical interferometric technique to measure both refractive index change and thermal expansion with higher sensitivity may be useful. Optical coherence tomography (OCT) was introduced as a technique to record a cross sectional image of subsurface tissue structure with micron-scale resolution.11 Conventional OCT has been used as a promising diagnostic modality for imaging a variety of tissues and detecting tissue structures.12, 13 However, photothermal response requires a relative strain or stress change measurement related to light absorption by specific tissue chromophores. Correspondingly, detection of laser-induced thermoelastic displacement requires measurement of relative displacement between two points in a sample to deduce optical path length change due to thermal expansion.14 Differential phase optical coherence tomography (DPOCT) is introduced in this study to measure the optical path length changes resulting from absorption of pulsed laser radiation. DPOCT is a birefringent-fiber-based dual-channel low-coherence Michelson interferometer that is capable of differential phase measurement between light backscattered from two spatially separated sites in a sample.15 Advantages of DPOCT are phase sensitivity as low as radians16 and a high signal-to-noise ratio (SNR) due to common phase noise rejection.15 Tissue response to thermal, electrical, or chemical stimuli have been detected by DPOCT. Electrokinetic response of cartilage3, 17 has been measured and the optical path length change due to chemical concentration change was studied for various analytes.4 DPOCT is capable of measuring relative phase change with laser irradiation to detect laser-induced optical path length change. The tissue response of the atherosclerotic artery3 and a human hair in an epoxy phantom14 in response to laser irradiation has been investigated. Despite these studies, a quantitative investigation of optical path length change and the relative mechanisms using DPOCT has not been completed. In this study, quantitative laser-induced optical path length change is investigated by accounting for variation induced by refractive index change and thermal expansion. 2.Materials and Methods2.1.TheoryOptical path length in a sample is the spatial integral of the refractive index with respect to position along a path perpendicular to the wavefront. Before laser irradiation, the refractive index of a sample without external mechanical or thermal stress is assumed to be homogeneous, and optical path length can be written as a product of refractive index and sample thickness under isothermal conditions.5 where is a sample refractive index at initial temperature , and and are front and back surface locations in the sample, respectively.When laser radiation is absorbed in a translucent sample, the temperature profile in the sample can be approximated by the Beer-Lambert law. where is the absorption coefficient of the material at the laser wavelength.In the following, an analytical model is developed that requires several assumptions
As temperature increases, the refractive index and thermal expansion coefficient of water change linearly over the temperature range of interest .6, 10 Thermoelastic surface deformation results from internal acoustic stress induced by laser heating. Sample deformation is given by a thermoelastic wave equation19, 20, 21 where is displacement, is a Young’s modulus, is Possion’s ratio ( for water), and is the thermal expansion coefficient.A quasi-steady-state equilibrium occurs after the transient acoustic stress has passed, and remains until thermal diffusion occurs.19 Therefore, the first term in the thermoelastic wave equation can be ignored. Additionally, displacement only in depth is taken into consideration, assuming the sample is homogeneous and the radial thermal gradient is small,20 consistent with assumption 3. Integrating each side of the equation with respect to depth , the thermoelastic displacement within the heated sample is Laser-induced optical path length change , including the thermorefractive and the thermoelastic contributions , are: where and are displacement of the front and back surface locations in response to laser irradiation.The first integral represents the thermorefractive contribution, while the second integral represents optical path length change by thermal expansion. When temperature increase in the sample is given by the Beer-Lambert law, an analytical expression for the laser-induced optical path length change may be written, where , and are constant, linear, quadratic, and cubic temperature dependence terms in optical path length change due to laser heating and are given explicitly in Eq. 9.2.2.Differential Phase Optical Coherence Tomography SystemThe differential phase optical coherence tomography (DPOCT) system used in this study (Fig. 1 ) is a polarization maintaining (PM) fiber-based Michelson interferometer and has been previously described. 3, 4, 14, 15, 16, 17, 20. DPOCT is capable of measuring an optical path length difference between backscattered light from two spatially separated sites in a sample. Fig. 1Differential phase sensitive optical coherence tomography (DPOCT) system with a flashlamp pumped excitation laser (LS), lens (L), rapid scanning optical delay (RSOD) line, grating (G), detector (D), Wollaston prisms (W), and sample (S). 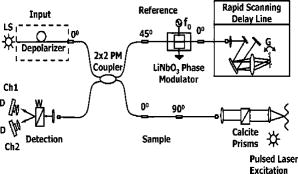 Partially polarized light in a single spatial mode is emitted from an optical semiconductor amplifier [AFC Technologies Inc., Hull. Quebec, Canada, and full width at half maximum (FWHM) of and delivered into the DPOCT system through a polarization-maintaining (PM) fiber.15 The partially polarized incident light is depolarized and decorrelated into two independent linearly polarized modes by the PM fiber.16 A lithium niobate electro-optic waveguide phase modulator projects out components of the two depolarized modes along a single axis. The rapid scanning optical delay (RSOD) line22 compensates material and waveguide dispersion introduced by the phase modulator. Interference is formed in a coupler when optical path lengths of backscattered light from reference and sample arms are equal.16 Detected light intensity in horizontal (H) and vertical (V) channels formed by interference between the sample and reference paths are given by, where in the first and second terms are electric field amplitudes from the reference and sample , and is the relative time delay. Here, are the time delays introduced in horizontal and vertical channels by a birefringent calcite prism pair in the sample arm of the DPOCT system. The birefringent calcite prism allows a user-selectable time delay between horizontal and vertical channels. Interference fringe signals from front and back surfaces of a sample are obtained by adjusting introduced by the calcite prism pair.2.3.Sample PreparationA dye solution (Brilliant Blue, Sigma-Aldrich Company, Saint Louis, Missouri) was used as a sample in this study. The dye has peak absorbance at wavelength and is placed in a glass container to measure the laser-induced optical path length change between the air-solution and solution-glass interfaces (see Fig. 2 ). A transparent plastic cover was positioned over the glass container and used to diminish phase variations induced by evaporation of the dye solution. The optical and physical thickness of the dye solution between the air-solution and solution-glass interfaces was 1.61 and , respectively. The optical thickness of the dye-solution was measured by DPOCT. Because the air-solution interface was free to move, experiments involving this model are referred to as “free surface.” Fig. 2Sample configuration: (a) Dye solution confined in a glass chamber, and (b) dye solution with one surface exposed to air.  The optical path length variation due to thermorefractive change is measured using another model system. For this experiment, the dye solution is placed between two glass surfaces. The top glass surface was loaded with weights to prevent movement resulting from longitudinal thermal expansion of the dye solution. In addition, the dye solution was allowed to expand laterally to minimize longitudinal movement of the top glass surface. Since DPOCT measures longitudinal optical path length change, contributions due to longitudinal thermal expansion of the confined dye solution are eliminated in this model system. The optical and physical thicknesses of the dye solution were 0.88 and , respectively. Because the glass-solution interfaces were fixed, experiments involving this model are referred to as “confined surface.” Absorbance of the dye solution was measured by a spectrometer (DU 7400, Beckman, Fullerton, California) with a 1-cm path length sample holder. The absorbance was measured 20 times and found to be . The optical absorption coefficient was calculated from the absorbance as where is the physical thickness of the dye solution. As a result, the measured absorption coefficient of the dye solution at wavelength was .2.4.Signal Processing for Differential Phase CalculationA phase-invariant bandpass type 2 Chebyshev filter is used to denoise fringe signals, and a Hilbert transform is used to calculate phase. The phase change is unwrapped to avoid phase jumps, and differential phase is obtained by subtracting two channel phases.16 Schematic of the signal processing is shown in Fig. 3 . The optical path length change determined from differential phase change is calculated by: where is center wavelength of the DPOCT source.2.5.Laser Irradiation and Temperature Increase MeasurementA flash-lamp pumped pulsed dye laser (SPTL-1, Candela Corporation, Wayland, Massachusetts) was used to irradiate the dye solution at a range of energies. Determination of temperature increase at the surface of the dye solution is required to compare measured optical path length changes with predicted values using thermophysical properties of water. For a range of temperature increases, laser irradiance with different laser energies is required. Reflected laser intensity from a cover slip, positioned in the sample arm of the DPOCT system, was detected by a photoreceiver (model 1623, New Focus) during the laser pulse (pulse duration: 400 to ). Simultaneously, laser energy at the surface of the dye solution was measured by an energy meter (EPM 2000, Molectron, Portland, Oregon). The laser intensity was integrated with respect to time, and the time-dependent pulsed laser energy with different powers was measured (see Fig. 4 ). A conversion ratio from the integrated laser intensity to pulsed laser energy was determined to calculate temperature change in the dye solution [Eq. 14]. Furthermore, the mirror reflectivity and angle of incident light on the dye solution were measured. Fresnel reflection from the glass and plastic covers were measured for confined surface and free surface experiments, respectively. The laser energy irradiating the sample was calculated by the product of the measured laser energy and the net transmission coefficient . The net transmission coefficient of the laser energy is the product of mirror reflectivity and the Fresnel transmission coefficient . The temperature increase at the surface of the dye solution was calculated as: where is the measured absorption coefficient of the dye solution, is a net conversion ratio that is a product of the conversion ratio and the net transmission coefficient , “area” is a spot area ( , ), is density, and is heat capacity at constant pressure.3.Results3.1.Laser-Induced Temperature IncreaseThe measured laser intensities for both confined surface and free surface cases show 400- to pulse durations, which is shorter than thermal diffusion time and linear increase with higher laser energy (Fig. 5 ). The conversion ratio between the intensity integral and laser energy is Computed net transmission coefficients are: where and are net transmissions for confined surface and free surface experiments, respectively.Fig. 5Detected laser intensity for surface temperature increase measurement. (a) shows measured laser intensities for the confined surface and (b) shows laser intensities for the free surface case.  Moreover, is mirror reflectivity, and are Fresnel reflection coefficients23 from the glass lid and the dye solution, respectively, and is measured transmission through the plastic cover. The net transmission is included in the conversion ratio to obtain irradiance at the surface of the dye solution. The net conversion ratio for confined and free surface experiments are and , respectively. 3.2.Differential Phase ChangeThe measured differential phase changes for free surface and confined surface experiments are shown in Fig. 6 . For the confined surface experiment, the thermorefractive change governed the measured differential phase change. In the free surface experiment, the thermoelastic and thermorefractive changes contributed to the differential phase change. The corresponding optical path length decreases for the confined surface case, and the optical path length for the free surface case increases in response to laser irradiation. Fig. 6Differential phase change during a pulse duration for (a) confined surface case and (b) free surface case. Averaged pulsed laser energy is shown in legend.  Larger differential phase changes were detected in response to greater absorbed laser energy in the dye solution. The differential phase decreases for the confined surface case and increases in the free surface case. The differential phase increase due to thermal expansion is stronger (about two times) than that due to water refractive index decrease(Fig. 6). 4.DiscussionThe optical path length change due to thermorefractive change and thermoelastic surface displacement of a dye solution in response to pulsed laser heating was investigated by correlating detected differential phase change and temperature increase . Values for and , for confined surface and free surface experiments, respectively, were obtained using the curve-fitted linear temperature dependence term in Eq. 9. A linear differential phase decrease observed in the confined surface experiment (Fig. 7 ) is due to refractive index decrease of water in the dye solution. The measured is . The only available data to validate our result are the temperature-dependent water refractive index estimated by the National Institute of Standards and Technology (NIST) formulation that gives at at constant atmospheric pressure from 20 to . The measured is about two times greater than the NIST value. The difference between the values is believed to be due to lateral thermal expansion of the dye solution, which is not properly accounted for in our 1-D model. The lateral thermal expansion decreased the density and resulted in a lower value than that given by NIST data. A constrained surface experiment with a larger spot diameter that better matches the 1-D model will provide a measured closer to the NIST value. The differential phase change in the free surface experiment shows a cubic dependence on temperature increase due to both thermal expansion and refractive index change (Fig. 8 ). The was obtained by a curve fit to differential phase change data. The measured closely matches the NIST value . We have derived an analytical equation that includes thermoelastic surface displacement and thermorefractive index change that predicts optical path length change in response to pulsed laser irradiation for both confined and free surface model systems. Validity of the derived equation was tested by completing experiments using free and confined surface model systems. Results of the experiments allowed us to deduce values for the thermorefractive index change and thermal expansion coefficient at with comparison to published data (NIST). The difference in measured value of with that given by NIST may be due to lateral thermal expansion of the heated dye solution that is not accounted for in the 1-D model. A higher power laser that gives a larger spot size is necessary to test DPOCT data within the context of the 1-D model presented here. Since DPOCT can detect dynamic optical path length change in response to pulsed laser irradiation with high sensitivity, applications to tissue diagnostics may be possible. Quantitative interpretation of optical path length changes in tissue in response to pulsed laser irradiation, however, will require knowledge of changes resulting from thermoelastic and thermorefractive changes of specific tissue constituents. Because tissues consist principally of water and proteins, results reported here are expected to have value in understanding the response of protein-water composite systems such as tissue. The application of DPOCT to tissues will require additional studies that investigate the thermoelastic and thermorefractive responses of proteins. In addition, effect of water-protein interfaces on the thermoelastic and thermorefractive response will require further study for quantitative application of DPOCT to tissues. Experiments to investigate the thermoelastic and thermorefractive response of protein-water systems are underway in our laboratory and will be reported in the future. ReferencesJ. A. Sell,
(1989). Google Scholar
D. P. Almond and
P. M. Patel,
(1996). Google Scholar
T. Akkin,
D. P. Dave,
J. I. Youn,
S. A. Telenkov, H. G. Rylander III, T. E. Milner,
“Imaging tissue response to electrical and photothermal stimulation with nanometer sensitivity,”
Lasers Surg. Med., 33 219
–225
(2003). 0196-8092 Google Scholar
K. V. Larin,
T. Akkin,
R. O. Esenaliev,
M. Motamedi, and
T. E. Milner,
“Phase-sensitive optical low-coherence reflectometry for the detection of analyte concentrations,”
Appl. Opt., 43 3408
–3414
(2004). https://doi.org/10.1364/AO.43.003408 0003-6935 Google Scholar
T. Y. Fan and
J. L. Daneu,
“Thermal coefficients of the optical path length and refractive index in YAG,”
Appl. Opt., 37 1635
–1637
(1998). 0003-6935 Google Scholar
A. H. Harvey,
J. S. Gallagher, and
J. M. H. L. Sengers,
“Revised formulation for the refractive index of water and stream as a function of wavelength, temperature and density,”
J. Phys. Chem. Ref. Data, 27 761
–774
(1998). 0047-2689 Google Scholar
B. Richerzhagen,
“Interferometer for measuring the absolute refractive index of liquid water as a function of temperature at ,”
Appl. Opt., 35 1650
–1653
(1996). 0003-6935 Google Scholar
P. Schiebener,
J. Straub,
J. M. H. L. Sengers, and
J. S. Gallagher,
“Refractive index of water and stream as function of wavelength, temperature and density,”
J. Phys. Chem. Ref. Data, 19 677
–717
(1990). 0047-2689 Google Scholar
I. Thormählen,
J. Straub, and
U. Grigull,
“Refractive index of water and its dependence on wavelength, temperature, and density,”
J. Phys. Chem. Ref. Data, 14 933
–945
(1985). 0047-2689 Google Scholar
M. Takenaka and
R. Masui,
“Measurement of the thermal expansion of pure water in the temperature range ,”
Metrologia, 27 165
–171
(1990). 0026-1394 Google Scholar
D. Huang,
E. A. Swanson,
C. P. Lin,
J. S. Schuman,
W. G. Stinson,
W. Chang,
M. R. Hee,
T. Flotte,
K. Gregory,
C. A. Puliafifo, and
J. G. Fujimoto,
“Optical coherence tomography,”
Science, 254 1178
–1181
(1991). 0036-8075 Google Scholar
J. F. de Boer,
S. M. Shrinivas,
A. Malekafzali,
Z. Chen, and
J. S. Nelson,
“Imaging thermally damaged tissue by polarization sensitive optical coherence tomography,”
Opt. Express, 3 212
–218
(1998). 1094-4087 Google Scholar
J. M. Schmitt,
“Optical coherence tomography (OCT): a review,”
IEEE J. Sel. Top. Quantum Electron., 5 1205
–1215
(1999). https://doi.org/10.1109/2944.796348 1077-260X Google Scholar
S. A. Telenkov,
D. P. Dave,
S. Sethuraman,
T. Akkin, and
T. E. Milner,
“Differential phase optical coherence probe for depth-resolved detection of photothermal response in tissue,”
Phys. Med. Biol., 49 111
–119
(2004). 0031-9155 Google Scholar
D. P. Dave and
T. E. Milner,
“Optical low-coherence reflectometer for differential phase measurement,”
Opt. Lett., 25 227
–229
(2000). 0146-9592 Google Scholar
T. Akkin,
D. P. Dave,
T. E. Milner, H. G. Rylander III,
“Interferometric fiber based optical biosensor to measure ultra-small changes in refractive index,”
Proc. SPIE, 4616 9
–13
(2002). 0277-786X Google Scholar
J. I. Youn,
T. Akkin, and
T. E. Milner,
“Electrokinetic measurement of cartilage using differential phase optical coherence tomography,”
Physiol. Meas, 25 85
–95
(2004). 0967-3334 Google Scholar
L. V. Zhigilei and
B. J. Garrison,
“Microscopic mechanisms of laser ablation of organic solids in the thermal and stress confinement irradiation regimes,”
J. Appl. Phys., 88 1281
–1298
(2000). https://doi.org/10.1063/1.373816 0021-8979 Google Scholar
M. L. Dark,
L. T. Perelman,
I. Itzkan,
J. L. Scaffer, and
M. S. Feld,
“Physical properties of hydrated tissue determined by surface interferometry of laser-induced thermoelastic deformation,”
Phys. Med. Biol., 45 529
–539
(2000). https://doi.org/10.1088/0031-9155/45/2/318 0031-9155 Google Scholar
N. F. Homji,
“Detection of atherosclerotic plaque: A theoretical model of the laser-tissue interaction,”
in Biomedical Engineering, 13
–43 University of Texas at Austin, Austin (2003). Google Scholar
L. D. Landau and
E. M. Lifshitz, Theory of Elasticity, Pergamon, NY (1959). Google Scholar
G. J. Tearney,
B. E. Bouma, and
J. G. Fujimoto,
“High-speed phase and group-delay scanning with a grating-based phase control delay line,”
Opt. Lett., 22 1811
–1813
(1997). 0146-9592 Google Scholar
E. Hecht, Optics, Addison-Wesley, Reading, MA (1998). Google Scholar
|


