
|
|
1.Introduction1.1.Clinical ProblemOvarian cancer has a low prevalence, with approximately 25,000 new cases in 2004, but it is the fifth leading cause of death from cancer in women in the United States (more than 16,000 in 2004).1 Ovarian cancer in its early stages may lack definite symptoms, and most ovarian cancer is detected in stage 3 or 4 (70%). The high prevalence of late-stage disease, the high rate of recurrence after initial treatment, and the development of resistance to chemotherapy are the major factors that give ovarian cancer such a dismal prognosis. Epithelial ovarian cancer occurs most commonly in postmenopausal women2 and is thought to arise from the surface epithelium or from the epithelium lining the inclusion cysts. Hereditary ovarian cancers comprise at least 10% of ovarian cancer and include women with a BRCA 1 or 2 mutation who may have up to a 50% lifetime risk of ovarian cancer, and women with a strong family history of breast cancer (particularly premenopausal breast cancer), but who do not carry an identifiable mutation.3, 4 Little is known about the precursor lesions or early stage ovarian cancer partially due to the paucity of human samples available at the early stages of disease and the lack of well-characterized animal models. However, evidence points to a precursor lesion for ovarian cancer similar to other epithelial cancers. Small collections of malignant cells contiguous with normal ovarian epithelium that do not involve underlying tissues are suggestive of an intraepithelial neoplasia and can be found in: 1. ovaries removed from women who eventually develop primary peritoneal carcinomatosis;5 2. high risk women who undergo prophylactic oophorectomy,6 particularly those with the BRCA1 mutations;7, 8 and 3. in areas adjacent to stage 1 cancers that show a transition from malignant to normal epithelium.9, 10 Currently the only option for high risk women is prophylactic oophorectomy, which induces premature menopause. The risks of hormone replacement may be elevated for this population. Thus, high risk women who desire to avoid or delay oophorectomy would greatly benefit from a diagnostic test that could assess the ovarian epithelium and assess the presence of a premalignant lesion. 1.2.Animal ModelsTo effectively study the progression of disease, an accurate and well-characterized animal model is essential. Current ovarian cancer models include spontaneous ovarian tumorigenesis animals (hens in intensive egg laying conditions), xenograft (both intrabursal and intraperitoneal), and direct ovarian exposure to known carcinogens.11 Malignant epithelial-based tumors can be induced with a 10 to 50% incidence in the rat ovary by placing a 7,12-dimethylbenz(a)anthracene (DMBA)-coated suture through the ovary.12, 13, 14, 15 Nishida administered of DMBA via a suture through the ovary in rats. The animals were sacrificed between , depending on when the tumors distended the abdominal wall. 50% of these animals developed carcinomas, most of which were epithelial based.12 All the studies to date have been performed on young, reproductive animals because unlike humans, female rodents do not undergo natural ovarian senescence until shortly before death. The structure and function of the ovary varies dramatically through the stages of life: prepubertal, reproductive, and postreproductive. Until recently there has not been a laboratory animal in which gradual ovarian senescence could be induced, although such an animal would be ideal due to the higher incidence of ovarian cancer in postmenopausal women. A model has been developed by one of the authors in which the normal atresia of ovarian follicles in mice was accelerated by administering of the occupational chemical 4-vinylcyclohexene diepoxide (VCD) daily for .16, 17 In this model, VCD selectively destroys small primordial and primary ovarian follicles. Subsequently, larger, more developed follicles are lost, as there is no longer a sufficient supply of preantral follicles to support development for ovulation. The result is a gradual onset of ovarian failure (model for perimenopause). Whereas this model has been well characterized in mice, mechanistic studies in rats using lower doses of VCD also have demonstrated selective targeting of primordial and primary follicles,18 with ovarian failure produced in rats dosed with for .19 At this low dose, irregular cycles were observed but ovarian failure did not occur until one year after the onset of dosing. Changes in hormone levels in the VCD-treated rodent model are similar to those in women undergoing menopause. As ovarian function becomes compromised, circulating follicle stimulating hormone (FSH) levels increase as the follicles degrade and the estrogen and progesterone levels decrease.19 While the rat has a tendency to ovulate multiple eggs per cycle and has a protective covering on the ovary (the bursa), especially once follicle deplete, the ovarian structure is similar to that of women. Given this hormonal and anatomical similarity, together with ease of handling and ovaries large enough to manipulate and image, the rat is an excellent animal for our studies. One goal of the present study was to develop a follicle deplete rat model and induce ovarian cancer with DMBA to aid comprehensive studies of postmenopausal ovarian cancer. 1.3.Current Ovarian Imaging Techniques and LimitationsCurrent minimally invasive methods for detecting ovarian cancer include pelvic examination, transvaginal ultrasound, and a blood test for tumor marker CA125, but each test has limitations. The pelvic examinations do not detect ovarian cancer in its early stages because of the small size and deep location of the ovaries. One study found only 30% sensitivity in women with known pelvic masses using pelvic exam.20 Screening ultrasound also has poor performance. An analysis of five studies showed screening ultrasound to have a specificity of 95% but only a 3.1% positive predictive value.21 Elevated levels of the ovarian protein CA125 are often an indication of ovarian cancer, but increased levels of this factor are also associated with pregnancy, liver disease, and endometriosis. The glycol-protein is elevated in 50% or less of stage 1 epithelial cancers. The National Institutes of Health (NIH) 1994 consensus stated that there is no single acceptable screening test for ovarian cancer and no evidence that combining the available screening test, CA125, transvaginal ultrasound, and pelvic exam has an acceptable sensitivity and specificity.22 1.4.Optical ModalitiesOptical imaging modalities have high resolution, are relatively simple and low cost, and are sensitive to both structure and function. They have been used with success to image human and animal model epithelial precancers, for example in the colon23, 24, 25 and oral cavity.26, 27 Few studies have been performed on the ovary, and none to our knowledge on the rat ovary. Therefore, the second goal of this study was to investigate the utility of two optical modalities, optical coherence tomography (OCT) and light-induced fluorescence (LIF), to characterize the microstructure and biochemical composition of the rat ovary. OCT is a high resolution, cross sectional imaging modality analogous to ultrasound. It uses a low coherence near-infrared light source to obtain depth-resolved images of tissue microstructure. Even in highly scattering tissues, structures up to deep can be imaged.28, 29 OCT imaging is acceptable for gynecological applications because it is fiber based, allowing for measurements to be performed laparoscopically. The feasibility of imaging ex-vivo human ovary samples has been reported by two other groups.30, 31, 32 In a pilot study, we showed that OCT is sensitive to normal human ovarian structures (e.g., epithelium, follicles) and that diseases such as cancer and endometriosis have a distinct appearance that correlates well with corresponding histology images. OCT distinguished cancer by identifying a superficial mass on the ovarian surface as well as by identifying irregular hypointense areas of necrotic tissue.33 In light-induced fluorescence (LIF), the tissue is illuminated with short wavelength light and the light emitted by fluorophores provides clues to the samples’ biochemical composition. The main intrinsic fluorophores in ovarian tissue are elastin, collagen, tryptophan, flavin adenine dinucleotide (FAD), and nicotinamide adenine dinucleotide (NADH). Different fluorophores are characterized by distinct absorption and emission spectra. For a fixed excitation wavelength, the fluorescence emission as a function of wavelength can be used to estimate the concentration of these fluorophores.34 Gynecological cancers have been investigated with fluorescence spectroscopy in human tissue using both autofluorescence and exogenous fluorophores.33, 35, 36 Ex-vivo studies have shown significant differences between the emission spectra of normal and cancerous ovaries33, 35 and in one study,33 high risk ovaries as well. Fluorescence spectroscopy of human ovarian tissue has been examined in vivo using excitation, and has shown promise in the early detection of cancer.36 In-vivo LIF of the ovaries of Rhesus macaques administered the potential chemopreventative agents fenretinide (4HPR) and/or oral contraceptives showed decreased fluorescence compared to controls at excitation/ emission, which is associated with a decrease in NADH.37 Because optical coherence and LIF systems measure distinct characteristics of tissue (structural and biochemical, respectively), a combined system may increase the sensitivity and specificity to disease, compared to each modality used alone.23, 38 For example, one study showed that by combining OCT and LIF data, tumor boundaries could be accurately detected in the cervix and vulva, and the number of false positives was reduced from that determined by each modality independently.38 1.5.Justification for Invasive Measurement of the OvaryThe use of optical techniques to image the ovary requires an invasive procedure. Optical access to the ovary is a major concern for this work in rats, as well as for potential translational relevance to women. In the rat, the right ovary is readily accessed through a small incision in the flank, and access at multiple timepoints is possible with minimum morbidity. In women, invasive access for screening purposes in the general population is unacceptable. However, two potential possibilities exist for the use of optical techniques to evaluate the ovary. The first is during laparoscopic surgery, when the decision is made whether or not to perform an oophorectomy. In this case, an invasive procedure is already being performed and the optical probes could be used in the instrument channel of the laparoscope. The second case is in high risk women who chose to undergo surveillance rather than prophylactic oophorectomy. Vaginal access to the ovary, such as is used for egg harvesting procedures, could provide an acceptable and less invasive mode of access for optical surveillance. 2.Materials and Methods2.1.Development of a Follicle Deplete AnimalFemale Fisher 344 rats (day 28, , Harlan Sprague Dawley) were dosed daily for with VCD ( i.p.). Beginning on day 65 from the start of the VCD injections, estrous cycles of the animals were monitored by daily vaginal cytology. The vaginal swabs were taken using 0.9% saline solution and a standard pauster pipette. The estrous cycles became irregular and lengthened in the period preceding follicle depletion due to the VCD injections. In the rat, the number of days in estrus increases with impending ovarian failure. Therefore, more than 5 consecutive days of estrus and cycles longer than were considered to be irregular. On day 102 after the onset of VCD dosing, two animals showing the most irregular estrous cycles were euthanized. The ovaries were removed and processed with standard paraffin embedding and hematoxylin and eosin staining. Remaining follicles were counted by looking at -thick sections taken apart. 2.2.Administration of 7,12-Dimethylbenz(a)anthraceneAnimals were surgically administered DMBA once they began to cycle erratically. DMBA sutures were fabricated using a supersaturated solution of acetone and DMBA. Sterile sutures were placed in the DMBA solution, and removed once crystals had formed. The sutures were kept in a clean environment until the time of surgery. At this time, the animals were anesthetized with Avertin . The upper right flank of each animal was shaved and used as an entry point to the right ovary, which offers easier access than the left ovary, which is blocked by the kidney. An incision of approximately was made through the skin, fascia, and abdominal wall, revealing a fat bed that contained the ovary, fallopian tube, and uterine horn. The ovary was identified and externalized. Silk sutures coated with DMBA (approximately /rat), were placed through the ovaries of 20 animals; six control animals were given a clean suture and one animal underwent a sham surgery (no suture inserted). Incisions were closed with surgical staples (approximately four per animal), and animals were given doses of penicillin and ibuprofen for recovery. One, three, and five months following insertion of the sutures, animals ( to 10/group) were euthanized and the ovaries from these animals were harvested. Excess fatty tissue was gently removed and the ovaries were rinsed with isotonic saline. Each was pinned to a wax block covered with nonfluorescing fabric. No superficial blood contamination was apparent. 2.3.Optical ImagingA total of 54 harvested ovaries were imaged using a combined OCT/LIF system. Table 1 lists the number and type of ovaries at each timepoint. The combined system has previously been discussed in detail.23 The OCT subsystem used a superluminescent diode source with a center wavelength of (D1399-HP, Superlum, Moscow, Russia). The resolution of the OCT subsystem was approximately lateral and axial. The LIF subsystem used a helium cadmium laser source operating at (Kimmon Electric, Englewood, Colorado). At this wavelength, both collagen and NADH are efficiently excited. Excitation light was delivered with a single unlensed multimode fiber. Fluorescence was collected using two separate multimode fibers and then directed to a spectrometer equipped with a cooled charge-coupled device (CCD). The OCT and LIF subsystems were optically combined in a -diam side-firing catheter. The OCT beam reached a focus from the catheter outer envelope; at this depth, the LIF spot size was approximately . The excitation light power on the tissue was , and the radiant exposure was , within American National Standards Institute (ANSI) maximal permissible exposure levels. Image size was typically set to lateral by deep. LIF data were acquired simultaneously with the OCT images at approximately in the lateral dimension. A water-based lubricant (nonfluorescent) was used as a coupling agent between the catheter and the tissue. Multiple images were acquired at increments across the entire dorsal surface of the ovary; each image required approximately to obtain. Time from excision of the ovary to the end of the imaging was less than . Data were acquired by computer and analyzed using Matlab (The MathWorks, Natick, Massachusetts). Following optical imaging, ovaries were fixed in Bouins, and processed for histological evaluation for confirmation of follicle depletion, and evaluation of neoplastic progression. Table 1Number and type of ovaries imaged at each timepoint.
2.4.Data AnalysisFeatures such as cysts, follicular remnant degeneration, and fat pads were identified on the OCT images by comparing each OCT image with the corresponding histologic image. The LIF data were grouped based on the type of animal and histologically confirmed pathology (normal cycling; sham surgery; clean sutured; contralateral to clean sutured; DMBA-treated normal appearing; DMBA-treated atypical; DMBA-treated neoplastic; and contralateral to DMBA-treated). Only spectra corresponding to probe positions within approximately one-half the distance from the center of the ovary to the edge were analyzed, because of the curved surface of the ovary and the large LIF spot size. Spectra from fatty tissue and ovarian cysts were also eliminated, so the analyzed regions were dominated by normal or abnormal stroma. At our excitation wavelength of , the observed signal was characterized by peaks near 390 and , which are generally associated with collagen and NADH fluorescence, respectively, and a dip at , generally associated with hemoglobin absorption. The ratios of these three wavelengths were plotted and compared between several of the LIF data groups. Analysis to determine a level of statistical significance between the groups was performed using the Student’s t-test. Since the LIF spectra are highly overlapping, in the statistical analysis was chosen to be the number of ovaries per group. 3.Results and Discussion3.1.Histological Appearance of OvariesOvarian follicle counts from a representative cycling control ovary, erratically cycling VCD-treated ovary (day 102), and ovary post-DMBA treatment (day 239) are displayed in Table 2 . The follicle counts indicate that the animals were nearly follicle deplete when they demonstrated erratic cycles. All animals were completely follicle deplete at the time of imaging and euthanasia. The presence of a single corpus luteum in the post-DMBA ovary suggested that the rat recently cycled its final oocyte. We confirmed histologically that VCD treatment ( for 20 consecutive days) produced complete follicle depletion in all animals within of the onset of dosing. Table 2Comparison of follicle count in cycling and VCD-treated ovaries.
The follicle deplete VCD-treated ovaries were visually much smaller than cycling ovaries ( compared to in diameter) and no longer had the grape cluster-like appearance of the normal cycling ovary. There were four types of control ovaries (contralateral to DMBA suture, clean suture, contralateral to clean suture, and sham surgery). At one and three months, there was no histologically identifiable difference between the ovaries contralateral to the DMBA and clean suture. However, at five months, two ovaries contralateral to DMBA-sutured ovaries displayed neoplasms. This finding suggests that systemic DMBA contamination or peritoneal seeding may be occurring. The ovaries that had a clean suture inserted exhibited a mild histological immune response (fibrosis and macrophages around the suture). Sham surgery ovaries were histologically normal. In general, the ovaries implanted with a DMBA suture were much larger than any of the control ovaries (except one of the neoplastic contralateral to DMBA-sutured ovaries). Ovarian atrophy was a common feature in the ovaries from all VCD-treated rats. However, necrosis of the granulosa cells was more prominent in the DMBA-treated ovaries, which may be a result of the DMBA suture insertion. The DMBA-coated suture elicited a chronic immune response stronger than that seen in the clean sutured control ovaries. The area surrounding the suture had fibrosis and many leucocytes and macrophages. At the one-month imaging time point (one month after DMBA suture insertion), all of the DMBA-exposed ovaries showed signs of ovarian atrophy. Three of seven ovaries showed some atypical changes but no cancer was seen. In general, the three month DMBA-exposed ovaries had features similar to one-month DMBA-exposed ovaries. A few ovaries had degenerating corpora lutea or luntienized cells. One of the ovaries contained papillary regions and proliferatative areas. The papillary regions were benign but thought to represent preneoplastic changes. Large cysts with areas of proliferation were visible in three ovaries; some of these proliferating regions contained abnormal cells but all were histologically benign. The five-month DMBA-treated animals showed more abnormalities than the previous timepoints. Three of these ovaries were neoplastic; the histological diagnoses were adenocarcinoma, granulosa-theca cell tumor with some cystadenocarcinoma, and Sertoli-Leydig cell tumor. Granulosa-theca and Sertoli-Leydig tumors are classified as sex cord tumors and are histologically low grade. Sex cord tumors arise from the stromal region of the ovary. Since the DMBA was directly in contact with the stroma, these findings are not unexpected. Our 1-in-3 incidence of epithelial-based tumors (the adenocarcinoma) is in agreement with a previous study, which found 39% of the cancers induced via DMBA were epithelial based.15 A summary of the histological classification of the DMBA-exposed ovaries at each time point can be seen in Table 3 . Table 3Summary of the histological classification of the VCD/DMBA-treated ovaries at each timepoint. Each ovary may be represented in more than one category.
3.2.Optical Coherence Tomography/Light-Induced Fluorescence Appearance of Ovaries3.2.1.Normal cycling ovaryA representative OCT image of a normal cycling ovary is shown in Fig. 1a . Well-defined structures are seen. A thin bursa and small fluid-filled (antral) follicles are visualized with OCT. The irregular surface is caused by multiple corpora lutea and could be imaged with OCT. While the penetration depth into the highly scattering ovarian tissue is relatively poor , these preliminary studies suggest that OCT can image many of the normal structures of a cycling rat ovary. A histological image from the same ovary can be seen in Fig. 1b. The corresponding LIF data are shown in Fig. 1c. As expected, two emission maxima are seen near 390 and . The magnitude of the peak is greater than the peak, and the dip at is well defined. This suggests that a relatively large amount of NADH and hemoglobin is present in the ovary. The large NADH content is probably due to the dynamic changes that accompany the menstrual cycle and the large number of oocytes that are released per cycle. There is an increase in vascularity in the ovary, especially during estrus. The presence of a peak is consistent with the presence of collagen, which is one of the components of the stroma. Fig. 1(a) OCT image, (b) histology section from same ovary, and (c) corresponding LIF spectra for a cycling rat ovary. The OCT image shows a follicle (F) and bursa (arrow), also seen in histology. Horizontal lines at the top of the OCT image are catheter window artifacts. Spectra show a strong peak. OCT image , histology to same scale. LIF vertical axis is wavelength in nanometers, horizontal axis is lateral distance , and grayscale value is emission intensity in au.  3.2.2.4-Vinylcyclohexene diepoxide-treated control ovariesThe follicle deplete control ovaries lacked fluid-filled follicles, and half of the ovaries lacked corpora lutea. In previous studies it was shown that VCD treatment caused weight gain in mice, possibly due to the hormonal changes associated with peri- and postovarian failure status of the animals. It was not surprising that in general, ovaries from VCD-treated animals had more superficial fat than ovaries from cycling rats. No obvious difference was found between OCT image appearance or LIF spectra of the contralateral ovary of clean suture control animals, sham surgery animals, or the contralateral ovary of DMBA-sutured animals at any timepoint (except the two neoplasms that developed in the ovary contralateral to the DMBA-sutured ovaries). The fibrosis seen histologically in the clean suture ovaries could only be visualized when the image/spectra were taken directly across the suture, suggesting that the inflammatory region was limited to the area around the suture. An OCT image, histological section, and LIF spectra from a typical VCD-treated control ovary (contralateral to clean suture at ) are shown in Figs. 2a, 2b, 2c , respectively. As was typical of the VCD-treated animals, the ovary was very small ( diam). OCT and histology both show a small amount of fat in the upper right-hand corner. The remaining portion of the ovary in both images is dominated by the stroma, which is the structural portion of the ovary with large collagen content. It appears fairly uniform in the OCT image, showing a rapid exponential decay in intensity as a function of depth. Fig. 2(a) OCT image, (b) corresponding histology section, and (c) corresponding LIF spectra for a follicle deplete control rat ovary. The OCT image shows fat (Fa) and stroma (S), also seen in histology. Spectra show a strong peak. OCT image , histology to same scale. LIF vertical axis is wavelength in nanometers, horizontal axis is lateral distance , and grayscale value is emission intensity in au. 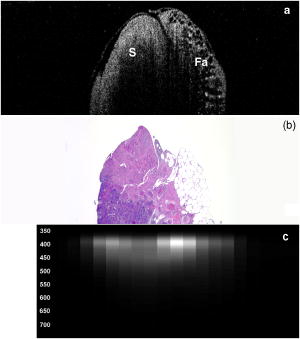 The LIF spectra from this ovary are dominated by the peak, which is indicative of high relative collagen content. This finding is expected, since there should be little metabolic activity in this quiescent ovary. There is also a relatively small amount of vasculature, as seen from the LIF spectra (less pronounced dip at ), which was confirmed histologically. 3.2.3.One-month 7,12-dimethylbenz(a)anthracene-sutured ovaryAn OCT image, histological section, and LIF spectra from a representative DMBA-sutured ovary at the one-month imaging timepoint are shown in Figs. 3a, 3b, 3c , respectively. In the OCT image, the ovary is enlarged. An interesting disruption in the stroma appears as small hypointense regions different from the appearance of normal fat [e.g., as seen in Fig. 2a]. The histological section confirms that this region of stroma contains large-scale follicular remnant degeneration with associated cells with a foamy cytoplasm, consistent with steroid secreting cells found in a corpus luteum. This particular ovary had regions of atypia; the atypia in this and other ovaries was located in the same region as large amounts of follicular remnant degeneration. Fig. 3(a) OCT image, (b) corresponding histology section, and (c) corresponding LIF spectra for one-month DMBA-treated atypical rat ovary. The OCT image shows many small hypointense regions corresponding to follicular remnant degeneration in histology. Spectra show similar intensities at 390 and . OCT image , histology to same scale. LIF vertical axis is wavelength in nanometers, horizontal axis is lateral distance , and grayscale value is emission intensity in au.  Figure 3c shows LIF spectra with the ratio of emission intensity being approximately one. In general, at one month the atypical ovaries showed a relative increased magnitude of emission compared to the VCD-treated control ovaries, which would suggest a relative increase in NADH and thus a more metabolically active or more cellular ovary. An increase in metabolic activity is common in atypical tissue. 3.2.4.Three-month 7,12-dimethylbenz(a)anthracene-sutured ovaryAn OCT image, histology, and LIF spectra from a representative three-month ovary with preneoplasic lesions are shown in Figs. 4a, 4b, 4c , respectively. In the OCT image, follicular remnant degeneration and disruption of the stroma can be identified by the round, irregularly sized hypointense regions. The size of the hypointense areas increased between the one- and three-month timepoints, suggesting more severe degeneration of the granulosa cells, surrounding empty follicles. Again, locations of atypia corresponded with the follicular remnant degeneration. Visualization of the very small papillary regions and the subcellular indications of proliferation were beyond the capabilities of the OCT system. Fig. 4(a) OCT image, (b) corresponding histology section, and (c) corresponding LIF spectra for three-month DMBA-treated atypical rat ovary. The OCT image shows irregular hypointense regions corresponding to follicular remnant degeneration in histology. Spectra are variable but show similar intensities at 390 and . OCT image , histology to same scale. LIF vertical axis is wavelength in nanometers, horizontal axis is lateral distance , and grayscale value is emission intensity in au.  The LIF data shown in Fig. 4c are similar to that seen in the abnormal one-month ovary [Fig. 3c]. The peak is dominant but a strong peak (relative to the peak), with a pronounced dip is also seen. In general, with both the normal and abnormal ovaries a large amount of variability was seen in the LIF data. 3.2.5.Five-month 7,12-dimethylbenz(a)anthracene-sutured ovaryAt the five-month timepoint, three of the ovaries had solid and/or cystic malignant tumors. In the representative OCT image presented in Fig. 5a , the ovary contained multiple hypointense regions. The small, regular-appearing hypointense regions on the surface of the ovary were easily identified as fat due to their characteristic appearance, and the large subsurface hypointense regions were identified as cysts. Cysts typically have clear proteinaceous contents, and therefore appear as well-defined hypointense regions on OCT images. These identifications were in agreement with the corresponding histologic section [Fig. 5b]. This ovary had invasive cancer arising from both the Sertoli- Leydig cells in the stroma and from the epithelial cells in the lining of the cyst. Histology of the stromal region showed many active and dividing cells. While this ovary clearly appeared abnormal in the OCT image, it could not be identified as neoplastic, since the markers of neoplasia (e.g., abnormally large or irregular nuclei) are not identifiable with conventional OCT systems. Therefore, it appears that OCT may be of use in identifying abnormal-appearing ovaries, but by itself cannot make a determination of atypical changes or neoplasia. New developments such as molecularly targeted scattering contrast agents39, 40 or image processing techniques such as texture analysis41 may enable this discrimination. Fig. 5(a) OCT image, (b) corresponding histology section, and (c) corresponding LIF spectra for five-month DMBA-treated neoplastic rat ovary. The OCT image shows surface fat and large cysts (C). Spectra over cysts shows strong intensity. OCT image , histology to same scale. LIF vertical axis is wavelength in nanometers, horizontal axis is lateral distance , and grayscale value is emission intensity in au.  The corresponding LIF spectra [Fig. 5c] have two distinct shapes of spectra. On the left side of the ovary, the peak is dominant. Although this region contains relatively small cysts, it is primarily composed of neoplastic stroma. It is expected that during rapid cellular proliferation of neoplastic tissue, NADH levels would be high and the relative intensity of the peak would increase. The spectra from the right side, which corresponds to the large cyst, conversely are dominated by the peak. The strong relative intensity of emission suggests the presence of collagen or another compound with similar fluorescence emission in the cyst contents. Large cysts consistently produced a strong relative emission. Future work will include polarization-sensitive OCT and alternative histological stains to study the distribution and organization of collagen in ovarian cysts. Stromal regions of all neoplastic ovaries demonstrated a characteristically low fluorescence emission ratio. The ratios obtained from the three normal-appearing DMBA-treated ovaries at this timepoint were similar to the normal-appearing ovaries measured at one and three months. 3.3.Combined Light-Induced Fluorescence AnalysisWhen analyzing fluorescence emission ratios for the many different groups in this study, it was found that there was no significant time dependence (between one, three, and five months) in the ratios for VCD-treated control (contralateral to clean suture and sham surgery); DMBA-treated normal; or DMBA-treated atypical ovaries. Therefore, LIF data from all of the timepoints were combined into five groups: 1. cycling animals, 2. VCD-treated controls, 3. DMBA-treated normal, 4. DMBA-treated atypia, and 5. DMBA-treated cancer. Although there was no statistically significant difference between LIF emission ratios for all the types of non-neoplastic control ovaries, only the contralateral to clean suture and sham surgery ovary data are included in group 2, to minimize variability in the data and to assure that the control ovaries were completely normal. As mentioned earlier, only stromal regions were analyzed; cystic and fat-dominated regions were excluded. The ratios of fluorescence emission intensity at and for the five groups are displayed in Fig. 6 . Fig. 6Ratios of fluorescence emission intensity (390:450 and ) for five histological groups (mean and standard deviation). The indicates statistical significance compared to the follicle deplete group.  In cycling ovaries, the average emission ratio is approximately 1, suggesting similar contributions to the fluorescence spectra of both collagen and NADH. This result is dramatically different from the collagen-dominated spectra characteristic of the VCD-treated control ovary (average ratio nearly 2). The low average ratio of the cycling ovary suggests a higher concentration of hemoglobin compared to the VCD-treated ovary. Both the and ratios are statistically significantly different between these two groups. The average ratio is smaller in the DMBA-treated cancer group compared to the other VCD and VCD-DMBA-treated groups. The difference was statistically significant between VCD control and DMBA-treated cancer groups. Interestingly, there is little difference in either emission ratio between the DMBA-treated cancer and the normal cycling animals. This may be due to the fact that both ovaries are metabolically active, therefore LIF is unable to distinguish between the two groups. Since the OCT appearance of cycling and malignant ovaries is dramatically different, there is little possibility of confusing the two groups if a dual modality approach is undertaken. Normal appearing and atypical DMBA-treated groups are not statistically different from each other or the VCD-treated controls. While several DMBA-treated atypical ovaries (e.g., the ovary in Fig. 3) showed a relative increase in fluorescence emission, overall the spectra were highly variable, due to the large variation in ovarian tissue. Increased collagen production, due to scar tissue forming in reaction to the suture, may have masked an increase in NADH. In addition, the heterogeneity in vascularity made differentiation based on LIF emission ratios inconclusive. Even with these confounding factors, a clear trend toward decreased ratio is noticed as the ovaries progress from normal to atypical to neoplastic. Numbers in this pilot study were small; if a larger number of ovaries were analyzed, the fluorescence emission ratios for the atypia group might reach statistical significance when compared to the follicle deplete animals. Previous studies on LIF of human ovaries did not separate normals into pre- and postmenopausal groups, therefore no comparison is possible. However, these LIF results are consistent with our previous studies of cancer in small animals, for example an increase in the intensity ratio was seen in colonic adenomas of mice.42 Our results are also consistent with the macaque study,37 in which less metabolically active ovaries showed a relative decrease in fluorescence emission at . 3.4.Future DirectionsIn this study, we demonstrated the feasibility of using a combined OCT/LIF system to determine the presence of atypical and neoplastic changes in the ovary. Different structures such as cysts, fatty regions, and follicular remnant degeneration were easily identified in the OCT images. There was preliminary evidence from this study that atypical cellular changes might be located in the regions identified by irregularly sized hypointense regions in the OCT images, but OCT could not directly distinguish atypical cells and areas of cancer. The LIF spectra provided information about hemoglobin content as well as the metabolic activity of the ovary, and displayed significant changes between follicle deplete control emission ratios and both cycling and neoplastic emission ratios. Therefore, this study suggested that by utilizing combined OCT and LIF data, it may be possible to distinguish between cycling, follicle deplete, nonatypical, atypical, and neoplastic ovaries. Proof of this capability awaits a larger study. This pilot study also illuminated some limitations in the treatment protocol that will be addressed in larger studies. The method of DMBA administration produced some unexpected difficulties. Due to the extremely small size of the follicle deplete ovary, the suture was not always placed through the center of the ovary. Introduction of the nondegrading foreign material caused fibrosis around the suture, which increased the collagen content. The surgery itself produced varying amounts of adhesions that needed to be dissected away from the ovary prior to imaging. Although our method successfully produced preneoplastic and neoplastic lesions, injection of the DMBA per Tanaka 43 will be considered for future studies, particularly if the DMBA can be successfully administered between the bursa and surface epithelium, which would allow for direct contact of the DMBA to the surface epithelium. The neoplasms produced using the proposed method would more likely arise from the epithelial cells. Second, it is known that ovarian cancer incidence increases with age. However, the ovaries in this study had a rapidly and artificially induced ovarian failure and were not from “older” animals. The hormone levels and other factors associated with menopause have been well characterized in this model and closely mimic those of postmenopausal women, but the actual changes that occur in the aging process (e.g., repeated injury to the surface epithelium from ovulation) may mean that this model is less susceptible to cancers compared to one developed with an older animal. A third limitation is due to our current instrumentation. While the OCT subsystem has high resolution, the LIF has a resolution of approximately , and thus is relatively insensitive to small features or regions of abnormality. Improvement of the resolution of the system will increase localization and specificity of obtained spectra, facilitating direct comparison between OCT images and LIF spectra. Additionally, in the future we plan to develop new instrumentation to enable studies in vivo. Despite the limitations, this animal model will be beneficial for studying ovarian carcinogenesis, testing chemopreventive/therapeutic agents, determining the effect of hormone replacement therapy, and screening technology for the detection of early cancers. In-vivo imaging will be used to follow the ovarian changes in each animal, and will provide valuable information on the development of ovarian cancer, as well as determining the mechanisms of contrast in OCT images and interpreting LIF spectra of ovaries. The subsurface imaging capability of OCT would allow identification of cysts, and potentially, with contrast agents, could image regions of surface epithelial proliferation/neoplasia. The addition of LIF could enhance the differentiation of normal and cancerous regions. OCT/LIF are nondestructive, so imaging could be performed quickly during laparoscopy in any women where the status of the ovaries was questionable. In very high risk women, a diagnostic test could be performed on a yearly or biyearly basis if an acceptable route of access (e.g., transvaginal) were developed. AcknowledgmentsWe would like to acknowledge funding from the NIH (AG021948, CA83148, CA109385, and T32 EB00809). We appreciate the helpful conversations with Urs Utzinger and John Davis. ReferencesAmerican Cancer Society,
“Cancer facts and figures 2003,”
(2004). Google Scholar
A. K. Godwin,
J. R. Testa, and
T. C. Hamilton,
“The biology of ovarian cancer development,”
Int. J. Cancer, Suppl., 71
(2), 530
–536
(1993). 0898-6924 Google Scholar
Y. Miki,
D. Shattuck-Eidens,
P. Futreal,
K. Harshman,
S. Tavtigian,
Q. Liu,
C. Cochran,
L. Bennett, and
W. Ding,
“A strong candidate for the breast and ovarian cancer susceptibility gene BRCA1,”
Science, 266 66
–71
(1994). 0036-8075 Google Scholar
J. Stratton,
P. Pharoah,
S. Smith,
D. Easton, and
B. Ponder,
“A systematic review and metaanalysis of family history and risk of ovarian cancer,”
Br. J. Obstet. Gynaecol., 105 493
–499
(1998). 0306-5456 Google Scholar
J. K. Tobacman,
M. H. Greene,
M. A. Tucker,
J. Costa,
R. Kase, T. F. Fraumeni Jr.,
“Intra-abdominal carcinomatosis after prophylactic oophorectomy in ovarian-cancer-prone families,”
Lancet, 2
(8302), 795
–797
(1982). 0140-6736 Google Scholar
H. Salazar,
A. K. Godwin,
M. B. Daly,
P. B. Laub,
W. M. Hogan,
N. Rosenblum,
M. P. Boente,
H. T. Lynch, and
T. C. Hamilton,
“Microscopic benign and invasive malignant neoplasms and a cancer-prone phenotype in prophylactic oophorectomies,”
J. Natl. Cancer Inst., 88
(24), 1810
–1820
(1996). 0027-8874 Google Scholar
J. F. Stratton,
D. Thompson,
L. Bobrow,
N. Dalal,
M. Gore,
D. T. Bishop,
I. Scott,
G. Evans,
P. Daly,
D. F. Easton, and
B. A. Ponder,
“The genetic epidemiology of early-onset epithelial ovarian cancer: a population-based study,”
Am. J. Hum. Genet., 65
(6), 1725
–1732
(1999). 0002-9297 Google Scholar
K. H. Lu,
J. E. Garber,
D. W. Cramer,
W. R. Welch,
J. Niloff,
D. Schrag,
R. S. Berkowitz, and
M. G. Muto,
“Occult ovarian tumors in women with BRCA1 or BRCA2 mutations undergoing prophylactic oophorectomy,”
J. Clin. Oncol., 18
(14), 2728
–2732
(2000). 0732-183X Google Scholar
L. E. Puls,
D. E. Powell,
P. D. DePriest,
H. H. Gallion,
J. E. Hunter,
R. J. Kryscio, J. R. van Nagell Jr.,
“Transition from benign to malignant epithelium in mucinous and serous ovarian cystadenocarcinoma,”
Gynecol. Oncol., 47
(1), 53
–57
(1992). 0090-8258 Google Scholar
S. C. Plaxe,
L. Deligdisch,
P. R. Dottino, and
C. J. Cohen,
“Ovarian intraepithelial neoplasia demonstrated in patients with stage I ovarian carcinoma,”
Gynecol. Oncol., 38
(3), 367
–372
(1990). 0090-8258 Google Scholar
B. C. Vanderhyden,
T. J. Shaw, and
J. F. Ethier,
“Review: Animal models of ovarian cancer,”
Reprod. Biol. Endocrinol., 1 67
–78
(2003). Google Scholar
T. Nishida,
T. Sugiyama,
A. Kataoka,
K. Ushijima, and
M. Uakushiji,
“Histologic characterization of rat ovarian carcinoma induced by intraovarian insertion of 7,12-dimethylbenz[a]anthrancene-coated suture: Common epitheliam tumors of the ovary in rats,”
Cancer, 83
(5), 965
–970
(1998). 0008-543X Google Scholar
S. L. Stewart,
T. D. Querec,
A. R. Ochman,
B. N. Gruver,
R. Bao,
J. S. Babb,
T. S. Wong,
T. Koutroukides,
A. D. Pinnola,
A. Klein-Szanto,
T. C. Hamilton, and
C. Patriots,
“Characterization of a carcinogenesis rat model of ovarian preneoplasia and neoplasia,”
Cancer Res., 64 8177
–8183
(2004). 0008-5472 Google Scholar
J. C. Tunca,
E. Erturk,
E. Erturk, and
G. T. Bryan,
“Chemical induction of ovarian tumors in rats,”
Gynecol. Oncol., 21 54
–64
(1985). 0090-8258 Google Scholar
K. A. Crist,
Z. Zhang,
M. You,
W. T. Gunning,
P. B. Conran,
V. E. Steele, and
E. A. Lubet,
“Characterization of rat ovarian adenocarcinomas developed in response to direct instillation of 7,12-dimethylbenz[a]anthracene (DMBA) coated suture,”
Carcinogenesis, 26
(5), 951
–957
(2005). 0143-3334 Google Scholar
L. P. Mayer,
P. J. Devine,
C. A. Dyer, and
P. B. Hoyer,
“The follicle-depleted mouse ovary produces androgen,”
Biol. Reprod., 71 130
–138
(2004). 0006-3363 Google Scholar
P. B. Hoyer and
I. G. Sipes,
“Assessment of follicle destruction in chemical-induced ovarian toxicity,”
Annu. Rev. Pharmacol. Toxicol., 36 307
–331
(1996). 0362-1642 Google Scholar
J. A. Flaws,
K. L. Salyers,
I. G. Sipes, and
P. B. Hoyer,
“Reduced ability of rat preantral ovarian follicles to metabolize 4-vinyl-1-cyclohexene diepoxide in vitro,”
Toxicol. Appl. Pharmacol., 126 286
–294
(1994). 0041-008X Google Scholar
L. P. Mayer,
N. A. Pearsall,
P. J. Christian,
P. J. Devine,
C. M. Payne,
M. K. McCuskey,
S. L. Marion,
I. G. Sipes, and
P. B. Hoyer,
“Long-term effects of ovarian follicular depletion in rats by 4-vinylcyclohexene diepoxide,”
Reprod. Toxicol., 16 775
–781
(2002). 0890-6238 Google Scholar
M. G. Muto,
D. W. Cramer,
D. L. Brown,
W. R. Welch,
B. L. Harlow,
H. Xu,
J. P. Brucks,
S. W. Tsao, and
R. S. Berkowitz,
“Screening for ovarian cancer: The preliminary experience of a familial ovarian cancer center,”
Gynecol. Oncol., 51 12
–20
(1993). 0090-8258 Google Scholar
B. Y. Karlan,
“The status of ultrasound and color Doppler imaging for the early detection of ovarian carcinoma,”
Cancer Invest, 15 265
–269
(1997). 0735-7907 Google Scholar
B. S. Kramer,
J. Gohagan, and
P. C. Prorok,
“NIH consensus 1994: Screening,”
Gynecol. Oncol., 55 S20
–S21
(1994). 0090-8258 Google Scholar
A. R. Tumlinson,
L. P. Hariri,
U. Utzinger, and
J. K. Barton,
“Miniature endoscope for simultaneous optical coherence tomography and laser-induced fluorescence measurement,”
Appl. Opt., 43
(1), 113
–121
(2004). https://doi.org/10.1038/427113a 0003-6935 Google Scholar
A. M. Rollins,
R. Ung-arunyawee,
A. Chak,
R. C. K. Wong,
K. Kobayashi, M. V. Sivak Jr., J. A. Izatt,
“Real-time in vivo imaging of human gastrointestinal ultrastructure by use of endoscopic optical coherence tomography with a novel efficient interferometer design,”
Opt. Lett., 24
(19), 1358
–1360
(1999). 0146-9592 Google Scholar
H. Zeng,
A. Weiss,
R. Cline, and
C. E. MacAualy,
“Real-time endoscopic fluorescence imaging for early cancer detection in the gastrointestinal tract,”
Bioimaging, 6
(4), 151
–165
(1998). https://doi.org/10.1002/1361-6374(199812)6:4<151::AID-BIO1>3.0.CO;2-G 0966-9051 Google Scholar
M. G. Muller,
T. A. Valdez,
I. Georgakoudi,
V. Backman,
C. Fuentes,
S. Kabani,
N. Laver,
Z. Wang,
C. W. Boone,
R. R. Dasari,
S. M. Shapshay, and
M. S. Feld,
“Spectroscopic detection and evaluation of morphologic and biochemical changes is early human oral carcinoma,”
Cancer, 97
(7), 1681
–1692
(2003). 0008-543X Google Scholar
E. Svistun,
R. Alizadeh-Naderi,
A. El-Naggar,
R. Jacob,
A. Gillenwater, and
R. Richards-Kortum,
“Vision enhancement system for detection of oral cavity neoplasia based on autofluorescence,”
Head Neck, 26
(3), 205
–215
(2004). 1043-3074 Google Scholar
D. Huang,
E. A. Swanson,
C. P. Lin,
J. S. Schuman,
W. G. Stinson,
W. Chang,
M. R. Hee,
T. Flotte,
K. Gregory,
C. A. Puliafito, and
J. G. Fujimoto,
“Optical coherence tomography,”
Science, 254 1178
–1181
(1991). 0036-8075 Google Scholar
J. Schmitt,
“Optical coherence tomography (OCT): A review,”
IEEE J. Sel. Top. Quantum Electron., 5 1205
–1215
(1999). https://doi.org/10.1109/2944.796348 1077-260X Google Scholar
S. A. Boppart,
B. E. Bouma,
C. Pitris,
G. J. Tearney,
J. G. Fujimoto, and
M. E. Brezinski,
“Forward-looking instruments for optical coherence tomography,”
Opt. Lett., 22 1618
–1620
(1997). 0146-9592 Google Scholar
F. I. Feldchtein,
G. V. Gelinkonov,
V. M. Gelinkonov,
R. V. Kuranov,
A. M. Sergeev,
N. D. Gladkova,
A. V. Shakhov,
N. M. Shakhova,
L. B. Snopova,
A. B. Terent’eva,
E. V. Zagainova,
Y. P. Chumakov, and
I. A. Kuznetove,
“Endoscopic applications of optical coherence tomography,”
Opt. Express, 3 257
–270
(1998). 1094-4087 Google Scholar
S. A. Boppart,
A. Goodman,
J. Libus,
C. Pitris,
C. A. Jesser,
M. E. Brezinkski, and
J. G. Fujimonto,
“High resolution imaging of endometriosis and ovarian carcinoma with optical coherence tomography: Feasibility for laparoscopic-based imaging,”
Br. J. Obstet. Gynaecol., 106 1071
–1077
(1999). 0306-5456 Google Scholar
M. A. Brewer,
U. Utzinger,
J. K. Barton,
J. B. Hoying,
N. D. Kirkpatrick,
W. R. Brands,
J. R. Davis,
K. Hunt,
S. J. Stevens, and
A. F. Gmitro,
“Imaging of the ovary,”
Technol. Cancer Res. Treat., 3
(6), 617
–627
(2004). 1533-0346 Google Scholar
J. R. Lakowicz, Principles of Fluorescence Spectroscopy, 2nd ed.Kluwer Academic/Plenum Publishers, New York
(1999). Google Scholar
L. A. Belyaeva,
L. V. Adamyan,
V. P. Kozachenko,
A. A. Stratonnikov,
E. F. Stranadko, and
V. B. Loschenov,
“Fluorescence diagnostic in oncological gynecology,”
Proc. SPIE, 5068 55
–60
(2003). 0277-786X Google Scholar
M. A. Brewer,
U. Utzinger,
E. Silva,
D. Gershenson,
R. C. Bast,
M. Follen, and
R. Richards-Kortum,
“Fluorescence spectroscopy for in vivo characterization of ovarian tissue,”
Lasers Surg. Med., 29 128
–135
(2001). https://doi.org/10.1002/lsm.1098 0196-8092 Google Scholar
M. Brewer,
U. Utzinger,
W. Satterfield,
L. Hill,
D. Gershenson,
R. Bast,
J. T. Wharton,
R. Richards-Kortum, and
M. Follen,
“Biomarker modulation in a nonhuman Rhesus primate model for ovarian cancer chemoprevention,”
Cancer Epidemiol. Biomarkers Prev., 10 889
–893
(2001). 1055-9965 Google Scholar
R. V. Kuranov,
V. V. Sapozhnikova,
N. M. Shakhova,
V. M. Gelikonov,
E. V. Zagainova, and
S. A. Petrova,
“Combined applications of optical methods to increase the information content of optical coherent tomography in diagnostic of neo-plastic processes,”
Quantum Electron., 32
(11), 993
–998
(2002). 1063-7818 Google Scholar
C. Loo,
L. Hirsch,
M. H. Lee,
E. Chang,
J. West,
N. Halas, and
R. Drezek,
“Gold nanoshell bioconjugates for molecular imaging in living cells,”
Opt. Lett., 30
(9), 1012
–1014
(2005). 0146-9592 Google Scholar
C. H. Yang,
“Molecular contrast optical coherence tomography: A review,”
Photochem. Photobiol., 81
(2), 215
–237
(2005). https://doi.org/10.1562/2004-08-06-IR-266.1 0031-8655 Google Scholar
K. W. Gossage,
T. S. Tkaczyk,
J. Rodriguez, and
J. K. Barton,
“Texture analysis of optical coherence tomography images: feasibility for tissue classification,”
J. Biomed. Opt., 8
(3), 570
–575
(2003). https://doi.org/10.1117/1.1577575 1083-3668 Google Scholar
J. B. McNally,
N. D. Kirkpatrick,
L. P. Hariri,
A. R. Tumlinson,
D. G. Besselsen,
E. W. Gerner,
U. Utzinger, and
J. K. Barton,
“Task based imaging of colon cancer in a mouse model (ApcMin/+),”
Appl. Opt., 45
(13), 3049
–3062
(2006). https://doi.org/10.1364/AO.45.003049 0003-6935 Google Scholar
T. Tanaka,
H. Kohno,
M. Tanino, and
Y. Yanaida,
“Inhibitory effects of estrogenic compounds, 4-nonylphenol and genistein, on 7,12-dimethylbenz[a]anthracene-induced ovarian carcinogenesis in rats,”
Ecotoxicol. Environ. Saf., 52
(1), 38
–45
(2002). 0147-6513 Google Scholar
|


